SlideShare a Scribd company logo
1 of 20
Download to read offline
A “Buy” recommendation on Visa is issued with a one-year price target of
US$ 253.77, presenting a 19.1% upside potential based on the closing price
of US$213 on 10th Nov 2021. The target price is based on a Discounted Cash
Flow (DCF) methodology and supported by relative valuation. The posited
recommendation is based on the following theses:
(1) Growth in revenue in Visa’s APAC region
With gradual global tourism recovery and re-opening of borders, Visa is well
positioned to ride the recovery wave and increase its top line revenue.
(2) High inflation rates via demand-pull/supply-push inflation
Consumer price index and inflation rates have been peaking since Nov 20 –
US inflation rate stands at 5.4% as of Sep 21. Coupled with little to no policy
change as mandated by the federal government, inflation rates will result in
rise in cost of goods and services. Further, supply chain bottlenecks via labour
crunches and lockdowns have also resulted in supply-push inflation. Visa’s
business model works as an inflation hedge and is well positioned to take
advantage of these alarming economic indicators.
(3) Hike in swipe fees and interchange fees come Apr 2022
Visa has announced a hike in swipe fees come Apr 2022, in order to increase
its top line revenue per payment volume and number of transactions. This
catalyst will bring about an increment in top line revenue, subject to any
possible postponements/changes to this intended announcement.
GICS Sector: Financial Services
Industry: Credit Services
USA | New York Stock Exchange (NYSE)
Nathaniel Theodore Ling
Visa (NYSE:V)
How art thou payments?
10th November 2021
Executive Summary
Share Price History
180
200
220
240
260 11/11/2020
11/12/2020
11/1/2021
11/2/2021
11/3/2021
11/4/2021
11/5/2021
11/6/2021
11/7/2021
11/8/2021
11/9/2021
11/10/2021
NYSE:V Overview
Last Closed Price: 213.39
Upside: 20.10%
Market Cap: 437.2B
Shares Outstanding: 1.8B
52-Week High: 252.67
52-Week Low: 192.81
Forward P/E 30.26
Actuals Estimates
2018A 2019A 2020A 2021A 2022E 2023E 2024E 2025E 2026E 2027E
Key Financials (US$M)
Revenue 26,100 29,150 28,510 32,472 36,625 40,994 45,478 49,690 53,744 57,784
Growth Rate (%) 11.7% (2.2%) 13.9% 12.8% 11.9% 10.9% 9.3% 8.2% 7.5%
EBITDA 13,567 15,657 14,848 16,608 18,156 20,319 22,388 24,425 26,757 29,092
EBITDA Margin (%) 65.8% 68.1% 68.0% 68.9% 67.4% 67.4% 67.4% 67.3% 67.7% 68.0%
ROE (%) 34.8% 30.0% 32.8% 34.0% 31.0% 28.4% 26.1% 24.4% 22.9%
ROIC (%) 13.5% 10.1% 11.5% 11.9% 12.1% 11.8% 11.4% 11.4% 11.3%
Debt/Equity Ratio 1.09 1.23 1.21 1.10 0.84 0.71 0.61 0.48 0.39
Operational Metrics
Payment Volume (US$B) 11,269 11,597 11,347 13,001 14,157 15,192 16,140 17,058 17,857 18,547
No. of Transactions (Millions) 182,974 201,871 204,097 232,448 265,005 298,864 333,217 367,137 399,569 431,609
Founded in 1958, Visa (NYSE:V) is a global market leader in digital payments,
acting as a payment network processor intermediary that facilitates global
transactions amongst different stakeholders (consumers, financial institutions,
businesses and merchants, etc). Visa concluded FY21 with US$13T in total
payment volume and 232B processed transactions globally, thus achieving a
record breaking US$24.1B in net revenue.
Visa operates a “four-party” model (Fig 1) – facilitating secure, reliable and
convenient transactions among financial institutions, merchants, and
consumers. Following the rise of fintech disruption via open and digital
banking, mobile wallets (open/closed loop systems), and cryptocurrencies
(decentralised finance), Visa has continued to branch beyond the traditional
model, partaking in these new market segments as mentioned above. Some
prominent innovations/enhancements include:
(1) Advancements of VisaNet
VisaNet, Visa’s bread and butter service in facilitating payment transactions,
recently unveiled VisaNet AI+, a suite of AI-powered services including the
likes of
(a) Smarter Posting: Provision of real time visibility into consumers’
finances/transaction history
(b) Smarter Settlement: Enablement of treasury teams across
corporates/financial institutions in predicting daily cash volumes
and making strategic decisions across a customised 7-day
forecast
(c) Smarter Stand In Processing (STIP): Authorisation of
transactions despite outages, as its current capabilities help to
generate an informed decision to approve/decline transactions on
behalf of issuers.
These value-added services help to entrench stakeholders within Visa’s
network and possibly create new revenue streams within transaction
processing.
(2) Visa Developer
Visa Developer (Fig 2) is an open-source framework that allows
corporates/developers to build various systems/products while utilising Visa’s
source code. The frameworks provide an array of services across different
categories such as commercial payments, payment methods, data analytics,
and security. These advancements allow Visa to penetrate the eco-system
via:
(a) Providing more retailers/merchants with ease of convenience to
integrate with Visa depending on their needs. For example,
Walmart, NFL and Starbucks have integrated with Visa to adopt
online check out services within their websites due to better user
experience and higher conversion rates in payments.
(b) Accessing new market segments that Visa has yet to establish a
footing in, especially the likes of P2P/B2B/BNPL transactions
within mobile wallet eco systems. Although Visa does not posit a
market leading position within these nascent eco-systems,
Vasant Prabhu (CFO) opined Visa to minimally grab some parts
of the value chain based on existing Visa frameworks that new
products/services can be built on – thus Visa is able to charge for
API calls, etc.
(3) Visa Direct
Business Overview
Fig 1: Visa Four Party Model
Fig 3: B2B Transaction Pain-points
Fig 2: Visa Developer
Source: Visa
Source: Deloitte
Adding to Visa Developer, VisaDirect is Visa’s in house network that facilitates
new flows, such as P2P, B2B and G2C payments. Particularly for B2B
transactions, Visa devoted a deeper focus in grabbing more market share in
the nascent space due to various pain-points being faced (Fig 3). For
example, Visa established partnerships with Veem, Credorax, Ignition, Ramp
and Standard Chartered Bank over FY21 to facilitate cross border B2B
transactions across Europe, Latin America and USA. These initiatives will
subsequently support virtual card capabilities, spur growth in new payment
flows, and drive incremental volume over time.
Further, recent acquisitions for FY21 include (1) Tink (US$2B) – a leading
fintech start-up focusing on open banking APIs in Europe and (2)
CurrencyCloud (US$800M) – a fintech start-up providing forex solutions for
cross-border payments. Acquisitions of these start-ups help Visa to navigate
an unchartered territory within Europe and possibly fortify its dominant market
position, as recent development in regulations could result in competition of
Visa’s market share (Fig 4).
Business Model
Visa has 3 key revenue streams, which are supported by client incentives (Fig
5):
(1) Service Revenue
Service revenues are what the company earns for services provided to card
issuers for the use of Visa’s products. The primary driver of this category is
payment volume, which Visa takes a % take-rate off the transaction value. A
unique property of this revenue stream is that it is a built-in hedge against
consumer inflation – since if cost of goods rises due to demand-pull/supply-
push inflation, Visa’s revenue scales accordingly with the cost of goods and
services.
(2) Data Processing Revenue
Data processing revenues are fees that Visa collects for the authorisation,
settlement, clearing, and other various access and maintenance fees for using
its vast payment network. These revenues are based on the number of
transactions made on Visa’s network and not the amount of payment volume.
For further elaboration: (1) Authorisation is the process Visa routes the
transactions from Point-Of-Sale (POS) to the card issuer for approval, (2)
Clearing is the exchange of transaction information between the issuer and
the acquirer of the transaction, and (3) Settlement is the facilitation of the
actual exchange of funds involved between the involved parties.
(3) International Transaction Revenue
International transaction revenues are earned for cross-border and currency
conversion activities. These revenues are generated whenever a card holder
purchases a good in a country different from the card-issuer’s country or
origin. This revenue stream is typically sensitive to economic cycles,
especially virus outbreaks or act of terrorism/political instability that will affect
the region’s tourism industry. It also means Visa is affected by the strength of
the US dollar more than most companies.
(4) Client Incentives
Client incentives are deduction from the sum of the 3 revenue streams above.
They are monetary payments to Visa’s partners to build product acceptance,
build payment volume, and routing of transactions to Visa’s network.
Corporate Governance
Visa has an exemplary governance structure to facilitate future growth via
board of directors, executive management and compensation, and
shareholder rights.
Fig 4: Regulation Implications
Fig 5: FY21 Revenue
(1) Board of Directors (BoD)
Visa’s BoD (Annex A) comprises of 12 key members. possessing knowledge
and experience across relevant fields that are integral for Visa’s future growth.
More than 60% of the directors have >5 years of experience, coupled with
ethnic diversity, gender equality, and payments and technology domain
knowledge.
(2) Executive Committee
The executive committee comprises of 6 members (Annex B), responsible for
the day-to-day operations and future growth of the company. The team is
highly experienced and has relevant education and background experience –
including finance, marketing, consumer banking, technology and information
security, which contributes to Visa achieving its long term goals. The C-suite
to work pay ratio is a reasonable ratio of 195:1, way below the usual average
of 320:1. This is attributable to Visa’s vision on investing in its workforce.
Renumeration of the executive committee is also linked to the performance of
the company, as cash incentives are pegged to 50% of the annual fixed base
salary. This ensures that the committee are intrinsically motivated to make
strategically sound and profitable decisions for the company.
(3) Shareholders
Visa enjoys a diversified base of institutional shareholders (Vanguard Group,
Blackrock, T. Rowe Associates, State Street Corp, Morgan Stanley, etc) (Fig
6). Further, the company has a less than 10% equity concentration from each
significant shareholder, thus ensuring diversity and prevention of price
crashes via sudden sell-offs.
The payments industry (Fig 7) has been growing ever since economies
gravitated towards cashless payments from the general usage of cash
transactions. This is coupled with a rising middle class who use credit/debit
cards for various purchases of goods and services, contributing to the
increasing average order value and number of transactions. Further, the
industry is poised to grow at a 7.3% CAGR to US$2.1T in 2025 with the
following demand drivers as the global economy starts to recover post COVID-
19.
(1) Gradual re-opening of economies
As 40% of the global population is fully vaccinated, the United Nations World
Tourism Organisation (UNWTO) opined a gradual recovery of global tourism
with a high probability of hitting its pre-pandemic levels between at mid 2023,
with domestic tourism seeing recovery as early as mid 2022. Further,
vaccinated travel lanes amongst countries have been expanding and this has
resulted in an uptick in travel demand. As a result, a “ripple effect” will be
experienced in the payments industry as revenues via credit cards and cross
border transactions will increase within the next 24 months.
(2) Growth in E-commerce
The COVID-19 pandemic has brought about a shift in sales from brick-and-
mortar outlets to e-commerce, as seen by high revenue growth in e-commerce
players along the value chain such as SEA Group, Amazon, Coupang,
Pinduoduo, Shopify, etc. The industry is still poised to grow at a 14.1% CAGR
to US$7.4T in 2025 (Fig 8) as brick-and-mortar outlets remain diversified in
their sales outlets and a growth in in Average Order Value (AOV) with rise of
the purchasing power of an average middle-class individual across the globe.
Visa will have ample opportunities to be a leading payment processor in this
space, given how the executive committee has been establishing partnerships
with merchants, credit card providers, and payment gateway providers.
Industry Overview
Significant shareholders % shares
Vanguard Group 8.46%
Blackrock 7.34%
Price (T.Rowe) Associates 4.88%
State Street Corporations 4.34%
Morgan Stanley 2.47%
Fig 6: Significant Shareholders
0
1
2
3
2020 2025 2030
Fig 7: Payment Industry (US$T)
Source: BCG
$3.4
$4.2
$4.9
$5.5
$6.6 $6.8
$7.4
0
4
8
-
10.0%
20.0%
30.0%
2019 2020 2021 2022 2023 2024 2025
E-commerce sales (US$T)
% change
% of total retail sales
Fig 8: E-commerce Industry (US$T)
Source: Emarketer
(3) Continued industry consolidation and M&A
Across the diverse payment industry market segments, market leaders in
each aspect of the value chain have been acquiring the toeholds or other
segments to gain a stronger overall footing – evidenced by notable Paypal-
Honey, Paypal-Paidy and Square-Afterpay acquisitions. Visa has also
acquired notable fintech start-ups such as Tink and CurrencyCloud. Further,
newer market segments such as BNPL/P2P transactions and mobile wallets
will result in more acquisition/consolidation activity in the next few years.
Competitive Positioning
Visa’s competitive position (Fig 9) is anchored in its large payment network,
economies of scale and merchants onboarded – thus creating a sticky
platform usage. In a more traditional payment processing competitive
analysis, we can identify that thus far, Visa has been the market leader in the
payment network space (over 60% of payment volume, transactions and
cards belongs to Visa). However, constant disruption of the fintech industry
and creation of new market segments could throw Visa off its footing in the
long run. An analysis of sub-segments in the payments industry will help to
map out the competitive space, showing if Visa can withstand market
disruption and hold its position as a market leader in the long run.
(1) Payment gateway providers
With the proliferation of e-commerce, payment gateway providers (Stripe)
have been essential in the online payment value chain. Companies operating
in this segment facilitates online payments where a credit/debit card is not
physically present, creating a secure connection between the card issuer and
the online shopping website. Payment network providers on the other hand
(Visa) handles the card transaction, which is encrypted data from the payment
gateway provider (Fig 10). Hence, these two stakeholders do not compete
with each other but form a segment of the entire payment value chain.
However, these payment gateway providers could look into expanding their
suite of services and gradually look to support a payment network should
economies of scale be enticing enough. I opine this to be rather unlikely since
establishing over 60 years of a network effect like Visa is a huge barrier to
entry, thus these players will remain to branch their services across different
shopping sites/applications and remain as a gateway provider instead.
(2) Mobile wallets
Recently, there has been a proliferation of mobile wallet providers from banks,
digital payment providers, and large conglomerates. The mobile wallets aim
to possibly eliminate payment network intermediaries out of the value chain
(Fig 11), thus saving in transaction fees and having consumers’ dataset to
create new value streams (loans, working capital financing, reward systems
etc). Thus, mobile wallets pose a huge threat to the payment network
incumbents so long as user uptake growth and monetary transaction remains
within the wallet’s eco-system. Mobile wallets can be further categorised into
(a) Open-loop: Able to transact with different merchants when
payments are made (E.g AliPay, GooglePay, CashApp, PayPay,
GrabPay, etc)
(b) Closed-loop: Created internally for consumer related
conglomerates where one uses the wallet for transaction within
the conglomerate’s outlets. (E.g Walmart, Starbucks)
(3) End-to-end digital payments (acquirers and processers)
Square and Paypal are notable market leaders although they have different
origins. Paypal originally provided online payment processing by granting the
ability to transfer funds electronically between individuals and businesses, like
a payment processing network but for online payments (usage of ACH –
Automated Clearing House) (Fig 12). Over time, the company now acts as an
0%
100%
Payment
Volume
Total Volume Total
Transactions
Cards
Visa Mastercard American Express JCB Diners Club
Fig 9: Visa Market Share
Source: Visa
Fig 10: Gateway Value Chain
Fig 11: Mobile Wallet Value Chain
acquirer, payment gateway, network processor, etc, and even created its own
mobile wallet (PayPay), with the goal of creating an eco-system so that
monetary value doesn’t leave PayPal (further elaboration on mobile wallet
analysis below). On the other hand, Square initially provided Point-Of-Sale
(POS)/magnetic stripe reader services focusing on SMEs), and subsequently
branched into a mobile wallet (CashApp), with a similar goal of retaining
monetary value in its own eco-system. These companies pose a significant
threat to payment network bigwigs as they have established a footing in
another aspect of the payments landscape and yet aim to eliminate the
intermediaries by creating their own eco-system
(4) Decentralised finance and cryptocurrencies
Eventual progress in blockchain protocols has created specific chains focused
on decentralised finance such as Ethereum, Solana, and Luna (powered by
Terra). Subsequently, a myriad of projects have been created off these initial
chains that enable decentralised finance. For example, Terra Luna supports
transaction and staking of stablecoins that offer instant settlement, low fees,
and seamless cross border transactions. Despite DeFi’s infancy and relatively
low uptake, such disruption can not be ignored as its threat is more significant
than the uptake of mobile wallet transactions.
Porter’s 5 Forces
After reviewing the industry and the broader competition against Visa, a
porter’s 5 forces analysis shows threat of substitute products as one of the
strongest threat and most imminent should user uptake and preference
growth exponentially (Fig 13, Annex C). As a result, Visa looks to mitigate its
risk via different strategies, which will be explained in the risk segment further
into the report.
Despite stellar Q4 FY21 earnings to close out a strong financial year for Visa,
the stock price has been corrected by almost 20% due to conservative
management estimates for FY22 and upcoming litigation settlements on its
“swipe fees”. However, Visa has potential tailwinds that can act as a further
catalyst for its increase in share price.
(1) Growth in Visa’s revenue in APAC region
Visa’s APAC payment and transaction volume have been relatively muted due
to its closed economy – its total revenue 30% below 2019 figures. As such,
the re-opening of key countries in APAC region is a key variable in Visa’s top-
line growth. As of end 2021, countries such as Singapore, Indonesia,
Thailand, South Korea and India have re-opened its borders with selective
countries. With a 13% APAC market share (Fig 14) as of FY20 (larger than
Mastercard’s 7%), gradual re-opening of the economy for business/tourism
shows promise as a catalyst for Visa.
Further promise lies on other countries such as Japan, Hong Kong, China,
Malaysia, Vietnam, Philippines as they currently remain closed to most
international travellers. Vaccinations rates (Fig 15) have been increasing –
most countries mentioned above have >50% vaccination rates. Additionally,
Q4 earnings review mentioned renewal Visa’s top 20 issuers in APAC and
investment focus into digital solutions to ride the digital wave in Southeast
Asia (Visa Paywave, tokenisation, QR Codes, etc). Thus, re-opening of
borders ais opined to be imminent and the recovery of travel and tourism will
be assuring for Visa.
(2) High inflation rates via demand-pull/supply-push inflation
Investment Thesis
76%
13%
7%
2%
1% 1%
UnionPay
Visa
MasterCard
JCB
AMEX
Diners
Fig 12: ACH Value Chain
0
1
2
3
4
5
Bargaining
power of
suppliers
Bargaining
power of
buyers
Threat of new
entrants
Threat of
substitute
products
Competitive
rivalry
Fig 13: Porter’s Five Forces
Fig 14: Market Share APAC (Incl China)
Source: Statista
Due to COVID-19, there has been a surge in supply chain bottlenecks,
resulting in supply-push inflation towards goods and services as export prices
have increased by about 10 points on the index globally, On the demand side,
volatile labour market conditions and global expansionary monetary policies
have led to a growth in inflation rates. For example, USA’s inflation rate
increased from 1.2% in Nov 20 to 5.4% in Sep 21 (Fig 16). Continued inflation
growth is ironically a good indicator for Visa given the nature of its business
model – Visa takes a percentage cut off the value of the transaction. As
inflation is priced into the various goods and services, Visa’s revenue will scale
along with inflation and top-line growth will increase by a healthy amount.
(3) Hike in swipe fees and slash in interchange fees come Apr 2022
Upon gradual recovery of the world economy, Visa/Mastercard will eventually
enact a merchant fee hike come April 2022 (contingent on future
circumstances). The blended increment of 4.7% in take rate (Visa will collect
US$1.99 from US$1.90 per US$100 transaction) will inevitably increase Visa’s
top line revenue by a sizeable amount, as the hike in fees projects an
increment of US$117 billion in costs for businesses globally (these costs will
be revenue for payment network providers).
Further, Visa is adopting a more aggressive strategy for card adoption in
specific sectors (real estate, healthcare, education, rent, parking, vending
machines) as it seeks to reduce its interchange fee (these are payments made
to card-issuing bank) from $1.15 to $0.77 for a US$50 transaction.
Management has opined that balancing out swipe fee increments with a slash
in interchange fees can drive top-line growth sustainably – swipe fees
increase to take advantage of the high-inflation environment and recovery of
tourism, and interchange fees decrease to drive user adoption growth (from
both merchants, banks, and consumers) in market segments where non-cash
payments are not widely used.
However, this thesis has a potential to fall flat as other stakeholders have
responded negatively towards the hike in take rate. Just recently, Amazon
released a statement to introduce a 0.5% surcharge fee for Visa credit card
transaction in Singapore and Australia from 15 Sep 2021 and 1 Nov 2021
respectively. Such retaliation will negatively affect Visa’s revenue. Upon
further analysis, is to be believed that these propositions may not adversely
affect Visa to a large extent since (1) Singapore is one of the smallest market
for Amazon (Amazon is implementing this surcharge fee in Singapore only),
(2) only purchases of goods and consumer electronics are affected (groceries,
in-app purchases, subscription schemes, etc are not affected), and (3) it has
been 2 months and there has been no subsequent announcement from
Amazon to introduce this surcharge fees onto other markets.
2018A 2019A 2020A 2021A 2022E 2023E 2024E 2025E 2026E 2027E
Financial Analysis
Profitability
Gross Margin 79.0% 78.8% 76.6% 74.2% 73.5% 73.5% 73.0% 73.0% 73.5% 74.0%
EBITDA Margin 52.0% 53.7% 52.1% 51.1% 49.6% 49.6% 49.2% 49.2% 49.8% 50.3%
Profit Margin 39.5% 41.4% 38.1% 37.9% 36.7% 37.1% 37.3% 37.6% 38.5% 39.3%
ROA 16.6% 13.4% 14.9% 16.2% 16.8% 16.6% 16.2% 16.5% 16.4%
ROE 34.8% 30.0% 32.8% 34.0% 31.0% 28.4% 26.1% 24.4% 22.9%
ROIC 13.5% 10.1% 11.5% 11.9% 12.1% 11.8% 11.4% 11.4% 11.3%
Liquidity
Current Ratio 1.56 1.91 1.75 1.49 2.21 2.88 2.86 3.52 4.90
Quick Ratio 1.33 1.64 1.47 1.20 1.86 2.53 2.58 3.21 4.54
Debt/Equity Ratio 1.09 1.23 1.21 1.10 0.84 0.71 0.61 0.48 0.39
Returns
Earnings per Share 5.5 6.4 5.8 6.5 7.1 8.1 9.0 9.9 11.0 12.1
Operational Metrics
Payment Volume (US$B) 11,269 11,597 11,347 13,001 14,157 15,192 16,140 17,058 17,857 18,547
No. of Transactions (Millions) 182,974 201,871 204,097 232,448 265,005 298,864 333,217 367,137 399,569 431,609
- 20% 40% 60% 80% 100%
Singapore
Cambodia
Malaysia
Hong Kong
Japan
South Korea
Australia
India
Philippines
New Zealand
Laos
Thailand
Indonesia
Vietnam
Myammar
Financial Analysis
Fig 15: Vaccination Rates APAC (%)
Source: Singapore Business Review
-
1.0%
2.0%
3.0%
4.0%
5.0%
6.0%
Nov-20
Dec-20
Jan-21
Feb-21
Mar-21
Apr-21
May-21
Jun-21
Jul-21
Aug-21
Sep-21
Fig 16: US Inflation Rate (%)
Source: Singapore Business Review
Historical revenue grew at a 7.6% CAGR to US$32B in FY21 and projected
revenue will grow at a 9.2% CAGR to US$52B in FY27 (Fig 17). All revenue
streams are projected separately and regionally. Service revenues are
determined by the amount of payment volume generated across key regions
for Visa and multiplied by a blended take rate. Transaction revenues are
determined by the number of transactions generated across key regions for
Visa and multiplied by a blended take rate. Cross border revenues are
determined by a percentage off payment volume. Payment volume, number
of transactions, and cross border revenues/others are then grown at a specific
rate catered specifically to each region to project Visa’s future revenue. On
base case, it is estimated that USA, APAC, and Europe will experience a
relatively higher growth in revenue as compared to other regions based on
global economic outlook (re-opening of economy to tourism, adoption of e-
commerce/digital payments, etc), with APAC being the most sensitive key
driver to overall revenue.
Visa’s margins have been stable over the past FYs, with a slight dip in margins
(Fig 18) attributable to increments in client incentives as part of the company’s
long term strategic growth. Client incentives will be likely to remain as 26-27%
of total revenue as compared to the average of 24-25%, since management
intends to be slightly more aggressive in onboarding/renewing partnerships
and deals with the company’s stakeholders – this will allow Visa to position
itself well post COVID-19 tourism recovery and during the e-commerce boom
in APAC.
Visa maintains its overall superiority in margins when compared to its peers,
along with strong ROA (13.4%) and ROE (30.0%). Despite strong
performances when compared to its peers, Mastercard presents a stellar ROE
at 102.5% (Fig 19). However, deeper analysis shows us that Mastercard is
undertaking huge leverage with his >2.0 Debt/Equity ratio when compared to
Visa’s 1.2 Debt/Equity ratio. A lower leverage ratio is desired during this global
economic recovery phase as the factors for recovery seem uncertain at this
point of time. Thus, a prudent debt/equity ratio is desired should future
financial quarters turn unfavourable. Further, an underleveraged capital
structure can readily support a post-COVID era expansion into different target
markets and market segments.
Overall, Visa is posited to maintain as the market leader in the payment
network landscape, achieving up to US$20T in payment volume and 431B
transactions by FY27.
A buy recommendation is reiterated with a 12-month price target of XX,
presenting a 19.1% upside potential on the closing price of US$213 on 10th
Nov 2021. In order to determine the value of the company, a DCF
methodology is applied with the use of (1) EV/EBITDA multiple and (2)
terminal growth rate. To confirm the robustness of the DCF, a sensitivity
analysis will be applied. The overall analysis is also supplemented with
relative valuation.
DCF Valuation
The DCF valuation employs the Free Cash Flow to the Firm (FCFF)
methodology to arrive at the intrinsic value of the company. This model fits
Visa’s profile, allowing to account for future growth prospects and the
generation of cash flow regardless of the capital structure. Visa’s historical
numbers are consolidated from FY18 to FY21 and projections are conducted
from FY22 to FY27.
-
20,000
40,000
60,000
Revenue
(US$B)
Service Transaction Cross Border Other(s)
-
0.5
1.0
1.5
2.0
2.5
-
30.0%
60.0%
90.0%
120.0%
Visa Mastercard American
Express
Discover
ROA ROE Net Margin Debt/Equity
Valuation
Fig 17: Visa’s Revenue (US$B)
Fig 18: Visa’s Margins (%)
Fig 19: Peer Comparables
-
20.0%
40.0%
60.0%
EBITDA Margin (%) Profit Margin (%)
Weighted Average Cost of Capital (WACC)
WACC (Fig 20) is estimated at 7.60% for Visa. Cost of debt is calculated by
taking the blended average on the corporate debt taken by Visa and adding
the 10-year risk free rate. The cost of equity is calculated with the CAPM
formulate, reflecting USA’s equity risk premium, risk-free rate, and Visa’s
historical 5 year Beta.
EV/EBITDA and Terminal Growth
EV/EBITDA multiple method is derived by taking public comparables across
payment network providers, end-to-end digital payment providers, and open-
loop/closed-loop digital wallet providers. For the terminal growth rate, Visa is
expected to stabalise at around 3% come FY30 onwards, pegged to the long
run growth rate of the top companies in mature industry segments.
Sensitivity Analysis
The DCF model’s robustness to changes was analyzed with respect to key
inputs – WACC, terminal growth rate, and EV/EBITDA multiple. It is to note
that a decline in APAC, USA, and Europe growth rates in payment volume
and transactions will influence the recommendation of Visa.
Relative Valuation
Public comparables has been identified and analysed, where Visa is
compared across payment network providers, end-to-end digital payment
providers, and open-loop/closed-loop digital wallet providers. Visa is trading
closely most peers that are largely related to Visa’s line of work with an
exception of Mastercard being valued at a slightly higher multiple. A plausible
reason could be due to Mastercard’s first mover advantage into B2B and
BNPL transactions, something Visa is still expanding on. However, the
stagnation of Mastercard’s growth and larger market share of Visa should
reprice Visa’s share price (Fig 21).
The top three investments risks (Fig 22) for Visa include (1) regulatory risks,
(2) rapidly changing business environment, and (3) business disruptions.
Although business disruptions via decentralized finance pose to harm
profitability and reduce investment return, Visa’s recommendation for
purchase is to take advantage of the mispriced share price over Q4 FY21
earnings and ride the tourism recovery and inflation wave for the next 12
months.
(1) Political risk: Regulation
Visa has been facing recent litigation cases over predatory pricing on its swipe
fees, thus translating into unhappiness amongst stakeholders on Visa’s
network. The inability to resolve these litigation cases can lead to loss of
market share to competitors such as Mastercard and suppressed revenue
Company Name Revenue (US$M) EBITDA US$(M) Enterprise Value Gross Margin EBITDA Margin EV/LTM REV EV/NTM REV EV/LTM EBITDA EV/NTM EBITDA
2019 2020 2021 2019 2020 2021
Payment Network
Visa Inc. 23,525 21,479 25,192 16,409 14,736 17,415 457,115 96.7% 68.6% 21.3x 16.2x 31.0x 23.0x
Mastercard 16,883 15,301 18,850 10,189 8,742 10,898 345,196 100.0% 57.1% 22.6x 16.0x 39.5x 26.7x
American Express 39,983 31,357 41,707 NM NM NM NM 70.4% NM NM NM NM NM
Discover Financial 8,228 5,954 12,020 NM NM NM NM 90.9% NM NM NM NM NM
Digital Payments
PayPal Holdings 17,772 21,454 25,220 3,411 4,295 7,394 237,781 46.6% 20.0% 11.1x 8.3x 53.3x 29.2x
Square 4,714 9,498 17,660 83 46 1,003 107,034 28.9% 0.5% 11.3x 5.9x NM 108.6x
Open-Loop Wallets
Amazon.com 280,522 386,064 470,265 36,193 48,150 69,956 1,870,927 39.6% 12.5% 4.8x 3.6x 34.4x 24.0x
Alibaba 70,214 98,675 135,923 20,290 23,602 29,123 408,342 43.2% 23.9% 4.1x 2.8x 16.2x 12.9x
Alphabet 161,857 182,527 253,960 48,133 54,903 105,973 1,864,695 53.6% 30.1% 10.2x - 32.3x -
Apple 267,683 294,135 371,719 78,121 85,159 123,770 2,420,255 38.8% 29.0% 8.2x 6.4x 28.4x 20.2x
Tencent Holdings 54,186 73,839 90,161 19,871 26,236 31,341 591,309 46.0% 35.5% 8.0x 6.0x 21.7x 17.6x
Closed-Loop Wallets
Starbucks Corporation 26,973 23,170 30,294 5,545 2,873 6,853 151,667 21.3% 12.4% 6.5x 4.6x 26.7x 21.5x
Walmart 523,964 559,151 560,038 32,455 38,100 37,068 462,951 24.8% 6.8% 0.8x 0.8x 11.2x 12.4x
StoneCo 594 612 819 342 298 352 8,583 76.2% 48.6% 14.0x 7.2x 28.0x 19.8x
Mean 10.3x 6.5x 29.3x 26.3x
Median 9.2x 6.0x 28.4x 20.8x
Investment Risks
Input Rate Source
Risk free rate 1.5% US 10-year Treasury
Beta 0.92 Capital IQ
Equity Risk Premium 7.3% USA
Cost of Equity 8.2% CAPM
Cost of Debt 2.6% Blended corporate rate+risk free rate
Tax Rate 19.5% Management's Guidance
WACC 7.5%
Fig 20: WACC Calculation
Fig 21: Football Valuation
growth as the company is unable to raise its swipe fees intended for April
2022. Next, the Europe Union has continuously mandated for an in-house
intra-Europe payment processing network (in order to reduce its dependence
on external intermediaries), thus reducing Visa’s presence in Europe should
such a network be built. Lastly, subsequent expansion strategies into Asia
such as China, India, and Russia can pose a significant barrier to entry as (1)
Russia prevents Visa from processing domestic transactions, (2) UnionPay in
China is the sole processor of domestic transactions and Visa’s approval to
operate in China could take several working years, and (3) India’s growing
nationalistic priorities could lead to cost implications on Visa.
Visa has recognized the inability to target the Asian countries with high barrier
to entry, thus it looks to solidify its positioning in other countries so as to remain
steadfast should players like UnionPay look to expand out of China. Further,
most litigation cases have been resolved peacefully (often only resulting in a
fine), thus Visa should still remain as a leading payment network provider.
(2) Market risk: Rapidly changing business environment
User uptake on mobile wallets and payments can lead to a different set of
consumer demands. Further, Visa can be eliminated out of this new eco-
system as future competitors look to entrench money without their own
payment network and therefore cut intermediaries out of the picture.
Visa is currently mitigating this risk by its Visa Developer API protocols so that
future systems surrounding mobile payments etc can be build on Visa and
there are able to capture a small share of this new eco-system.
(3) Operational risk: Business disruption
A huge disruption beyond just a different preference for a method of payment
in risk (2) will be the adoption of decentralised finance. Crypto projects built
on different chains such as Ethereum, Solana, Terra (hosted by Luna) aim to
cut off intermediaries where transaction of payments are supported by these
crypto projects. Although user uptake currently is at its nascent stages,
advancements in these projects and eventual user uptake cannot be ignored
as most value creation methods look to act as a new form of intermediaries –
thus Visa could be entirely replaced by cryptocurrencies.
Stocks covering the payments eco-system have taken a huge beating and it is rather justifiable given how most stocks have priced
in FY21 recovery on transactions and payment volume. However, Visa has been mispriced by over 20% from its ATH (and
recommended price target). An entry into Visa is recommended as I believe that the market has mispriced Visa over conservative
management projections over FY22 and a slight rotation from financial services to technology and semiconductors (of what used
to be a rotation out of semiconductors roughly 9-12months ago). Should recovery of global tourism and inflation remain as
projected, Visa still stands to gain relatively huge upside in the next 12 months. However, one cannot ignore disruptive forces in
the market such as mobile payments and cryptocurrencies, thus it is recommended to deploy into both Visa and either a mobile
wallet provider (Paypal/Square/etc) or an upcoming crypto project with good user uptake (Solana/Terra/etc).
Disclaimer
The information set forth herein has been obtained or derived from sources generally available to the public and believed by
the author(s) to be reliable, but the author(s) does not make any representation or warranty, express or implied, as to its
accuracy or completeness. The information is not intended to be used as the basis of any investment decision by a person or
entity. This information does not constitute investment advice, nor is it an offer or a solicitation of an offer to buy or sell any
security.
Personal Take
Fig 22: Risk Assessment
Annex A: Board of Directors
Annex B: Executive Committee
Bargaining
power of
suppliers
• Controlled by client incentives (relative), server costs, and push-pull factors on
the labour market
• Server costs will not look to be too pricey as cloud bigwigs (Amazon, Google,
Microsoft) will look to provide cost savings on using cloud computing
• Client incentives will largely depend on Visa's aggressive growth strategies.
Can introduce more enticing incentives at the opportunity cost of lowered net
revenues
• Labour market will remain tight, as seen by constant demand of quality
software engineers]
Bargaining
power of
buyers
• Mainly onboarding of different merchants. They remain sticky to visa due to the
network effect and the large uptake of visa on consumers' credit/debit cards
• Merchants have been protesting on the relatively "exorbitant" take-rates of
Visa's business model but have not moved out of Visa, due to how inherently
the payment network is
Threat of
new
entrants
• New entrants directly servicing a payment network will be close to none, since
it takes decades to build up such a network
Threat of
substitute
products
• Threats include mobile wallets, end to end payment providers, and
decentralised finance
• These threats can fully displace out Visa in the long run if user uptake
continues to grow. This is especially so for the unbanked population since Visa
derives its growth from the usage of card transactions
Competitive
rivalry
• Looking amongst the different payment network providers (Mastercard,
American Express, etc), Visa remains as the market leader with almost 60% of
the market share
• Little to no competition, but market has mostly been stabilised so it will be hard
for Visa to attain more market share than what it already has
• Slight thing to note that Mastercard has been powering B2B transaction and
digital banking earlier than Visa, thus grabbing more market share in these
nascent spaces
Annex C: Porter’s 5 Forces
Balance Sheet
Assets
Cash and cash equivalents 7,838 16,289 16,487 13,843 19,314 29,579 41,001 49,915 61,863
Restricted cash equivalents-U.S. litigation escrow 1,205 901 894 894 894 894 894 894 894
Investment securities 4,236 3,752 2,025 2,025 2,025 2,025 2,025 2,025 2,025
Settlement receivable 3,048 1,264 1,758 2,007 2,246 2,492 2,723 2,945 3,166
Accounts receivable 1,542 1,618 1,968 2,107 2,359 2,617 2,859 3,092 3,325
Customer collateral 1,648 1,850 2,260 2,260 2,260 2,260 2,260 2,260 2,260
Current portion of client incentives 741 1,214 1,359 1,359 1,359 1,359 1,359 1,359 1,359
Prepaid expenses and other current assets 712 757 856 1,304 1,460 1,620 1,770 1,914 2,058
Total current assets 20,970 27,645 27,607 25,800 31,917 42,845 54,890 64,404 76,950
Investment securities 2,157 231 1,705 3,103 4,074 4,860 5,629 6,385 6,730
Client incentives 2,084 3,175 3,245 3,245 3,245 3,245 3,245 3,245 3,245
Property, equipment and technology, net 2,695 2,737 2,715 3,198 3,576 3,796 3,920 3,900 3,735
Goodwill 15,656 15,910 15,958 15,958 15,958 15,958 15,958 15,958 15,958
Intangible assets, net 26,780 27,808 27,664 27,664 27,664 27,664 27,664 27,664 27,664
Other assets 2,232 3,413 4,002 4,002 4,002 4,002 4,002 4,002 4,002
Total assets 72,574 80,919 82,896 82,970 90,436 102,370 115,308 125,558 138,284
Liabilities
Accounts payable 156 174 266 306 342 387 423 449 473
Settlement payable 3,990 1,736 2,443 2,659 2,976 3,364 3,676 3,902 4,116
Customer collateral 1,648 1,850 2,260 2,260 2,260 2,260 2,260 2,260 2,260
Accrued compensation and benefits 796 821 1,211 1,211 1,211 1,211 1,211 1,211 1,211
Client incentives 3,997 4,176 5,243 5,243 5,243 5,243 5,243 5,243 5,243
Accrued liabilities 1,625 1,840 2,334 2,334 2,334 2,334 2,334 2,334 2,334
Current maturities of debt - 2,999 999 3,250 - - 4,000 2,850 -
Accrued litigation 1,203 914 983 74 74 73 70 65 59
Total current liabilities 13,415 14,510 15,739 17,337 14,441 14,872 19,216 18,314 15,696
Long-term debt 16,729 21,071 19,978 16,728 16,728 16,728 12,728 9,878 9,878
Deferred tax liabilities 4,807 5,237 6,128 5,944 6,728 7,508 8,264 9,150 10,050
Other liabilities 2,939 3,891 3,462 3,462 3,462 3,462 3,462 3,462 3,462
Total long term liabilities 24,475 30,199 29,568 26,134 26,918 27,698 24,454 22,490 23,390
Total liabilities 37,890 44,709 45,307 43,470 41,359 42,570 43,670 40,804 39,086
Equity
Preferred stock (Series A to C) 5462 5086 3,080 3,080 3,080 3,080 3,080 3,080 3,080
Class A-C par value stock + additional paid-in capital - right to recover for covered losses 16,370 16,682 18,722 10,771 9,386 8,068 6,814 5,620 4,487
Retained Earnings 13,502 14,088 15,351 25,213 36,174 48,216 61,308 75,618 91,196
Accumulated other comprehensive income (loss), net:
Investment securities 6 3 (1)
Defined benefit pension and other postretirement plans (192) (196) (49)
Derivative instruments 199 (291) (257)
Foreign currency translation adjustments (663) 838 743
Total accumulated other comprehensive income (loss), net (650) 354 436 436 436 436 436 436 436
Total equity 34,684 36,210 37,589 39,500 49,076 59,801 71,638 84,754 99,198
Total liabilities and equity 72,574 80,919 82,896 82,970 90,436 102,370 115,308 125,558 138,284
Annex D: Financials
Income Statement
Revenue
Service revenues 8,918 9,700 9,804 11,475 12,742 13,977 15,172 16,375 17,500 18,547
Data processing revenues 9,027 10,333 10,975 12,792 15,105 17,633 20,326 22,763 25,173 27,623
International transaction revenues 7,211 7,804 6,299 6,530 7,019 7,537 8,041 8,516 8,933 9,369
Other revenues 944 1,313 1,432 1,675 1,759 1,847 1,939 2,036 2,138 2,245
Total Revenue 26,100 29,150 28,510 32,472 36,625 40,994 45,478 49,690 53,744 57,784
11.7% (2.2%) 13.9% 12.8% 11.9% 10.9% 9.3% 8.2% 7.5%
Client incentives 5,491 6,173 6,664 8,367 9,706 10,863 12,279 13,416 14,242 15,024
Net Revenue 20,609 22,977 21,846 24,105 26,919 30,131 33,199 36,274 39,502 42,760
79.0% 78.8% 76.6% 74.2% 73.5% 73.5% 73.0% 73.0% 73.5% 74.0%
Operating Expenses
Personnel 3,170 3,444 3,785 4,240 4,819 5,424 6,042 6,711 7,189 7,697
Marketing 988 1,105 971 1,136 1,263 1,416 1,527 1,632 1,778 1,924
Network and processing 686 721 727 730 863 966 1,064 1,163 1,266 1,371
Professional fees 446 454 408 403 450 504 555 606 660 715
General and administrative 1,145 1,196 1,096 985 1,100 1,231 1,357 1,482 1,614 1,747
Litigation provision 607 400 11 3 269 271 266 254 237 214
Depreciation and amortization 613 656 767 804 982 1,098 1,235 1,367 1,524 1,667
Total Operating Expenses 7,655 7,976 7,765 8,301 9,745 10,910 12,046 13,215 14,269 15,335
Operating income 12,954 15,001 14,081 15,804 17,174 19,221 21,153 23,058 25,233 27,425
EBITDA 13,567 15,657 14,848 16,608 18,156 20,319 22,388 24,425 26,757 29,092
EBITDA Margin (%) 65.8% 68.1% 68.0% 68.9% 67.4% 67.4% 67.4% 67.3% 67.7% 68.0%
Non-Operating Expenses (Income)
Investment income and other (464) (416) (225) 513 244 279 303 325 346 346
Interest expense, net 612 533 516 (772) 486 329 73 (145) (459) (792)
Total Non-operating Expenses (Income) 148 117 291 (259) 486 329 73 (145) (459) (792)
Profit Before Tax (PBT) 12,806 14,884 13,790 16,063 16,688 18,891 21,080 23,203 25,691 28,217
Taxes 2,505 2,804 2,924 3,752 3,254 3,684 4,111 4,525 5,010 5,502
Tax Rate (%) 19.6% 18.8% 21.2% 23.4% 19.5% 19.5% 19.5% 19.5% 19.5% 19.5%
Net Profit 10,301 12,080 10,866 12,311 13,434 15,208 16,970 18,678 20,681 22,715
Net Margin (%) 50.0% 52.6% 49.7% 51.1% 49.9% 50.5% 51.1% 51.5% 52.4% 53.1%
Cash Flow Statement
Cash flow from operations:
Net income 10,301 12,080 10,866 12,311 13,434 15,208 16,970 18,678 20,681 22,715
Adjustments in cash flow operations:
Client incentives 5,491 6,173 6,664 8,367 9,706 10,863 12,279 13,416 14,242 15,024
Share-based compensation 327 407 416 542 549 615 682 745 806 867
D&A in PPE and intangible assets 613 656 767 804 982 1,098 1,235 1,367 1,524 1,667
Deferred income taxes (1,277) 214 307 873 (184) 785 780 756 886 900
VE territory covered losses incurred (11) (172) (37) (147) - - - - - -
Other (64) (271) (145) (821) - - - - - -
Changes in operating working capital:
Settlement receivable (223) (1,533) 1,858 (468) (249) (239) (246) (231) (222) (221)
Accounts receivable (70) (333) (43) (343) (139) (251) (258) (242) (233) (232)
Client incentives (4,682) (6,430) (8,081) (7,510) (9,706) (10,863) (12,279) (13,416) (14,242) (15,024)
Other assets 59 (310) (402) (147) (448) (156) (160) (150) (144) (144)
Accounts payable 3 (24) 21 88 40 36 45 36 26 25
Settlement payable 262 1,931 (2,384) 679 216 317 388 312 226 214
Accrued and other liabilities 1,760 627 923 929 - - - - - -
Accrued litigation 452 (231) (290) 70 (909) 1 (2) (3) (5) (6)
Net change in operating working capital (2,439) (6,303) (8,398) (6,702) (11,195) (11,156) (12,512) (13,695) (14,594) (15,389)
Net cash provided by (used in) operating activities 12,941 12,784 10,440 15,227 13,291 17,413 19,434 21,268 23,546 25,783
Cash flow from investment activities:
Purchases of property, equipment and technology (718) (756) (736) (705) (1,465) (1,476) (1,455) (1,491) (1,505) (1,502)
Purchase of investment securities (5,772) (2,653) (2,075) (5,111) (5,276) (4,430) (6,084) (9,317) (12,710) (14,975)
Proceeds from maturities and sales 3,636 3,996 4,510 5,701 4,122 3,738 5,601 8,874 12,300 14,975
Acquisitions, net of cash and restricted cash acquired (196) (699) (77) (75) - - - - - -
Purchases of / contributions to other investments (50) (501) (267) (71) (244) (279) (303) (325) (346) (346)
Other investing activities 16 22 72 109 - - - - - -
Net cash provided by (used in) investing activities (3,084) (591) 1,427 (152) (2,863) (2,447) (2,241) (2,260) (2,260) (1,848)
Cash flow from financing activities:
Repurchase of class A common stock (7,192) (8,607) (8,114) (8,676) (8,500) (2,000) (2,000) (2,000) (2,000) (2,000)
Proceeds from issuance of senior notes - - 7,212 - - - - - - -
Repayments of debt (1,750) - - (3,000) (999) (3,250) - - (4,000) (2,850)
Dividends paid (1,918) (2,269) (2,664) (2,798) (3,572) (4,246) (4,928) (5,586) (6,371) (7,137)
Payment of deferred purchase consideration related to the Visa Europe acquisition - (1,236) - - - - - - - -
Cash proceeds from issuance of common stock under employee equity plans 164 162 190 208 - - - - - -
Restricted stock and performance-based shares settled in cash for taxes (94) (111) (160) (144) - - - - - -
Payments to settle derivative instruments - - (333) - - - - - - -
Other financing activities - - (99) - - - - - - -
Net cash provided by (used in) financing activities (10,790) (12,061) (3,968) (14,410) (13,071) (9,496) (6,928) (7,586) (12,371) (11,987)
Forex effect on cash (101) (277) 440 (37) - - - - - -
Change in cash and cash equivalents (1,034) (145) 8,339 628 (2,644) 5,470 10,265 11,422 8,914 11,948
In USD (US$ Millions) Actuals Estimates
Period Ending Sep 31 2018A 2019A 2020A 2021A 2022E 2023E 2024E 2025E 2026E 2027E
Working Capital Schedule Excl Client Incentives
Current Assets
Settlement receivables 3,048 1,264 1,758 2,007 2,246 2,492 2,723 2,945 3,166
Days receivable 38.2 16.2 19.8 20.0 20.0 20.0 20.0 20.0 20.0
Accounts receivables 1,542 1,618 1,968 2,107 2,359 2,617 2,859 3,092 3,325
Days receivable 19.3 20.7 22.1 21.0 21.0 21.0 21.0 21.0 21.0
Prepaid expenses 712 757 856 1,304 1,460 1,620 1,770 1,914 2,058
Days receivable 11.3 12.6 13.0 13.0 13.0 13.0 13.0 13.0 13.0
Total Current Assets 5,302 3,639 4,582 5,418 6,065 6,728 7,351 7,951 8,549
Current Liabiliites
Accounts payable 156 174 266 306 342 387 423 449 473
Days payable 9.2 9.5 11.6 11.5 11.5 11.5 11.5 11.5 11.5
Settlement payable 3,990 1,736 2,443 2,659 2,976 3,364 3,676 3,902 4,116
Days payable 235.9 95.1 106.6 100.0 100.0 100.0 100.0 100.0 100.0
Accrued litigation 1,203 914 983 74 74 73 70 65 59
Days payable 1,097.7 30,328.2 119,598.3 100.0 100.0 100.0 100.0 100.0 100.0
Total Current Liabiliites 5,349 2,824 3,692 3,039 3,393 3,824 4,168 4,416 4,648
Total Operating Working Capital (Excl client incentives) (47) 815 890 2,380 2,672 2,905 3,183 3,536 3,901
Change in total operating working capital (47) 862 75 1,490 292 232 279 352 365
In USD (US$ Millions) Actuals Estimates
Period Ending Sep 31 2018A 2019A 2020A 2021A 2022E 2023E 2024E 2025E 2026E 2027E
Depreciation Schedule
CAPEX 756 736 705 1,465 1,476 1,455 1,491 1,505 1,502
CAPEX as % of Revenue 2.6% 2.6% 2.2% 4.0% 3.6% 3.2% 3.0% 2.8% 2.6%
Accumulated Depreciation 3,875 4,424 5,228 6,134 7,180 8,365 9,692 11,162 12,776
PPE
Land 71 71 71 71 71 71 71 71 71
Building and building improvements 965 1,007 1,000 1,073 1,147 1,220 1,295 1,370 1,445
Furniture, equipment and leasehold improvements 1,913 1,997 1,998 2,173 2,350 2,525 2,704 2,885 3,065
Construction in progress 180 163 187 202 216 231 246 261 276
Technology 3,441 3,923 4,019 5,220 6,431 7,624 8,846 10,080 11,312
Total PPE 6,570 7,161 7,275 8,740 10,216 11,671 13,162 14,667 16,169
Acquisition/CAPEX
Land - - - - - - - -
Building and building improvements 42 35 73 74 73 75 75 75
Furniture, equipment and leasehold improvements 84 85 176 177 175 179 181 180
Construction in progress (17) 7 15 15 15 15 15 15
Technology 482 578 1,201 1,210 1,193 1,222 1,234 1,232
Total CAPEX 591 705 1,465 1,476 1,455 1,491 1,505 1,502
% of CAPEX Average CAPEX into respective PPE
Land - -
Building and building improvements 7.1% 5.0%
Furniture, equipment and leasehold improvements 14.2% 12.0%
Construction in progress (2.9%) 1.0%
Technology 81.6% 82.0%
100.0%
Depreciation
Land 71 - - - - -
Building and building improvements 1,147 74 73 75 75 75
Furniture, equipment and leasehold improvements 2,349 177 175 179 181 180
Construction in progress 216 15 15 15 15 15
Technology 6,422 1,210 1,193 1,222 1,234 1,232
Count Useful Lifespan
Land NA - - - - - -
Building and building improvements 40 years 2.5% 2.5% 2.5% 2.5% 2.5% 2.5%
Furniture, equipment and leasehold improvements 10 years 10.0% 10.0% 10.0% 10.0% 10.0% 10.0%
Construction in progress NA - - - - - -
Technology 10 years 10.0% 10.0% 10.0% 10.0% 10.0% 10.0%
Land - - - - - -
Building and building improvements 29 31 32 34 36 38
Furniture, equipment and leasehold improvements 235 253 270 288 306 324
Construction in progress - - - - - -
Technology 642 763 883 1,005 1,128 1,251
Total Depreciation 906 1,046 1,185 1,327 1,470 1,613
Amortisation Schedule
Intangible assets (Gross)
Finite
Customer relationships 701 709
Trade names 199 199
Reseller relationships 95 95
Others 17 17
Indefinite
Customer relationships and reacquired rights 22,217 23,317
Visa trade name 4,084 4,084
Amortisation
Finite
Customer relationships 314 376
Trade names 120 134
Reseller relationships 86 89
Others 13 14
Indefinite
Customer relationships and reacquired rights - -
Visa trade name - -
Total Amortisation 533 613 81 76 52 50 40 54 54
In USD (US$ Millions) Actuals Estimates
Period Ending Sep 31 2018A 2019A 2020A 2021A 2022E 2023E 2024E 2025E 2026E 2027E
Debt Schedule
Cash available to pay down debt
Cash at beginning of year 16,289 16,487 13,843 19,314 29,579 41,001 49,915
Cash flow before debt paydown 628 (2,644) 5,470 10,265 11,422 8,914 11,948
Manimum cash cushion (10,000) (10,000) (10,000) (10,000) (15,000) (15,000) (15,000)
Total cash available to pay down debt 6,917 3,843 9,314 19,579 26,001 34,915 46,863
Long term debt Year Month Interest Rate Principal
Sep 2022 Senior Notes 2022 9 2.15% 1,000 16 - - - - -
Dec 2022 Senior Notes 2022 12 2.80% 2,250 63 - - - - -
Dec 2025 Senior Notes 2025 12 3.15% 4,000 126 126 126 126 - -
Apr 2027 Senior Notes 2027 4 1.90% 1,500 29 29 29 29 29 10
Aug 2027 Senior Notes 2027 8 0.75% 600 5 5 5 5 5 3
Sep 2027 Senior Notes 2027 9 2.75% 750 21 21 21 21 21 15
Apr 2030 Senior Notes 2030 4 2.05% 1,500 31 31 31 31 31 31
Feb 2031 Senior Notes 2031 2 1.10% 1,000 11 11 11 11 11 11
Dec 2035 Senior Notes 2035 12 4.15% 1,500 62 62 62 62 62 62
Apr 2040 Senior Notes 2040 4 2.70% 1,000 27 27 27 27 27 27
Dec 2045 Senior Notes 2045 12 4.30% 3,500 151 151 151 151 151 151
Sep 2047 Senior Notes 2047 9 3.65% 750 27 27 27 27 27 27
Aug 2050 Senior Notes 2050 8 2.00% 1,750 35 35 35 35 35 35
Total payment 21,100 603 524 524 524 398 372
Long term debt
Long term debt (beginning of year) 21,100 20,101 16,851 16,851 16,851 12,851
Mandatory issurances/(retirements) (999) (3,250) - - (4,000) (2,850)
Long term debt (end of year) 20,101 16,851 16,851 16,851 12,851 10,001
Long term interest expense 603 524 524 524 398 372
Blended long term interest rate 2.6% 2.6% 2.6% 2.6% 2.6% 2.6%
Other liabilities (Long term lease liabilities)
Long term lease liabiliities (beginning of year) 3,462 3,462 3,462 3,462 3,462 3,462
Mandatory issurances/(retirements) - - - - - -
Long term lease liabilities (end of year) 3,462 3,462 3,462 3,462 3,462 3,462
Long term lease liabilities interest expense 103 95 82 70 16 16
Long term lease liabilities interest rate 3.0% 2.7% 2.4% 2.0% 0.5% 0.5%
Total issuances/ (retirements) (999) (3,250) - - (4,000) (2,850)
Total interest expense 706 619 606 594 414 388
Cash at end of year 12,844 16,064 29,579 41,001 45,915 59,013
Interest income 220 289 532 738 872 1,180
Interest rate 1.7% 1.8% 1.8% 1.8% 1.9% 2.0%
In USD (US$ Millions) Estimates
Period Ending Sep 31 2022E 2022E 2022E 2022E 2022E 2022E
Cost of Capital
Risk Free Rate 1.5% Debt 29,568 Tax rate 19.5%
Market Risk Premium 7.3% Stock Price 213.0
Beta 0.92 Shares Outstanding 1,880,000,000
Cost of Equity 8.2% Equity Value 400,440
Cost of Debt 2.6% Net Debt 12,187 << Debt - cash and cash equivalents
WACC 7.803% Enterprise Value 412,627
Unlevered Free Cash Flow
EBIT 17,174 19,221 21,153 23,058 25,233 27,425
Less: Taxes 3,254 3,684 4,111 4,525 5,010 5,502
NOPAT 13,920 15,537 17,043 18,534 20,223 21,923
Add: D&A 982 1,098 1,235 1,367 1,524 1,667
Less: Changes in Net Working Capital (4,493) 40 (1,356) (1,184) (899) (795)
Less: Capital Expenditures 1,465 1,476 1,455 1,491 1,505 1,502
Unlevered FCF 17,930 15,120 18,178 19,594 21,141 22,882
Net Present Value Calculation
Period 1 2 3 4 5 6
Discounted Cash Flow 16,632 13,010 14,510 14,508 14,520 14,579
Sum of Cash Flows 87,759
EBITDA Method
Exit Year EBITDA 29,092
Multiple 22.6x
Terminal Value 657,485
Net Present Value 418,896
Perpetuity Method
Unlevered Free Cash Flow 22,882
Growth Rate 3.5%
Terminal Value 550,418
Net Present Value 350,681
Discounted Cash Flow Total Valuation EBITDA Perpetuity
Total of present value of cash flows 87,759 87,759
Present value of terminal value 418,896 350,681
Total Enterprise Value 506,655 438,440
Net Debt, Non-controlling interests,preferred securities 29,568 29,568
Equity Value 477,087 408,872
Share Count (Millions) 1,880 1,880
Share Price 253.77
$ 217.49
$
Implied Upside 19.1% 2.1%
EV/EBITDA
253.8 19.0x 20.0x 21.0x 22.6x 24.0x 25.0x 26.0x
7.0% 228.1 238.4 248.7 265.2 279.7 290.0 300.3
7.2% 225.6 235.8 246.0 262.3 276.6 286.8 297.0
7.5% 221.9 231.9 242.0 258.0 272.1 282.1 292.1
WACC 7.8% 218.3 228.1 238.0 253.8 267.6 277.4 287.3
8.0% 215.9 225.7 235.4 251.0 264.7 274.4 284.2
8.2% 213.6 223.2 232.9 248.3 261.8 271.5 281.1
8.5% 210.1 219.6 229.1 244.3 257.6 267.1 276.5
Growth Rate
217.5 3.2% 3.3% 3.4% 3.5% 3.6% 3.7% 3.8%
7.0% 252.4 258.6 265.1 272.0 279.3 287.0 295.3
7.2% 238.8 244.3 250.1 256.2 262.7 269.5 276.7
7.5% 220.7 225.4 230.3 235.5 240.9 246.6 252.7
WACC 7.8% 204.8 208.8 213.0 217.4 222.0 226.9 232.0
8.0% 195.6 199.2 203.1 207.1 211.3 215.6 220.2
8.2% 186.9 190.3 193.8 197.4 201.2 205.2 209.3
8.5% 175.2 178.1 181.2 184.4 187.7 191.1 194.7

More Related Content

What's hot

Safeguard Scientifics (NYSE: SFE) Investor Relations Presentation - November ...
Safeguard Scientifics (NYSE: SFE) Investor Relations Presentation - November ...Safeguard Scientifics (NYSE: SFE) Investor Relations Presentation - November ...
Safeguard Scientifics (NYSE: SFE) Investor Relations Presentation - November ...Safeguard Scientifics
 
Demand media ir deck 09.21.16
Demand media ir deck 09.21.16Demand media ir deck 09.21.16
Demand media ir deck 09.21.16Leaf Group
 
Symantec investor presentation february 2017
Symantec investor presentation february 2017Symantec investor presentation february 2017
Symantec investor presentation february 2017InvestorSymantec
 
Trup investor presentation march 2017
Trup investor presentation   march 2017Trup investor presentation   march 2017
Trup investor presentation march 2017trupanion
 
Investor Presentation June 2016
Investor Presentation June 2016Investor Presentation June 2016
Investor Presentation June 2016Intact
 
Symantec investor presentation february 2017
Symantec investor presentation february 2017Symantec investor presentation february 2017
Symantec investor presentation february 2017InvestorSymantec
 
I-Byte Hospitality march 2021
I-Byte Hospitality march 2021I-Byte Hospitality march 2021
I-Byte Hospitality march 2021EGBG Services
 
Blx webcast presentation 4 q19
Blx webcast presentation 4 q19Blx webcast presentation 4 q19
Blx webcast presentation 4 q19Bladex
 
Capital-Infraestructure-spending-outlook-2016
Capital-Infraestructure-spending-outlook-2016Capital-Infraestructure-spending-outlook-2016
Capital-Infraestructure-spending-outlook-2016PwC España
 
Mercer Capital's Value Focus: Transportation & Logistics | Q1 2019 | Feature...
Mercer Capital's Value Focus: Transportation & Logistics  | Q1 2019 | Feature...Mercer Capital's Value Focus: Transportation & Logistics  | Q1 2019 | Feature...
Mercer Capital's Value Focus: Transportation & Logistics | Q1 2019 | Feature...Mercer Capital
 
Mercer Capital's Value Focus: Transportation & Logistics | Fourth Quarter 201...
Mercer Capital's Value Focus: Transportation & Logistics | Fourth Quarter 201...Mercer Capital's Value Focus: Transportation & Logistics | Fourth Quarter 201...
Mercer Capital's Value Focus: Transportation & Logistics | Fourth Quarter 201...Mercer Capital
 
Vietnam Consumer Finance Market Report 2019
Vietnam Consumer Finance Market Report 2019 Vietnam Consumer Finance Market Report 2019
Vietnam Consumer Finance Market Report 2019 FiinGroup JSC
 
citigroup October 17, 2000 - Third Quarter Press Release
citigroup October 17, 2000 - Third Quarter Press Releasecitigroup October 17, 2000 - Third Quarter Press Release
citigroup October 17, 2000 - Third Quarter Press ReleaseQuarterlyEarningsReports
 
Vietnam Consumer Finance - Customer Survey Report 2019
Vietnam Consumer Finance - Customer Survey Report 2019 Vietnam Consumer Finance - Customer Survey Report 2019
Vietnam Consumer Finance - Customer Survey Report 2019 FiinGroup JSC
 
Investor presentation-march-2016
Investor presentation-march-2016Investor presentation-march-2016
Investor presentation-march-2016Intact
 
Investor Presentation September 2013
Investor Presentation September 2013Investor Presentation September 2013
Investor Presentation September 2013Intact
 
PwC Auto M&A Insights 2015
PwC Auto M&A Insights 2015PwC Auto M&A Insights 2015
PwC Auto M&A Insights 2015PwC
 

What's hot (20)

Safeguard Scientifics (NYSE: SFE) Investor Relations Presentation - November ...
Safeguard Scientifics (NYSE: SFE) Investor Relations Presentation - November ...Safeguard Scientifics (NYSE: SFE) Investor Relations Presentation - November ...
Safeguard Scientifics (NYSE: SFE) Investor Relations Presentation - November ...
 
Demand media ir deck 09.21.16
Demand media ir deck 09.21.16Demand media ir deck 09.21.16
Demand media ir deck 09.21.16
 
Symantec investor presentation february 2017
Symantec investor presentation february 2017Symantec investor presentation february 2017
Symantec investor presentation february 2017
 
Trup investor presentation march 2017
Trup investor presentation   march 2017Trup investor presentation   march 2017
Trup investor presentation march 2017
 
Investor Presentation June 2016
Investor Presentation June 2016Investor Presentation June 2016
Investor Presentation June 2016
 
Symantec investor presentation february 2017
Symantec investor presentation february 2017Symantec investor presentation february 2017
Symantec investor presentation february 2017
 
I-Byte Hospitality march 2021
I-Byte Hospitality march 2021I-Byte Hospitality march 2021
I-Byte Hospitality march 2021
 
Blx webcast presentation 4 q19
Blx webcast presentation 4 q19Blx webcast presentation 4 q19
Blx webcast presentation 4 q19
 
Capital-Infraestructure-spending-outlook-2016
Capital-Infraestructure-spending-outlook-2016Capital-Infraestructure-spending-outlook-2016
Capital-Infraestructure-spending-outlook-2016
 
Rieger report june 22 2018 munis corporates
Rieger report june 22 2018 munis corporatesRieger report june 22 2018 munis corporates
Rieger report june 22 2018 munis corporates
 
Mercer Capital's Value Focus: Transportation & Logistics | Q1 2019 | Feature...
Mercer Capital's Value Focus: Transportation & Logistics  | Q1 2019 | Feature...Mercer Capital's Value Focus: Transportation & Logistics  | Q1 2019 | Feature...
Mercer Capital's Value Focus: Transportation & Logistics | Q1 2019 | Feature...
 
Mercer Capital's Value Focus: Transportation & Logistics | Fourth Quarter 201...
Mercer Capital's Value Focus: Transportation & Logistics | Fourth Quarter 201...Mercer Capital's Value Focus: Transportation & Logistics | Fourth Quarter 201...
Mercer Capital's Value Focus: Transportation & Logistics | Fourth Quarter 201...
 
Investor Day 2013: Investing to Grow & Financials
Investor Day 2013: Investing to Grow & FinancialsInvestor Day 2013: Investing to Grow & Financials
Investor Day 2013: Investing to Grow & Financials
 
Vietnam Consumer Finance Market Report 2019
Vietnam Consumer Finance Market Report 2019 Vietnam Consumer Finance Market Report 2019
Vietnam Consumer Finance Market Report 2019
 
citigroup October 17, 2000 - Third Quarter Press Release
citigroup October 17, 2000 - Third Quarter Press Releasecitigroup October 17, 2000 - Third Quarter Press Release
citigroup October 17, 2000 - Third Quarter Press Release
 
Vietnam Consumer Finance - Customer Survey Report 2019
Vietnam Consumer Finance - Customer Survey Report 2019 Vietnam Consumer Finance - Customer Survey Report 2019
Vietnam Consumer Finance - Customer Survey Report 2019
 
Investor presentation-march-2016
Investor presentation-march-2016Investor presentation-march-2016
Investor presentation-march-2016
 
Investor Presentation September 2013
Investor Presentation September 2013Investor Presentation September 2013
Investor Presentation September 2013
 
PwC Auto M&A Insights 2015
PwC Auto M&A Insights 2015PwC Auto M&A Insights 2015
PwC Auto M&A Insights 2015
 
Itg investor presentation_05aug14
Itg investor presentation_05aug14Itg investor presentation_05aug14
Itg investor presentation_05aug14
 

Similar to Visa Buy Rec at $253 Target

Visa Stock Analysis Report
Visa Stock Analysis ReportVisa Stock Analysis Report
Visa Stock Analysis ReportTrè Cotton
 
Industry Final
Industry FinalIndustry Final
Industry FinalSam Atari
 
Visa report 02.04.16
Visa report 02.04.16Visa report 02.04.16
Visa report 02.04.16Andrea Casati
 
Brief for Transaction Processing Industry
Brief for Transaction Processing IndustryBrief for Transaction Processing Industry
Brief for Transaction Processing IndustryBerkeley Teate
 
Sample Report: 2021 Key Trends of the Payment Industry: Real-Time Payments in...
Sample Report: 2021 Key Trends of the Payment Industry: Real-Time Payments in...Sample Report: 2021 Key Trends of the Payment Industry: Real-Time Payments in...
Sample Report: 2021 Key Trends of the Payment Industry: Real-Time Payments in...yStats.com
 
Payments 101 - US Payments - A Primer
Payments 101 - US Payments - A PrimerPayments 101 - US Payments - A Primer
Payments 101 - US Payments - A PrimerKapish Kaushal
 
Understanding the future of payments industry in India.pptx
Understanding the future of payments industry in India.pptxUnderstanding the future of payments industry in India.pptx
Understanding the future of payments industry in India.pptxrohitkeluskar4
 
Mercer Capital's Value Focus: FinTech Industry | Fourth Quarter 2022
Mercer Capital's Value Focus: FinTech Industry | Fourth Quarter 2022 Mercer Capital's Value Focus: FinTech Industry | Fourth Quarter 2022
Mercer Capital's Value Focus: FinTech Industry | Fourth Quarter 2022 Mercer Capital
 
[Sample Report] - Consumer Finance in Vietnam First-Half 2021 Review
[Sample Report] - Consumer Finance in Vietnam First-Half 2021 Review[Sample Report] - Consumer Finance in Vietnam First-Half 2021 Review
[Sample Report] - Consumer Finance in Vietnam First-Half 2021 ReviewFiinGroup JSC
 
2C2P-IDC-InfoBrief_AP241383IB.pdf
2C2P-IDC-InfoBrief_AP241383IB.pdf2C2P-IDC-InfoBrief_AP241383IB.pdf
2C2P-IDC-InfoBrief_AP241383IB.pdfRizkyAdiPoetra
 
Global payments community 2017
Global payments community 2017Global payments community 2017
Global payments community 2017btlcoin token
 
Software Ecom and Fintech 2020 report.pdf
Software Ecom and Fintech 2020 report.pdfSoftware Ecom and Fintech 2020 report.pdf
Software Ecom and Fintech 2020 report.pdfDhatrpriyaLakhanee
 
Commercial Bank PowerPoint Presentations Slides
Commercial Bank PowerPoint Presentations Slides Commercial Bank PowerPoint Presentations Slides
Commercial Bank PowerPoint Presentations Slides SlideTeam
 
Visa master card contactless payment in china_v1
Visa master card contactless payment in china_v1Visa master card contactless payment in china_v1
Visa master card contactless payment in china_v1Kelvin Tai
 
Commercial Bank Powerpoint Presentation Slides
Commercial Bank Powerpoint Presentation SlidesCommercial Bank Powerpoint Presentation Slides
Commercial Bank Powerpoint Presentation SlidesSlideTeam
 

Similar to Visa Buy Rec at $253 Target (20)

v_s16 (1)
v_s16 (1)v_s16 (1)
v_s16 (1)
 
VISA Report - Revised
VISA Report - RevisedVISA Report - Revised
VISA Report - Revised
 
Visa Stock Analysis Report
Visa Stock Analysis ReportVisa Stock Analysis Report
Visa Stock Analysis Report
 
Industry Final
Industry FinalIndustry Final
Industry Final
 
Visa report 02.04.16
Visa report 02.04.16Visa report 02.04.16
Visa report 02.04.16
 
Visa (V) Bench
Visa (V) BenchVisa (V) Bench
Visa (V) Bench
 
Brief for Transaction Processing Industry
Brief for Transaction Processing IndustryBrief for Transaction Processing Industry
Brief for Transaction Processing Industry
 
Sample Report: 2021 Key Trends of the Payment Industry: Real-Time Payments in...
Sample Report: 2021 Key Trends of the Payment Industry: Real-Time Payments in...Sample Report: 2021 Key Trends of the Payment Industry: Real-Time Payments in...
Sample Report: 2021 Key Trends of the Payment Industry: Real-Time Payments in...
 
Credit Card Business Plan
Credit Card Business PlanCredit Card Business Plan
Credit Card Business Plan
 
Global Payments Research Report
Global Payments Research Report Global Payments Research Report
Global Payments Research Report
 
Payments 101 - US Payments - A Primer
Payments 101 - US Payments - A PrimerPayments 101 - US Payments - A Primer
Payments 101 - US Payments - A Primer
 
Understanding the future of payments industry in India.pptx
Understanding the future of payments industry in India.pptxUnderstanding the future of payments industry in India.pptx
Understanding the future of payments industry in India.pptx
 
Mercer Capital's Value Focus: FinTech Industry | Fourth Quarter 2022
Mercer Capital's Value Focus: FinTech Industry | Fourth Quarter 2022 Mercer Capital's Value Focus: FinTech Industry | Fourth Quarter 2022
Mercer Capital's Value Focus: FinTech Industry | Fourth Quarter 2022
 
[Sample Report] - Consumer Finance in Vietnam First-Half 2021 Review
[Sample Report] - Consumer Finance in Vietnam First-Half 2021 Review[Sample Report] - Consumer Finance in Vietnam First-Half 2021 Review
[Sample Report] - Consumer Finance in Vietnam First-Half 2021 Review
 
2C2P-IDC-InfoBrief_AP241383IB.pdf
2C2P-IDC-InfoBrief_AP241383IB.pdf2C2P-IDC-InfoBrief_AP241383IB.pdf
2C2P-IDC-InfoBrief_AP241383IB.pdf
 
Global payments community 2017
Global payments community 2017Global payments community 2017
Global payments community 2017
 
Software Ecom and Fintech 2020 report.pdf
Software Ecom and Fintech 2020 report.pdfSoftware Ecom and Fintech 2020 report.pdf
Software Ecom and Fintech 2020 report.pdf
 
Commercial Bank PowerPoint Presentations Slides
Commercial Bank PowerPoint Presentations Slides Commercial Bank PowerPoint Presentations Slides
Commercial Bank PowerPoint Presentations Slides
 
Visa master card contactless payment in china_v1
Visa master card contactless payment in china_v1Visa master card contactless payment in china_v1
Visa master card contactless payment in china_v1
 
Commercial Bank Powerpoint Presentation Slides
Commercial Bank Powerpoint Presentation SlidesCommercial Bank Powerpoint Presentation Slides
Commercial Bank Powerpoint Presentation Slides
 

Recently uploaded

CALL ON ➥8923113531 🔝Call Girls Gomti Nagar Lucknow best sexual service
CALL ON ➥8923113531 🔝Call Girls Gomti Nagar Lucknow best sexual serviceCALL ON ➥8923113531 🔝Call Girls Gomti Nagar Lucknow best sexual service
CALL ON ➥8923113531 🔝Call Girls Gomti Nagar Lucknow best sexual serviceanilsa9823
 
Basic concepts related to Financial modelling
Basic concepts related to Financial modellingBasic concepts related to Financial modelling
Basic concepts related to Financial modellingbaijup5
 
Top Rated Pune Call Girls Viman Nagar ⟟ 6297143586 ⟟ Call Me For Genuine Sex...
Top Rated  Pune Call Girls Viman Nagar ⟟ 6297143586 ⟟ Call Me For Genuine Sex...Top Rated  Pune Call Girls Viman Nagar ⟟ 6297143586 ⟟ Call Me For Genuine Sex...
Top Rated Pune Call Girls Viman Nagar ⟟ 6297143586 ⟟ Call Me For Genuine Sex...Call Girls in Nagpur High Profile
 
The Economic History of the U.S. Lecture 30.pdf
The Economic History of the U.S. Lecture 30.pdfThe Economic History of the U.S. Lecture 30.pdf
The Economic History of the U.S. Lecture 30.pdfGale Pooley
 
The Economic History of the U.S. Lecture 19.pdf
The Economic History of the U.S. Lecture 19.pdfThe Economic History of the U.S. Lecture 19.pdf
The Economic History of the U.S. Lecture 19.pdfGale Pooley
 
High Class Call Girls Nagpur Grishma Call 7001035870 Meet With Nagpur Escorts
High Class Call Girls Nagpur Grishma Call 7001035870 Meet With Nagpur EscortsHigh Class Call Girls Nagpur Grishma Call 7001035870 Meet With Nagpur Escorts
High Class Call Girls Nagpur Grishma Call 7001035870 Meet With Nagpur Escortsranjana rawat
 
05_Annelore Lenoir_Docbyte_MeetupDora&Cybersecurity.pptx
05_Annelore Lenoir_Docbyte_MeetupDora&Cybersecurity.pptx05_Annelore Lenoir_Docbyte_MeetupDora&Cybersecurity.pptx
05_Annelore Lenoir_Docbyte_MeetupDora&Cybersecurity.pptxFinTech Belgium
 
WhatsApp 📞 Call : 9892124323 ✅Call Girls In Chembur ( Mumbai ) secure service
WhatsApp 📞 Call : 9892124323  ✅Call Girls In Chembur ( Mumbai ) secure serviceWhatsApp 📞 Call : 9892124323  ✅Call Girls In Chembur ( Mumbai ) secure service
WhatsApp 📞 Call : 9892124323 ✅Call Girls In Chembur ( Mumbai ) secure servicePooja Nehwal
 
Dharavi Russian callg Girls, { 09892124323 } || Call Girl In Mumbai ...
Dharavi Russian callg Girls, { 09892124323 } || Call Girl In Mumbai ...Dharavi Russian callg Girls, { 09892124323 } || Call Girl In Mumbai ...
Dharavi Russian callg Girls, { 09892124323 } || Call Girl In Mumbai ...Pooja Nehwal
 
Solution Manual for Principles of Corporate Finance 14th Edition by Richard B...
Solution Manual for Principles of Corporate Finance 14th Edition by Richard B...Solution Manual for Principles of Corporate Finance 14th Edition by Richard B...
Solution Manual for Principles of Corporate Finance 14th Edition by Richard B...ssifa0344
 
Call US 📞 9892124323 ✅ Kurla Call Girls In Kurla ( Mumbai ) secure service
Call US 📞 9892124323 ✅ Kurla Call Girls In Kurla ( Mumbai ) secure serviceCall US 📞 9892124323 ✅ Kurla Call Girls In Kurla ( Mumbai ) secure service
Call US 📞 9892124323 ✅ Kurla Call Girls In Kurla ( Mumbai ) secure servicePooja Nehwal
 
(ANIKA) Budhwar Peth Call Girls Just Call 7001035870 [ Cash on Delivery ] Pun...
(ANIKA) Budhwar Peth Call Girls Just Call 7001035870 [ Cash on Delivery ] Pun...(ANIKA) Budhwar Peth Call Girls Just Call 7001035870 [ Cash on Delivery ] Pun...
(ANIKA) Budhwar Peth Call Girls Just Call 7001035870 [ Cash on Delivery ] Pun...ranjana rawat
 
Booking open Available Pune Call Girls Wadgaon Sheri 6297143586 Call Hot Ind...
Booking open Available Pune Call Girls Wadgaon Sheri  6297143586 Call Hot Ind...Booking open Available Pune Call Girls Wadgaon Sheri  6297143586 Call Hot Ind...
Booking open Available Pune Call Girls Wadgaon Sheri 6297143586 Call Hot Ind...Call Girls in Nagpur High Profile
 
TEST BANK For Corporate Finance, 13th Edition By Stephen Ross, Randolph Weste...
TEST BANK For Corporate Finance, 13th Edition By Stephen Ross, Randolph Weste...TEST BANK For Corporate Finance, 13th Edition By Stephen Ross, Randolph Weste...
TEST BANK For Corporate Finance, 13th Edition By Stephen Ross, Randolph Weste...ssifa0344
 
The Economic History of the U.S. Lecture 17.pdf
The Economic History of the U.S. Lecture 17.pdfThe Economic History of the U.S. Lecture 17.pdf
The Economic History of the U.S. Lecture 17.pdfGale Pooley
 
20240429 Calibre April 2024 Investor Presentation.pdf
20240429 Calibre April 2024 Investor Presentation.pdf20240429 Calibre April 2024 Investor Presentation.pdf
20240429 Calibre April 2024 Investor Presentation.pdfAdnet Communications
 
The Economic History of the U.S. Lecture 25.pdf
The Economic History of the U.S. Lecture 25.pdfThe Economic History of the U.S. Lecture 25.pdf
The Economic History of the U.S. Lecture 25.pdfGale Pooley
 
Booking open Available Pune Call Girls Shivane 6297143586 Call Hot Indian Gi...
Booking open Available Pune Call Girls Shivane  6297143586 Call Hot Indian Gi...Booking open Available Pune Call Girls Shivane  6297143586 Call Hot Indian Gi...
Booking open Available Pune Call Girls Shivane 6297143586 Call Hot Indian Gi...Call Girls in Nagpur High Profile
 
The Economic History of the U.S. Lecture 22.pdf
The Economic History of the U.S. Lecture 22.pdfThe Economic History of the U.S. Lecture 22.pdf
The Economic History of the U.S. Lecture 22.pdfGale Pooley
 

Recently uploaded (20)

CALL ON ➥8923113531 🔝Call Girls Gomti Nagar Lucknow best sexual service
CALL ON ➥8923113531 🔝Call Girls Gomti Nagar Lucknow best sexual serviceCALL ON ➥8923113531 🔝Call Girls Gomti Nagar Lucknow best sexual service
CALL ON ➥8923113531 🔝Call Girls Gomti Nagar Lucknow best sexual service
 
Basic concepts related to Financial modelling
Basic concepts related to Financial modellingBasic concepts related to Financial modelling
Basic concepts related to Financial modelling
 
Top Rated Pune Call Girls Viman Nagar ⟟ 6297143586 ⟟ Call Me For Genuine Sex...
Top Rated  Pune Call Girls Viman Nagar ⟟ 6297143586 ⟟ Call Me For Genuine Sex...Top Rated  Pune Call Girls Viman Nagar ⟟ 6297143586 ⟟ Call Me For Genuine Sex...
Top Rated Pune Call Girls Viman Nagar ⟟ 6297143586 ⟟ Call Me For Genuine Sex...
 
The Economic History of the U.S. Lecture 30.pdf
The Economic History of the U.S. Lecture 30.pdfThe Economic History of the U.S. Lecture 30.pdf
The Economic History of the U.S. Lecture 30.pdf
 
The Economic History of the U.S. Lecture 19.pdf
The Economic History of the U.S. Lecture 19.pdfThe Economic History of the U.S. Lecture 19.pdf
The Economic History of the U.S. Lecture 19.pdf
 
High Class Call Girls Nagpur Grishma Call 7001035870 Meet With Nagpur Escorts
High Class Call Girls Nagpur Grishma Call 7001035870 Meet With Nagpur EscortsHigh Class Call Girls Nagpur Grishma Call 7001035870 Meet With Nagpur Escorts
High Class Call Girls Nagpur Grishma Call 7001035870 Meet With Nagpur Escorts
 
05_Annelore Lenoir_Docbyte_MeetupDora&Cybersecurity.pptx
05_Annelore Lenoir_Docbyte_MeetupDora&Cybersecurity.pptx05_Annelore Lenoir_Docbyte_MeetupDora&Cybersecurity.pptx
05_Annelore Lenoir_Docbyte_MeetupDora&Cybersecurity.pptx
 
(INDIRA) Call Girl Mumbai Call Now 8250077686 Mumbai Escorts 24x7
(INDIRA) Call Girl Mumbai Call Now 8250077686 Mumbai Escorts 24x7(INDIRA) Call Girl Mumbai Call Now 8250077686 Mumbai Escorts 24x7
(INDIRA) Call Girl Mumbai Call Now 8250077686 Mumbai Escorts 24x7
 
WhatsApp 📞 Call : 9892124323 ✅Call Girls In Chembur ( Mumbai ) secure service
WhatsApp 📞 Call : 9892124323  ✅Call Girls In Chembur ( Mumbai ) secure serviceWhatsApp 📞 Call : 9892124323  ✅Call Girls In Chembur ( Mumbai ) secure service
WhatsApp 📞 Call : 9892124323 ✅Call Girls In Chembur ( Mumbai ) secure service
 
Dharavi Russian callg Girls, { 09892124323 } || Call Girl In Mumbai ...
Dharavi Russian callg Girls, { 09892124323 } || Call Girl In Mumbai ...Dharavi Russian callg Girls, { 09892124323 } || Call Girl In Mumbai ...
Dharavi Russian callg Girls, { 09892124323 } || Call Girl In Mumbai ...
 
Solution Manual for Principles of Corporate Finance 14th Edition by Richard B...
Solution Manual for Principles of Corporate Finance 14th Edition by Richard B...Solution Manual for Principles of Corporate Finance 14th Edition by Richard B...
Solution Manual for Principles of Corporate Finance 14th Edition by Richard B...
 
Call US 📞 9892124323 ✅ Kurla Call Girls In Kurla ( Mumbai ) secure service
Call US 📞 9892124323 ✅ Kurla Call Girls In Kurla ( Mumbai ) secure serviceCall US 📞 9892124323 ✅ Kurla Call Girls In Kurla ( Mumbai ) secure service
Call US 📞 9892124323 ✅ Kurla Call Girls In Kurla ( Mumbai ) secure service
 
(ANIKA) Budhwar Peth Call Girls Just Call 7001035870 [ Cash on Delivery ] Pun...
(ANIKA) Budhwar Peth Call Girls Just Call 7001035870 [ Cash on Delivery ] Pun...(ANIKA) Budhwar Peth Call Girls Just Call 7001035870 [ Cash on Delivery ] Pun...
(ANIKA) Budhwar Peth Call Girls Just Call 7001035870 [ Cash on Delivery ] Pun...
 
Booking open Available Pune Call Girls Wadgaon Sheri 6297143586 Call Hot Ind...
Booking open Available Pune Call Girls Wadgaon Sheri  6297143586 Call Hot Ind...Booking open Available Pune Call Girls Wadgaon Sheri  6297143586 Call Hot Ind...
Booking open Available Pune Call Girls Wadgaon Sheri 6297143586 Call Hot Ind...
 
TEST BANK For Corporate Finance, 13th Edition By Stephen Ross, Randolph Weste...
TEST BANK For Corporate Finance, 13th Edition By Stephen Ross, Randolph Weste...TEST BANK For Corporate Finance, 13th Edition By Stephen Ross, Randolph Weste...
TEST BANK For Corporate Finance, 13th Edition By Stephen Ross, Randolph Weste...
 
The Economic History of the U.S. Lecture 17.pdf
The Economic History of the U.S. Lecture 17.pdfThe Economic History of the U.S. Lecture 17.pdf
The Economic History of the U.S. Lecture 17.pdf
 
20240429 Calibre April 2024 Investor Presentation.pdf
20240429 Calibre April 2024 Investor Presentation.pdf20240429 Calibre April 2024 Investor Presentation.pdf
20240429 Calibre April 2024 Investor Presentation.pdf
 
The Economic History of the U.S. Lecture 25.pdf
The Economic History of the U.S. Lecture 25.pdfThe Economic History of the U.S. Lecture 25.pdf
The Economic History of the U.S. Lecture 25.pdf
 
Booking open Available Pune Call Girls Shivane 6297143586 Call Hot Indian Gi...
Booking open Available Pune Call Girls Shivane  6297143586 Call Hot Indian Gi...Booking open Available Pune Call Girls Shivane  6297143586 Call Hot Indian Gi...
Booking open Available Pune Call Girls Shivane 6297143586 Call Hot Indian Gi...
 
The Economic History of the U.S. Lecture 22.pdf
The Economic History of the U.S. Lecture 22.pdfThe Economic History of the U.S. Lecture 22.pdf
The Economic History of the U.S. Lecture 22.pdf
 

Visa Buy Rec at $253 Target

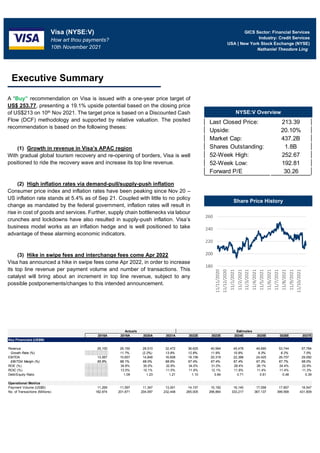
  • 1. A “Buy” recommendation on Visa is issued with a one-year price target of US$ 253.77, presenting a 19.1% upside potential based on the closing price of US$213 on 10th Nov 2021. The target price is based on a Discounted Cash Flow (DCF) methodology and supported by relative valuation. The posited recommendation is based on the following theses: (1) Growth in revenue in Visa’s APAC region With gradual global tourism recovery and re-opening of borders, Visa is well positioned to ride the recovery wave and increase its top line revenue. (2) High inflation rates via demand-pull/supply-push inflation Consumer price index and inflation rates have been peaking since Nov 20 – US inflation rate stands at 5.4% as of Sep 21. Coupled with little to no policy change as mandated by the federal government, inflation rates will result in rise in cost of goods and services. Further, supply chain bottlenecks via labour crunches and lockdowns have also resulted in supply-push inflation. Visa’s business model works as an inflation hedge and is well positioned to take advantage of these alarming economic indicators. (3) Hike in swipe fees and interchange fees come Apr 2022 Visa has announced a hike in swipe fees come Apr 2022, in order to increase its top line revenue per payment volume and number of transactions. This catalyst will bring about an increment in top line revenue, subject to any possible postponements/changes to this intended announcement. GICS Sector: Financial Services Industry: Credit Services USA | New York Stock Exchange (NYSE) Nathaniel Theodore Ling Visa (NYSE:V) How art thou payments? 10th November 2021 Executive Summary Share Price History 180 200 220 240 260 11/11/2020 11/12/2020 11/1/2021 11/2/2021 11/3/2021 11/4/2021 11/5/2021 11/6/2021 11/7/2021 11/8/2021 11/9/2021 11/10/2021 NYSE:V Overview Last Closed Price: 213.39 Upside: 20.10% Market Cap: 437.2B Shares Outstanding: 1.8B 52-Week High: 252.67 52-Week Low: 192.81 Forward P/E 30.26 Actuals Estimates 2018A 2019A 2020A 2021A 2022E 2023E 2024E 2025E 2026E 2027E Key Financials (US$M) Revenue 26,100 29,150 28,510 32,472 36,625 40,994 45,478 49,690 53,744 57,784 Growth Rate (%) 11.7% (2.2%) 13.9% 12.8% 11.9% 10.9% 9.3% 8.2% 7.5% EBITDA 13,567 15,657 14,848 16,608 18,156 20,319 22,388 24,425 26,757 29,092 EBITDA Margin (%) 65.8% 68.1% 68.0% 68.9% 67.4% 67.4% 67.4% 67.3% 67.7% 68.0% ROE (%) 34.8% 30.0% 32.8% 34.0% 31.0% 28.4% 26.1% 24.4% 22.9% ROIC (%) 13.5% 10.1% 11.5% 11.9% 12.1% 11.8% 11.4% 11.4% 11.3% Debt/Equity Ratio 1.09 1.23 1.21 1.10 0.84 0.71 0.61 0.48 0.39 Operational Metrics Payment Volume (US$B) 11,269 11,597 11,347 13,001 14,157 15,192 16,140 17,058 17,857 18,547 No. of Transactions (Millions) 182,974 201,871 204,097 232,448 265,005 298,864 333,217 367,137 399,569 431,609
  • 2. Founded in 1958, Visa (NYSE:V) is a global market leader in digital payments, acting as a payment network processor intermediary that facilitates global transactions amongst different stakeholders (consumers, financial institutions, businesses and merchants, etc). Visa concluded FY21 with US$13T in total payment volume and 232B processed transactions globally, thus achieving a record breaking US$24.1B in net revenue. Visa operates a “four-party” model (Fig 1) – facilitating secure, reliable and convenient transactions among financial institutions, merchants, and consumers. Following the rise of fintech disruption via open and digital banking, mobile wallets (open/closed loop systems), and cryptocurrencies (decentralised finance), Visa has continued to branch beyond the traditional model, partaking in these new market segments as mentioned above. Some prominent innovations/enhancements include: (1) Advancements of VisaNet VisaNet, Visa’s bread and butter service in facilitating payment transactions, recently unveiled VisaNet AI+, a suite of AI-powered services including the likes of (a) Smarter Posting: Provision of real time visibility into consumers’ finances/transaction history (b) Smarter Settlement: Enablement of treasury teams across corporates/financial institutions in predicting daily cash volumes and making strategic decisions across a customised 7-day forecast (c) Smarter Stand In Processing (STIP): Authorisation of transactions despite outages, as its current capabilities help to generate an informed decision to approve/decline transactions on behalf of issuers. These value-added services help to entrench stakeholders within Visa’s network and possibly create new revenue streams within transaction processing. (2) Visa Developer Visa Developer (Fig 2) is an open-source framework that allows corporates/developers to build various systems/products while utilising Visa’s source code. The frameworks provide an array of services across different categories such as commercial payments, payment methods, data analytics, and security. These advancements allow Visa to penetrate the eco-system via: (a) Providing more retailers/merchants with ease of convenience to integrate with Visa depending on their needs. For example, Walmart, NFL and Starbucks have integrated with Visa to adopt online check out services within their websites due to better user experience and higher conversion rates in payments. (b) Accessing new market segments that Visa has yet to establish a footing in, especially the likes of P2P/B2B/BNPL transactions within mobile wallet eco systems. Although Visa does not posit a market leading position within these nascent eco-systems, Vasant Prabhu (CFO) opined Visa to minimally grab some parts of the value chain based on existing Visa frameworks that new products/services can be built on – thus Visa is able to charge for API calls, etc. (3) Visa Direct Business Overview Fig 1: Visa Four Party Model Fig 3: B2B Transaction Pain-points Fig 2: Visa Developer Source: Visa Source: Deloitte
  • 3. Adding to Visa Developer, VisaDirect is Visa’s in house network that facilitates new flows, such as P2P, B2B and G2C payments. Particularly for B2B transactions, Visa devoted a deeper focus in grabbing more market share in the nascent space due to various pain-points being faced (Fig 3). For example, Visa established partnerships with Veem, Credorax, Ignition, Ramp and Standard Chartered Bank over FY21 to facilitate cross border B2B transactions across Europe, Latin America and USA. These initiatives will subsequently support virtual card capabilities, spur growth in new payment flows, and drive incremental volume over time. Further, recent acquisitions for FY21 include (1) Tink (US$2B) – a leading fintech start-up focusing on open banking APIs in Europe and (2) CurrencyCloud (US$800M) – a fintech start-up providing forex solutions for cross-border payments. Acquisitions of these start-ups help Visa to navigate an unchartered territory within Europe and possibly fortify its dominant market position, as recent development in regulations could result in competition of Visa’s market share (Fig 4). Business Model Visa has 3 key revenue streams, which are supported by client incentives (Fig 5): (1) Service Revenue Service revenues are what the company earns for services provided to card issuers for the use of Visa’s products. The primary driver of this category is payment volume, which Visa takes a % take-rate off the transaction value. A unique property of this revenue stream is that it is a built-in hedge against consumer inflation – since if cost of goods rises due to demand-pull/supply- push inflation, Visa’s revenue scales accordingly with the cost of goods and services. (2) Data Processing Revenue Data processing revenues are fees that Visa collects for the authorisation, settlement, clearing, and other various access and maintenance fees for using its vast payment network. These revenues are based on the number of transactions made on Visa’s network and not the amount of payment volume. For further elaboration: (1) Authorisation is the process Visa routes the transactions from Point-Of-Sale (POS) to the card issuer for approval, (2) Clearing is the exchange of transaction information between the issuer and the acquirer of the transaction, and (3) Settlement is the facilitation of the actual exchange of funds involved between the involved parties. (3) International Transaction Revenue International transaction revenues are earned for cross-border and currency conversion activities. These revenues are generated whenever a card holder purchases a good in a country different from the card-issuer’s country or origin. This revenue stream is typically sensitive to economic cycles, especially virus outbreaks or act of terrorism/political instability that will affect the region’s tourism industry. It also means Visa is affected by the strength of the US dollar more than most companies. (4) Client Incentives Client incentives are deduction from the sum of the 3 revenue streams above. They are monetary payments to Visa’s partners to build product acceptance, build payment volume, and routing of transactions to Visa’s network. Corporate Governance Visa has an exemplary governance structure to facilitate future growth via board of directors, executive management and compensation, and shareholder rights. Fig 4: Regulation Implications Fig 5: FY21 Revenue
  • 4. (1) Board of Directors (BoD) Visa’s BoD (Annex A) comprises of 12 key members. possessing knowledge and experience across relevant fields that are integral for Visa’s future growth. More than 60% of the directors have >5 years of experience, coupled with ethnic diversity, gender equality, and payments and technology domain knowledge. (2) Executive Committee The executive committee comprises of 6 members (Annex B), responsible for the day-to-day operations and future growth of the company. The team is highly experienced and has relevant education and background experience – including finance, marketing, consumer banking, technology and information security, which contributes to Visa achieving its long term goals. The C-suite to work pay ratio is a reasonable ratio of 195:1, way below the usual average of 320:1. This is attributable to Visa’s vision on investing in its workforce. Renumeration of the executive committee is also linked to the performance of the company, as cash incentives are pegged to 50% of the annual fixed base salary. This ensures that the committee are intrinsically motivated to make strategically sound and profitable decisions for the company. (3) Shareholders Visa enjoys a diversified base of institutional shareholders (Vanguard Group, Blackrock, T. Rowe Associates, State Street Corp, Morgan Stanley, etc) (Fig 6). Further, the company has a less than 10% equity concentration from each significant shareholder, thus ensuring diversity and prevention of price crashes via sudden sell-offs. The payments industry (Fig 7) has been growing ever since economies gravitated towards cashless payments from the general usage of cash transactions. This is coupled with a rising middle class who use credit/debit cards for various purchases of goods and services, contributing to the increasing average order value and number of transactions. Further, the industry is poised to grow at a 7.3% CAGR to US$2.1T in 2025 with the following demand drivers as the global economy starts to recover post COVID- 19. (1) Gradual re-opening of economies As 40% of the global population is fully vaccinated, the United Nations World Tourism Organisation (UNWTO) opined a gradual recovery of global tourism with a high probability of hitting its pre-pandemic levels between at mid 2023, with domestic tourism seeing recovery as early as mid 2022. Further, vaccinated travel lanes amongst countries have been expanding and this has resulted in an uptick in travel demand. As a result, a “ripple effect” will be experienced in the payments industry as revenues via credit cards and cross border transactions will increase within the next 24 months. (2) Growth in E-commerce The COVID-19 pandemic has brought about a shift in sales from brick-and- mortar outlets to e-commerce, as seen by high revenue growth in e-commerce players along the value chain such as SEA Group, Amazon, Coupang, Pinduoduo, Shopify, etc. The industry is still poised to grow at a 14.1% CAGR to US$7.4T in 2025 (Fig 8) as brick-and-mortar outlets remain diversified in their sales outlets and a growth in in Average Order Value (AOV) with rise of the purchasing power of an average middle-class individual across the globe. Visa will have ample opportunities to be a leading payment processor in this space, given how the executive committee has been establishing partnerships with merchants, credit card providers, and payment gateway providers. Industry Overview Significant shareholders % shares Vanguard Group 8.46% Blackrock 7.34% Price (T.Rowe) Associates 4.88% State Street Corporations 4.34% Morgan Stanley 2.47% Fig 6: Significant Shareholders 0 1 2 3 2020 2025 2030 Fig 7: Payment Industry (US$T) Source: BCG $3.4 $4.2 $4.9 $5.5 $6.6 $6.8 $7.4 0 4 8 - 10.0% 20.0% 30.0% 2019 2020 2021 2022 2023 2024 2025 E-commerce sales (US$T) % change % of total retail sales Fig 8: E-commerce Industry (US$T) Source: Emarketer
  • 5. (3) Continued industry consolidation and M&A Across the diverse payment industry market segments, market leaders in each aspect of the value chain have been acquiring the toeholds or other segments to gain a stronger overall footing – evidenced by notable Paypal- Honey, Paypal-Paidy and Square-Afterpay acquisitions. Visa has also acquired notable fintech start-ups such as Tink and CurrencyCloud. Further, newer market segments such as BNPL/P2P transactions and mobile wallets will result in more acquisition/consolidation activity in the next few years. Competitive Positioning Visa’s competitive position (Fig 9) is anchored in its large payment network, economies of scale and merchants onboarded – thus creating a sticky platform usage. In a more traditional payment processing competitive analysis, we can identify that thus far, Visa has been the market leader in the payment network space (over 60% of payment volume, transactions and cards belongs to Visa). However, constant disruption of the fintech industry and creation of new market segments could throw Visa off its footing in the long run. An analysis of sub-segments in the payments industry will help to map out the competitive space, showing if Visa can withstand market disruption and hold its position as a market leader in the long run. (1) Payment gateway providers With the proliferation of e-commerce, payment gateway providers (Stripe) have been essential in the online payment value chain. Companies operating in this segment facilitates online payments where a credit/debit card is not physically present, creating a secure connection between the card issuer and the online shopping website. Payment network providers on the other hand (Visa) handles the card transaction, which is encrypted data from the payment gateway provider (Fig 10). Hence, these two stakeholders do not compete with each other but form a segment of the entire payment value chain. However, these payment gateway providers could look into expanding their suite of services and gradually look to support a payment network should economies of scale be enticing enough. I opine this to be rather unlikely since establishing over 60 years of a network effect like Visa is a huge barrier to entry, thus these players will remain to branch their services across different shopping sites/applications and remain as a gateway provider instead. (2) Mobile wallets Recently, there has been a proliferation of mobile wallet providers from banks, digital payment providers, and large conglomerates. The mobile wallets aim to possibly eliminate payment network intermediaries out of the value chain (Fig 11), thus saving in transaction fees and having consumers’ dataset to create new value streams (loans, working capital financing, reward systems etc). Thus, mobile wallets pose a huge threat to the payment network incumbents so long as user uptake growth and monetary transaction remains within the wallet’s eco-system. Mobile wallets can be further categorised into (a) Open-loop: Able to transact with different merchants when payments are made (E.g AliPay, GooglePay, CashApp, PayPay, GrabPay, etc) (b) Closed-loop: Created internally for consumer related conglomerates where one uses the wallet for transaction within the conglomerate’s outlets. (E.g Walmart, Starbucks) (3) End-to-end digital payments (acquirers and processers) Square and Paypal are notable market leaders although they have different origins. Paypal originally provided online payment processing by granting the ability to transfer funds electronically between individuals and businesses, like a payment processing network but for online payments (usage of ACH – Automated Clearing House) (Fig 12). Over time, the company now acts as an 0% 100% Payment Volume Total Volume Total Transactions Cards Visa Mastercard American Express JCB Diners Club Fig 9: Visa Market Share Source: Visa Fig 10: Gateway Value Chain Fig 11: Mobile Wallet Value Chain
  • 6. acquirer, payment gateway, network processor, etc, and even created its own mobile wallet (PayPay), with the goal of creating an eco-system so that monetary value doesn’t leave PayPal (further elaboration on mobile wallet analysis below). On the other hand, Square initially provided Point-Of-Sale (POS)/magnetic stripe reader services focusing on SMEs), and subsequently branched into a mobile wallet (CashApp), with a similar goal of retaining monetary value in its own eco-system. These companies pose a significant threat to payment network bigwigs as they have established a footing in another aspect of the payments landscape and yet aim to eliminate the intermediaries by creating their own eco-system (4) Decentralised finance and cryptocurrencies Eventual progress in blockchain protocols has created specific chains focused on decentralised finance such as Ethereum, Solana, and Luna (powered by Terra). Subsequently, a myriad of projects have been created off these initial chains that enable decentralised finance. For example, Terra Luna supports transaction and staking of stablecoins that offer instant settlement, low fees, and seamless cross border transactions. Despite DeFi’s infancy and relatively low uptake, such disruption can not be ignored as its threat is more significant than the uptake of mobile wallet transactions. Porter’s 5 Forces After reviewing the industry and the broader competition against Visa, a porter’s 5 forces analysis shows threat of substitute products as one of the strongest threat and most imminent should user uptake and preference growth exponentially (Fig 13, Annex C). As a result, Visa looks to mitigate its risk via different strategies, which will be explained in the risk segment further into the report. Despite stellar Q4 FY21 earnings to close out a strong financial year for Visa, the stock price has been corrected by almost 20% due to conservative management estimates for FY22 and upcoming litigation settlements on its “swipe fees”. However, Visa has potential tailwinds that can act as a further catalyst for its increase in share price. (1) Growth in Visa’s revenue in APAC region Visa’s APAC payment and transaction volume have been relatively muted due to its closed economy – its total revenue 30% below 2019 figures. As such, the re-opening of key countries in APAC region is a key variable in Visa’s top- line growth. As of end 2021, countries such as Singapore, Indonesia, Thailand, South Korea and India have re-opened its borders with selective countries. With a 13% APAC market share (Fig 14) as of FY20 (larger than Mastercard’s 7%), gradual re-opening of the economy for business/tourism shows promise as a catalyst for Visa. Further promise lies on other countries such as Japan, Hong Kong, China, Malaysia, Vietnam, Philippines as they currently remain closed to most international travellers. Vaccinations rates (Fig 15) have been increasing – most countries mentioned above have >50% vaccination rates. Additionally, Q4 earnings review mentioned renewal Visa’s top 20 issuers in APAC and investment focus into digital solutions to ride the digital wave in Southeast Asia (Visa Paywave, tokenisation, QR Codes, etc). Thus, re-opening of borders ais opined to be imminent and the recovery of travel and tourism will be assuring for Visa. (2) High inflation rates via demand-pull/supply-push inflation Investment Thesis 76% 13% 7% 2% 1% 1% UnionPay Visa MasterCard JCB AMEX Diners Fig 12: ACH Value Chain 0 1 2 3 4 5 Bargaining power of suppliers Bargaining power of buyers Threat of new entrants Threat of substitute products Competitive rivalry Fig 13: Porter’s Five Forces Fig 14: Market Share APAC (Incl China) Source: Statista
  • 7. Due to COVID-19, there has been a surge in supply chain bottlenecks, resulting in supply-push inflation towards goods and services as export prices have increased by about 10 points on the index globally, On the demand side, volatile labour market conditions and global expansionary monetary policies have led to a growth in inflation rates. For example, USA’s inflation rate increased from 1.2% in Nov 20 to 5.4% in Sep 21 (Fig 16). Continued inflation growth is ironically a good indicator for Visa given the nature of its business model – Visa takes a percentage cut off the value of the transaction. As inflation is priced into the various goods and services, Visa’s revenue will scale along with inflation and top-line growth will increase by a healthy amount. (3) Hike in swipe fees and slash in interchange fees come Apr 2022 Upon gradual recovery of the world economy, Visa/Mastercard will eventually enact a merchant fee hike come April 2022 (contingent on future circumstances). The blended increment of 4.7% in take rate (Visa will collect US$1.99 from US$1.90 per US$100 transaction) will inevitably increase Visa’s top line revenue by a sizeable amount, as the hike in fees projects an increment of US$117 billion in costs for businesses globally (these costs will be revenue for payment network providers). Further, Visa is adopting a more aggressive strategy for card adoption in specific sectors (real estate, healthcare, education, rent, parking, vending machines) as it seeks to reduce its interchange fee (these are payments made to card-issuing bank) from $1.15 to $0.77 for a US$50 transaction. Management has opined that balancing out swipe fee increments with a slash in interchange fees can drive top-line growth sustainably – swipe fees increase to take advantage of the high-inflation environment and recovery of tourism, and interchange fees decrease to drive user adoption growth (from both merchants, banks, and consumers) in market segments where non-cash payments are not widely used. However, this thesis has a potential to fall flat as other stakeholders have responded negatively towards the hike in take rate. Just recently, Amazon released a statement to introduce a 0.5% surcharge fee for Visa credit card transaction in Singapore and Australia from 15 Sep 2021 and 1 Nov 2021 respectively. Such retaliation will negatively affect Visa’s revenue. Upon further analysis, is to be believed that these propositions may not adversely affect Visa to a large extent since (1) Singapore is one of the smallest market for Amazon (Amazon is implementing this surcharge fee in Singapore only), (2) only purchases of goods and consumer electronics are affected (groceries, in-app purchases, subscription schemes, etc are not affected), and (3) it has been 2 months and there has been no subsequent announcement from Amazon to introduce this surcharge fees onto other markets. 2018A 2019A 2020A 2021A 2022E 2023E 2024E 2025E 2026E 2027E Financial Analysis Profitability Gross Margin 79.0% 78.8% 76.6% 74.2% 73.5% 73.5% 73.0% 73.0% 73.5% 74.0% EBITDA Margin 52.0% 53.7% 52.1% 51.1% 49.6% 49.6% 49.2% 49.2% 49.8% 50.3% Profit Margin 39.5% 41.4% 38.1% 37.9% 36.7% 37.1% 37.3% 37.6% 38.5% 39.3% ROA 16.6% 13.4% 14.9% 16.2% 16.8% 16.6% 16.2% 16.5% 16.4% ROE 34.8% 30.0% 32.8% 34.0% 31.0% 28.4% 26.1% 24.4% 22.9% ROIC 13.5% 10.1% 11.5% 11.9% 12.1% 11.8% 11.4% 11.4% 11.3% Liquidity Current Ratio 1.56 1.91 1.75 1.49 2.21 2.88 2.86 3.52 4.90 Quick Ratio 1.33 1.64 1.47 1.20 1.86 2.53 2.58 3.21 4.54 Debt/Equity Ratio 1.09 1.23 1.21 1.10 0.84 0.71 0.61 0.48 0.39 Returns Earnings per Share 5.5 6.4 5.8 6.5 7.1 8.1 9.0 9.9 11.0 12.1 Operational Metrics Payment Volume (US$B) 11,269 11,597 11,347 13,001 14,157 15,192 16,140 17,058 17,857 18,547 No. of Transactions (Millions) 182,974 201,871 204,097 232,448 265,005 298,864 333,217 367,137 399,569 431,609 - 20% 40% 60% 80% 100% Singapore Cambodia Malaysia Hong Kong Japan South Korea Australia India Philippines New Zealand Laos Thailand Indonesia Vietnam Myammar Financial Analysis Fig 15: Vaccination Rates APAC (%) Source: Singapore Business Review - 1.0% 2.0% 3.0% 4.0% 5.0% 6.0% Nov-20 Dec-20 Jan-21 Feb-21 Mar-21 Apr-21 May-21 Jun-21 Jul-21 Aug-21 Sep-21 Fig 16: US Inflation Rate (%) Source: Singapore Business Review
  • 8. Historical revenue grew at a 7.6% CAGR to US$32B in FY21 and projected revenue will grow at a 9.2% CAGR to US$52B in FY27 (Fig 17). All revenue streams are projected separately and regionally. Service revenues are determined by the amount of payment volume generated across key regions for Visa and multiplied by a blended take rate. Transaction revenues are determined by the number of transactions generated across key regions for Visa and multiplied by a blended take rate. Cross border revenues are determined by a percentage off payment volume. Payment volume, number of transactions, and cross border revenues/others are then grown at a specific rate catered specifically to each region to project Visa’s future revenue. On base case, it is estimated that USA, APAC, and Europe will experience a relatively higher growth in revenue as compared to other regions based on global economic outlook (re-opening of economy to tourism, adoption of e- commerce/digital payments, etc), with APAC being the most sensitive key driver to overall revenue. Visa’s margins have been stable over the past FYs, with a slight dip in margins (Fig 18) attributable to increments in client incentives as part of the company’s long term strategic growth. Client incentives will be likely to remain as 26-27% of total revenue as compared to the average of 24-25%, since management intends to be slightly more aggressive in onboarding/renewing partnerships and deals with the company’s stakeholders – this will allow Visa to position itself well post COVID-19 tourism recovery and during the e-commerce boom in APAC. Visa maintains its overall superiority in margins when compared to its peers, along with strong ROA (13.4%) and ROE (30.0%). Despite strong performances when compared to its peers, Mastercard presents a stellar ROE at 102.5% (Fig 19). However, deeper analysis shows us that Mastercard is undertaking huge leverage with his >2.0 Debt/Equity ratio when compared to Visa’s 1.2 Debt/Equity ratio. A lower leverage ratio is desired during this global economic recovery phase as the factors for recovery seem uncertain at this point of time. Thus, a prudent debt/equity ratio is desired should future financial quarters turn unfavourable. Further, an underleveraged capital structure can readily support a post-COVID era expansion into different target markets and market segments. Overall, Visa is posited to maintain as the market leader in the payment network landscape, achieving up to US$20T in payment volume and 431B transactions by FY27. A buy recommendation is reiterated with a 12-month price target of XX, presenting a 19.1% upside potential on the closing price of US$213 on 10th Nov 2021. In order to determine the value of the company, a DCF methodology is applied with the use of (1) EV/EBITDA multiple and (2) terminal growth rate. To confirm the robustness of the DCF, a sensitivity analysis will be applied. The overall analysis is also supplemented with relative valuation. DCF Valuation The DCF valuation employs the Free Cash Flow to the Firm (FCFF) methodology to arrive at the intrinsic value of the company. This model fits Visa’s profile, allowing to account for future growth prospects and the generation of cash flow regardless of the capital structure. Visa’s historical numbers are consolidated from FY18 to FY21 and projections are conducted from FY22 to FY27. - 20,000 40,000 60,000 Revenue (US$B) Service Transaction Cross Border Other(s) - 0.5 1.0 1.5 2.0 2.5 - 30.0% 60.0% 90.0% 120.0% Visa Mastercard American Express Discover ROA ROE Net Margin Debt/Equity Valuation Fig 17: Visa’s Revenue (US$B) Fig 18: Visa’s Margins (%) Fig 19: Peer Comparables - 20.0% 40.0% 60.0% EBITDA Margin (%) Profit Margin (%)
  • 9. Weighted Average Cost of Capital (WACC) WACC (Fig 20) is estimated at 7.60% for Visa. Cost of debt is calculated by taking the blended average on the corporate debt taken by Visa and adding the 10-year risk free rate. The cost of equity is calculated with the CAPM formulate, reflecting USA’s equity risk premium, risk-free rate, and Visa’s historical 5 year Beta. EV/EBITDA and Terminal Growth EV/EBITDA multiple method is derived by taking public comparables across payment network providers, end-to-end digital payment providers, and open- loop/closed-loop digital wallet providers. For the terminal growth rate, Visa is expected to stabalise at around 3% come FY30 onwards, pegged to the long run growth rate of the top companies in mature industry segments. Sensitivity Analysis The DCF model’s robustness to changes was analyzed with respect to key inputs – WACC, terminal growth rate, and EV/EBITDA multiple. It is to note that a decline in APAC, USA, and Europe growth rates in payment volume and transactions will influence the recommendation of Visa. Relative Valuation Public comparables has been identified and analysed, where Visa is compared across payment network providers, end-to-end digital payment providers, and open-loop/closed-loop digital wallet providers. Visa is trading closely most peers that are largely related to Visa’s line of work with an exception of Mastercard being valued at a slightly higher multiple. A plausible reason could be due to Mastercard’s first mover advantage into B2B and BNPL transactions, something Visa is still expanding on. However, the stagnation of Mastercard’s growth and larger market share of Visa should reprice Visa’s share price (Fig 21). The top three investments risks (Fig 22) for Visa include (1) regulatory risks, (2) rapidly changing business environment, and (3) business disruptions. Although business disruptions via decentralized finance pose to harm profitability and reduce investment return, Visa’s recommendation for purchase is to take advantage of the mispriced share price over Q4 FY21 earnings and ride the tourism recovery and inflation wave for the next 12 months. (1) Political risk: Regulation Visa has been facing recent litigation cases over predatory pricing on its swipe fees, thus translating into unhappiness amongst stakeholders on Visa’s network. The inability to resolve these litigation cases can lead to loss of market share to competitors such as Mastercard and suppressed revenue Company Name Revenue (US$M) EBITDA US$(M) Enterprise Value Gross Margin EBITDA Margin EV/LTM REV EV/NTM REV EV/LTM EBITDA EV/NTM EBITDA 2019 2020 2021 2019 2020 2021 Payment Network Visa Inc. 23,525 21,479 25,192 16,409 14,736 17,415 457,115 96.7% 68.6% 21.3x 16.2x 31.0x 23.0x Mastercard 16,883 15,301 18,850 10,189 8,742 10,898 345,196 100.0% 57.1% 22.6x 16.0x 39.5x 26.7x American Express 39,983 31,357 41,707 NM NM NM NM 70.4% NM NM NM NM NM Discover Financial 8,228 5,954 12,020 NM NM NM NM 90.9% NM NM NM NM NM Digital Payments PayPal Holdings 17,772 21,454 25,220 3,411 4,295 7,394 237,781 46.6% 20.0% 11.1x 8.3x 53.3x 29.2x Square 4,714 9,498 17,660 83 46 1,003 107,034 28.9% 0.5% 11.3x 5.9x NM 108.6x Open-Loop Wallets Amazon.com 280,522 386,064 470,265 36,193 48,150 69,956 1,870,927 39.6% 12.5% 4.8x 3.6x 34.4x 24.0x Alibaba 70,214 98,675 135,923 20,290 23,602 29,123 408,342 43.2% 23.9% 4.1x 2.8x 16.2x 12.9x Alphabet 161,857 182,527 253,960 48,133 54,903 105,973 1,864,695 53.6% 30.1% 10.2x - 32.3x - Apple 267,683 294,135 371,719 78,121 85,159 123,770 2,420,255 38.8% 29.0% 8.2x 6.4x 28.4x 20.2x Tencent Holdings 54,186 73,839 90,161 19,871 26,236 31,341 591,309 46.0% 35.5% 8.0x 6.0x 21.7x 17.6x Closed-Loop Wallets Starbucks Corporation 26,973 23,170 30,294 5,545 2,873 6,853 151,667 21.3% 12.4% 6.5x 4.6x 26.7x 21.5x Walmart 523,964 559,151 560,038 32,455 38,100 37,068 462,951 24.8% 6.8% 0.8x 0.8x 11.2x 12.4x StoneCo 594 612 819 342 298 352 8,583 76.2% 48.6% 14.0x 7.2x 28.0x 19.8x Mean 10.3x 6.5x 29.3x 26.3x Median 9.2x 6.0x 28.4x 20.8x Investment Risks Input Rate Source Risk free rate 1.5% US 10-year Treasury Beta 0.92 Capital IQ Equity Risk Premium 7.3% USA Cost of Equity 8.2% CAPM Cost of Debt 2.6% Blended corporate rate+risk free rate Tax Rate 19.5% Management's Guidance WACC 7.5% Fig 20: WACC Calculation Fig 21: Football Valuation
  • 10. growth as the company is unable to raise its swipe fees intended for April 2022. Next, the Europe Union has continuously mandated for an in-house intra-Europe payment processing network (in order to reduce its dependence on external intermediaries), thus reducing Visa’s presence in Europe should such a network be built. Lastly, subsequent expansion strategies into Asia such as China, India, and Russia can pose a significant barrier to entry as (1) Russia prevents Visa from processing domestic transactions, (2) UnionPay in China is the sole processor of domestic transactions and Visa’s approval to operate in China could take several working years, and (3) India’s growing nationalistic priorities could lead to cost implications on Visa. Visa has recognized the inability to target the Asian countries with high barrier to entry, thus it looks to solidify its positioning in other countries so as to remain steadfast should players like UnionPay look to expand out of China. Further, most litigation cases have been resolved peacefully (often only resulting in a fine), thus Visa should still remain as a leading payment network provider. (2) Market risk: Rapidly changing business environment User uptake on mobile wallets and payments can lead to a different set of consumer demands. Further, Visa can be eliminated out of this new eco- system as future competitors look to entrench money without their own payment network and therefore cut intermediaries out of the picture. Visa is currently mitigating this risk by its Visa Developer API protocols so that future systems surrounding mobile payments etc can be build on Visa and there are able to capture a small share of this new eco-system. (3) Operational risk: Business disruption A huge disruption beyond just a different preference for a method of payment in risk (2) will be the adoption of decentralised finance. Crypto projects built on different chains such as Ethereum, Solana, Terra (hosted by Luna) aim to cut off intermediaries where transaction of payments are supported by these crypto projects. Although user uptake currently is at its nascent stages, advancements in these projects and eventual user uptake cannot be ignored as most value creation methods look to act as a new form of intermediaries – thus Visa could be entirely replaced by cryptocurrencies. Stocks covering the payments eco-system have taken a huge beating and it is rather justifiable given how most stocks have priced in FY21 recovery on transactions and payment volume. However, Visa has been mispriced by over 20% from its ATH (and recommended price target). An entry into Visa is recommended as I believe that the market has mispriced Visa over conservative management projections over FY22 and a slight rotation from financial services to technology and semiconductors (of what used to be a rotation out of semiconductors roughly 9-12months ago). Should recovery of global tourism and inflation remain as projected, Visa still stands to gain relatively huge upside in the next 12 months. However, one cannot ignore disruptive forces in the market such as mobile payments and cryptocurrencies, thus it is recommended to deploy into both Visa and either a mobile wallet provider (Paypal/Square/etc) or an upcoming crypto project with good user uptake (Solana/Terra/etc). Disclaimer The information set forth herein has been obtained or derived from sources generally available to the public and believed by the author(s) to be reliable, but the author(s) does not make any representation or warranty, express or implied, as to its accuracy or completeness. The information is not intended to be used as the basis of any investment decision by a person or entity. This information does not constitute investment advice, nor is it an offer or a solicitation of an offer to buy or sell any security. Personal Take Fig 22: Risk Assessment
  • 11. Annex A: Board of Directors
  • 12. Annex A: Board of Directors
  • 13. Annex B: Executive Committee
  • 14. Annex B: Executive Committee
  • 15. Bargaining power of suppliers • Controlled by client incentives (relative), server costs, and push-pull factors on the labour market • Server costs will not look to be too pricey as cloud bigwigs (Amazon, Google, Microsoft) will look to provide cost savings on using cloud computing • Client incentives will largely depend on Visa's aggressive growth strategies. Can introduce more enticing incentives at the opportunity cost of lowered net revenues • Labour market will remain tight, as seen by constant demand of quality software engineers] Bargaining power of buyers • Mainly onboarding of different merchants. They remain sticky to visa due to the network effect and the large uptake of visa on consumers' credit/debit cards • Merchants have been protesting on the relatively "exorbitant" take-rates of Visa's business model but have not moved out of Visa, due to how inherently the payment network is Threat of new entrants • New entrants directly servicing a payment network will be close to none, since it takes decades to build up such a network Threat of substitute products • Threats include mobile wallets, end to end payment providers, and decentralised finance • These threats can fully displace out Visa in the long run if user uptake continues to grow. This is especially so for the unbanked population since Visa derives its growth from the usage of card transactions Competitive rivalry • Looking amongst the different payment network providers (Mastercard, American Express, etc), Visa remains as the market leader with almost 60% of the market share • Little to no competition, but market has mostly been stabilised so it will be hard for Visa to attain more market share than what it already has • Slight thing to note that Mastercard has been powering B2B transaction and digital banking earlier than Visa, thus grabbing more market share in these nascent spaces Annex C: Porter’s 5 Forces
  • 16. Balance Sheet Assets Cash and cash equivalents 7,838 16,289 16,487 13,843 19,314 29,579 41,001 49,915 61,863 Restricted cash equivalents-U.S. litigation escrow 1,205 901 894 894 894 894 894 894 894 Investment securities 4,236 3,752 2,025 2,025 2,025 2,025 2,025 2,025 2,025 Settlement receivable 3,048 1,264 1,758 2,007 2,246 2,492 2,723 2,945 3,166 Accounts receivable 1,542 1,618 1,968 2,107 2,359 2,617 2,859 3,092 3,325 Customer collateral 1,648 1,850 2,260 2,260 2,260 2,260 2,260 2,260 2,260 Current portion of client incentives 741 1,214 1,359 1,359 1,359 1,359 1,359 1,359 1,359 Prepaid expenses and other current assets 712 757 856 1,304 1,460 1,620 1,770 1,914 2,058 Total current assets 20,970 27,645 27,607 25,800 31,917 42,845 54,890 64,404 76,950 Investment securities 2,157 231 1,705 3,103 4,074 4,860 5,629 6,385 6,730 Client incentives 2,084 3,175 3,245 3,245 3,245 3,245 3,245 3,245 3,245 Property, equipment and technology, net 2,695 2,737 2,715 3,198 3,576 3,796 3,920 3,900 3,735 Goodwill 15,656 15,910 15,958 15,958 15,958 15,958 15,958 15,958 15,958 Intangible assets, net 26,780 27,808 27,664 27,664 27,664 27,664 27,664 27,664 27,664 Other assets 2,232 3,413 4,002 4,002 4,002 4,002 4,002 4,002 4,002 Total assets 72,574 80,919 82,896 82,970 90,436 102,370 115,308 125,558 138,284 Liabilities Accounts payable 156 174 266 306 342 387 423 449 473 Settlement payable 3,990 1,736 2,443 2,659 2,976 3,364 3,676 3,902 4,116 Customer collateral 1,648 1,850 2,260 2,260 2,260 2,260 2,260 2,260 2,260 Accrued compensation and benefits 796 821 1,211 1,211 1,211 1,211 1,211 1,211 1,211 Client incentives 3,997 4,176 5,243 5,243 5,243 5,243 5,243 5,243 5,243 Accrued liabilities 1,625 1,840 2,334 2,334 2,334 2,334 2,334 2,334 2,334 Current maturities of debt - 2,999 999 3,250 - - 4,000 2,850 - Accrued litigation 1,203 914 983 74 74 73 70 65 59 Total current liabilities 13,415 14,510 15,739 17,337 14,441 14,872 19,216 18,314 15,696 Long-term debt 16,729 21,071 19,978 16,728 16,728 16,728 12,728 9,878 9,878 Deferred tax liabilities 4,807 5,237 6,128 5,944 6,728 7,508 8,264 9,150 10,050 Other liabilities 2,939 3,891 3,462 3,462 3,462 3,462 3,462 3,462 3,462 Total long term liabilities 24,475 30,199 29,568 26,134 26,918 27,698 24,454 22,490 23,390 Total liabilities 37,890 44,709 45,307 43,470 41,359 42,570 43,670 40,804 39,086 Equity Preferred stock (Series A to C) 5462 5086 3,080 3,080 3,080 3,080 3,080 3,080 3,080 Class A-C par value stock + additional paid-in capital - right to recover for covered losses 16,370 16,682 18,722 10,771 9,386 8,068 6,814 5,620 4,487 Retained Earnings 13,502 14,088 15,351 25,213 36,174 48,216 61,308 75,618 91,196 Accumulated other comprehensive income (loss), net: Investment securities 6 3 (1) Defined benefit pension and other postretirement plans (192) (196) (49) Derivative instruments 199 (291) (257) Foreign currency translation adjustments (663) 838 743 Total accumulated other comprehensive income (loss), net (650) 354 436 436 436 436 436 436 436 Total equity 34,684 36,210 37,589 39,500 49,076 59,801 71,638 84,754 99,198 Total liabilities and equity 72,574 80,919 82,896 82,970 90,436 102,370 115,308 125,558 138,284 Annex D: Financials Income Statement Revenue Service revenues 8,918 9,700 9,804 11,475 12,742 13,977 15,172 16,375 17,500 18,547 Data processing revenues 9,027 10,333 10,975 12,792 15,105 17,633 20,326 22,763 25,173 27,623 International transaction revenues 7,211 7,804 6,299 6,530 7,019 7,537 8,041 8,516 8,933 9,369 Other revenues 944 1,313 1,432 1,675 1,759 1,847 1,939 2,036 2,138 2,245 Total Revenue 26,100 29,150 28,510 32,472 36,625 40,994 45,478 49,690 53,744 57,784 11.7% (2.2%) 13.9% 12.8% 11.9% 10.9% 9.3% 8.2% 7.5% Client incentives 5,491 6,173 6,664 8,367 9,706 10,863 12,279 13,416 14,242 15,024 Net Revenue 20,609 22,977 21,846 24,105 26,919 30,131 33,199 36,274 39,502 42,760 79.0% 78.8% 76.6% 74.2% 73.5% 73.5% 73.0% 73.0% 73.5% 74.0% Operating Expenses Personnel 3,170 3,444 3,785 4,240 4,819 5,424 6,042 6,711 7,189 7,697 Marketing 988 1,105 971 1,136 1,263 1,416 1,527 1,632 1,778 1,924 Network and processing 686 721 727 730 863 966 1,064 1,163 1,266 1,371 Professional fees 446 454 408 403 450 504 555 606 660 715 General and administrative 1,145 1,196 1,096 985 1,100 1,231 1,357 1,482 1,614 1,747 Litigation provision 607 400 11 3 269 271 266 254 237 214 Depreciation and amortization 613 656 767 804 982 1,098 1,235 1,367 1,524 1,667 Total Operating Expenses 7,655 7,976 7,765 8,301 9,745 10,910 12,046 13,215 14,269 15,335 Operating income 12,954 15,001 14,081 15,804 17,174 19,221 21,153 23,058 25,233 27,425 EBITDA 13,567 15,657 14,848 16,608 18,156 20,319 22,388 24,425 26,757 29,092 EBITDA Margin (%) 65.8% 68.1% 68.0% 68.9% 67.4% 67.4% 67.4% 67.3% 67.7% 68.0% Non-Operating Expenses (Income) Investment income and other (464) (416) (225) 513 244 279 303 325 346 346 Interest expense, net 612 533 516 (772) 486 329 73 (145) (459) (792) Total Non-operating Expenses (Income) 148 117 291 (259) 486 329 73 (145) (459) (792) Profit Before Tax (PBT) 12,806 14,884 13,790 16,063 16,688 18,891 21,080 23,203 25,691 28,217 Taxes 2,505 2,804 2,924 3,752 3,254 3,684 4,111 4,525 5,010 5,502 Tax Rate (%) 19.6% 18.8% 21.2% 23.4% 19.5% 19.5% 19.5% 19.5% 19.5% 19.5% Net Profit 10,301 12,080 10,866 12,311 13,434 15,208 16,970 18,678 20,681 22,715 Net Margin (%) 50.0% 52.6% 49.7% 51.1% 49.9% 50.5% 51.1% 51.5% 52.4% 53.1%
  • 17. Cash Flow Statement Cash flow from operations: Net income 10,301 12,080 10,866 12,311 13,434 15,208 16,970 18,678 20,681 22,715 Adjustments in cash flow operations: Client incentives 5,491 6,173 6,664 8,367 9,706 10,863 12,279 13,416 14,242 15,024 Share-based compensation 327 407 416 542 549 615 682 745 806 867 D&A in PPE and intangible assets 613 656 767 804 982 1,098 1,235 1,367 1,524 1,667 Deferred income taxes (1,277) 214 307 873 (184) 785 780 756 886 900 VE territory covered losses incurred (11) (172) (37) (147) - - - - - - Other (64) (271) (145) (821) - - - - - - Changes in operating working capital: Settlement receivable (223) (1,533) 1,858 (468) (249) (239) (246) (231) (222) (221) Accounts receivable (70) (333) (43) (343) (139) (251) (258) (242) (233) (232) Client incentives (4,682) (6,430) (8,081) (7,510) (9,706) (10,863) (12,279) (13,416) (14,242) (15,024) Other assets 59 (310) (402) (147) (448) (156) (160) (150) (144) (144) Accounts payable 3 (24) 21 88 40 36 45 36 26 25 Settlement payable 262 1,931 (2,384) 679 216 317 388 312 226 214 Accrued and other liabilities 1,760 627 923 929 - - - - - - Accrued litigation 452 (231) (290) 70 (909) 1 (2) (3) (5) (6) Net change in operating working capital (2,439) (6,303) (8,398) (6,702) (11,195) (11,156) (12,512) (13,695) (14,594) (15,389) Net cash provided by (used in) operating activities 12,941 12,784 10,440 15,227 13,291 17,413 19,434 21,268 23,546 25,783 Cash flow from investment activities: Purchases of property, equipment and technology (718) (756) (736) (705) (1,465) (1,476) (1,455) (1,491) (1,505) (1,502) Purchase of investment securities (5,772) (2,653) (2,075) (5,111) (5,276) (4,430) (6,084) (9,317) (12,710) (14,975) Proceeds from maturities and sales 3,636 3,996 4,510 5,701 4,122 3,738 5,601 8,874 12,300 14,975 Acquisitions, net of cash and restricted cash acquired (196) (699) (77) (75) - - - - - - Purchases of / contributions to other investments (50) (501) (267) (71) (244) (279) (303) (325) (346) (346) Other investing activities 16 22 72 109 - - - - - - Net cash provided by (used in) investing activities (3,084) (591) 1,427 (152) (2,863) (2,447) (2,241) (2,260) (2,260) (1,848) Cash flow from financing activities: Repurchase of class A common stock (7,192) (8,607) (8,114) (8,676) (8,500) (2,000) (2,000) (2,000) (2,000) (2,000) Proceeds from issuance of senior notes - - 7,212 - - - - - - - Repayments of debt (1,750) - - (3,000) (999) (3,250) - - (4,000) (2,850) Dividends paid (1,918) (2,269) (2,664) (2,798) (3,572) (4,246) (4,928) (5,586) (6,371) (7,137) Payment of deferred purchase consideration related to the Visa Europe acquisition - (1,236) - - - - - - - - Cash proceeds from issuance of common stock under employee equity plans 164 162 190 208 - - - - - - Restricted stock and performance-based shares settled in cash for taxes (94) (111) (160) (144) - - - - - - Payments to settle derivative instruments - - (333) - - - - - - - Other financing activities - - (99) - - - - - - - Net cash provided by (used in) financing activities (10,790) (12,061) (3,968) (14,410) (13,071) (9,496) (6,928) (7,586) (12,371) (11,987) Forex effect on cash (101) (277) 440 (37) - - - - - - Change in cash and cash equivalents (1,034) (145) 8,339 628 (2,644) 5,470 10,265 11,422 8,914 11,948 In USD (US$ Millions) Actuals Estimates Period Ending Sep 31 2018A 2019A 2020A 2021A 2022E 2023E 2024E 2025E 2026E 2027E Working Capital Schedule Excl Client Incentives Current Assets Settlement receivables 3,048 1,264 1,758 2,007 2,246 2,492 2,723 2,945 3,166 Days receivable 38.2 16.2 19.8 20.0 20.0 20.0 20.0 20.0 20.0 Accounts receivables 1,542 1,618 1,968 2,107 2,359 2,617 2,859 3,092 3,325 Days receivable 19.3 20.7 22.1 21.0 21.0 21.0 21.0 21.0 21.0 Prepaid expenses 712 757 856 1,304 1,460 1,620 1,770 1,914 2,058 Days receivable 11.3 12.6 13.0 13.0 13.0 13.0 13.0 13.0 13.0 Total Current Assets 5,302 3,639 4,582 5,418 6,065 6,728 7,351 7,951 8,549 Current Liabiliites Accounts payable 156 174 266 306 342 387 423 449 473 Days payable 9.2 9.5 11.6 11.5 11.5 11.5 11.5 11.5 11.5 Settlement payable 3,990 1,736 2,443 2,659 2,976 3,364 3,676 3,902 4,116 Days payable 235.9 95.1 106.6 100.0 100.0 100.0 100.0 100.0 100.0 Accrued litigation 1,203 914 983 74 74 73 70 65 59 Days payable 1,097.7 30,328.2 119,598.3 100.0 100.0 100.0 100.0 100.0 100.0 Total Current Liabiliites 5,349 2,824 3,692 3,039 3,393 3,824 4,168 4,416 4,648 Total Operating Working Capital (Excl client incentives) (47) 815 890 2,380 2,672 2,905 3,183 3,536 3,901 Change in total operating working capital (47) 862 75 1,490 292 232 279 352 365
  • 18. In USD (US$ Millions) Actuals Estimates Period Ending Sep 31 2018A 2019A 2020A 2021A 2022E 2023E 2024E 2025E 2026E 2027E Depreciation Schedule CAPEX 756 736 705 1,465 1,476 1,455 1,491 1,505 1,502 CAPEX as % of Revenue 2.6% 2.6% 2.2% 4.0% 3.6% 3.2% 3.0% 2.8% 2.6% Accumulated Depreciation 3,875 4,424 5,228 6,134 7,180 8,365 9,692 11,162 12,776 PPE Land 71 71 71 71 71 71 71 71 71 Building and building improvements 965 1,007 1,000 1,073 1,147 1,220 1,295 1,370 1,445 Furniture, equipment and leasehold improvements 1,913 1,997 1,998 2,173 2,350 2,525 2,704 2,885 3,065 Construction in progress 180 163 187 202 216 231 246 261 276 Technology 3,441 3,923 4,019 5,220 6,431 7,624 8,846 10,080 11,312 Total PPE 6,570 7,161 7,275 8,740 10,216 11,671 13,162 14,667 16,169 Acquisition/CAPEX Land - - - - - - - - Building and building improvements 42 35 73 74 73 75 75 75 Furniture, equipment and leasehold improvements 84 85 176 177 175 179 181 180 Construction in progress (17) 7 15 15 15 15 15 15 Technology 482 578 1,201 1,210 1,193 1,222 1,234 1,232 Total CAPEX 591 705 1,465 1,476 1,455 1,491 1,505 1,502 % of CAPEX Average CAPEX into respective PPE Land - - Building and building improvements 7.1% 5.0% Furniture, equipment and leasehold improvements 14.2% 12.0% Construction in progress (2.9%) 1.0% Technology 81.6% 82.0% 100.0% Depreciation Land 71 - - - - - Building and building improvements 1,147 74 73 75 75 75 Furniture, equipment and leasehold improvements 2,349 177 175 179 181 180 Construction in progress 216 15 15 15 15 15 Technology 6,422 1,210 1,193 1,222 1,234 1,232 Count Useful Lifespan Land NA - - - - - - Building and building improvements 40 years 2.5% 2.5% 2.5% 2.5% 2.5% 2.5% Furniture, equipment and leasehold improvements 10 years 10.0% 10.0% 10.0% 10.0% 10.0% 10.0% Construction in progress NA - - - - - - Technology 10 years 10.0% 10.0% 10.0% 10.0% 10.0% 10.0% Land - - - - - - Building and building improvements 29 31 32 34 36 38 Furniture, equipment and leasehold improvements 235 253 270 288 306 324 Construction in progress - - - - - - Technology 642 763 883 1,005 1,128 1,251 Total Depreciation 906 1,046 1,185 1,327 1,470 1,613 Amortisation Schedule Intangible assets (Gross) Finite Customer relationships 701 709 Trade names 199 199 Reseller relationships 95 95 Others 17 17 Indefinite Customer relationships and reacquired rights 22,217 23,317 Visa trade name 4,084 4,084 Amortisation Finite Customer relationships 314 376 Trade names 120 134 Reseller relationships 86 89 Others 13 14 Indefinite Customer relationships and reacquired rights - - Visa trade name - - Total Amortisation 533 613 81 76 52 50 40 54 54
  • 19. In USD (US$ Millions) Actuals Estimates Period Ending Sep 31 2018A 2019A 2020A 2021A 2022E 2023E 2024E 2025E 2026E 2027E Debt Schedule Cash available to pay down debt Cash at beginning of year 16,289 16,487 13,843 19,314 29,579 41,001 49,915 Cash flow before debt paydown 628 (2,644) 5,470 10,265 11,422 8,914 11,948 Manimum cash cushion (10,000) (10,000) (10,000) (10,000) (15,000) (15,000) (15,000) Total cash available to pay down debt 6,917 3,843 9,314 19,579 26,001 34,915 46,863 Long term debt Year Month Interest Rate Principal Sep 2022 Senior Notes 2022 9 2.15% 1,000 16 - - - - - Dec 2022 Senior Notes 2022 12 2.80% 2,250 63 - - - - - Dec 2025 Senior Notes 2025 12 3.15% 4,000 126 126 126 126 - - Apr 2027 Senior Notes 2027 4 1.90% 1,500 29 29 29 29 29 10 Aug 2027 Senior Notes 2027 8 0.75% 600 5 5 5 5 5 3 Sep 2027 Senior Notes 2027 9 2.75% 750 21 21 21 21 21 15 Apr 2030 Senior Notes 2030 4 2.05% 1,500 31 31 31 31 31 31 Feb 2031 Senior Notes 2031 2 1.10% 1,000 11 11 11 11 11 11 Dec 2035 Senior Notes 2035 12 4.15% 1,500 62 62 62 62 62 62 Apr 2040 Senior Notes 2040 4 2.70% 1,000 27 27 27 27 27 27 Dec 2045 Senior Notes 2045 12 4.30% 3,500 151 151 151 151 151 151 Sep 2047 Senior Notes 2047 9 3.65% 750 27 27 27 27 27 27 Aug 2050 Senior Notes 2050 8 2.00% 1,750 35 35 35 35 35 35 Total payment 21,100 603 524 524 524 398 372 Long term debt Long term debt (beginning of year) 21,100 20,101 16,851 16,851 16,851 12,851 Mandatory issurances/(retirements) (999) (3,250) - - (4,000) (2,850) Long term debt (end of year) 20,101 16,851 16,851 16,851 12,851 10,001 Long term interest expense 603 524 524 524 398 372 Blended long term interest rate 2.6% 2.6% 2.6% 2.6% 2.6% 2.6% Other liabilities (Long term lease liabilities) Long term lease liabiliities (beginning of year) 3,462 3,462 3,462 3,462 3,462 3,462 Mandatory issurances/(retirements) - - - - - - Long term lease liabilities (end of year) 3,462 3,462 3,462 3,462 3,462 3,462 Long term lease liabilities interest expense 103 95 82 70 16 16 Long term lease liabilities interest rate 3.0% 2.7% 2.4% 2.0% 0.5% 0.5% Total issuances/ (retirements) (999) (3,250) - - (4,000) (2,850) Total interest expense 706 619 606 594 414 388 Cash at end of year 12,844 16,064 29,579 41,001 45,915 59,013 Interest income 220 289 532 738 872 1,180 Interest rate 1.7% 1.8% 1.8% 1.8% 1.9% 2.0% In USD (US$ Millions) Estimates Period Ending Sep 31 2022E 2022E 2022E 2022E 2022E 2022E Cost of Capital Risk Free Rate 1.5% Debt 29,568 Tax rate 19.5% Market Risk Premium 7.3% Stock Price 213.0 Beta 0.92 Shares Outstanding 1,880,000,000 Cost of Equity 8.2% Equity Value 400,440 Cost of Debt 2.6% Net Debt 12,187 << Debt - cash and cash equivalents WACC 7.803% Enterprise Value 412,627 Unlevered Free Cash Flow EBIT 17,174 19,221 21,153 23,058 25,233 27,425 Less: Taxes 3,254 3,684 4,111 4,525 5,010 5,502 NOPAT 13,920 15,537 17,043 18,534 20,223 21,923 Add: D&A 982 1,098 1,235 1,367 1,524 1,667 Less: Changes in Net Working Capital (4,493) 40 (1,356) (1,184) (899) (795) Less: Capital Expenditures 1,465 1,476 1,455 1,491 1,505 1,502 Unlevered FCF 17,930 15,120 18,178 19,594 21,141 22,882 Net Present Value Calculation Period 1 2 3 4 5 6 Discounted Cash Flow 16,632 13,010 14,510 14,508 14,520 14,579 Sum of Cash Flows 87,759 EBITDA Method Exit Year EBITDA 29,092 Multiple 22.6x Terminal Value 657,485 Net Present Value 418,896 Perpetuity Method Unlevered Free Cash Flow 22,882 Growth Rate 3.5% Terminal Value 550,418 Net Present Value 350,681 Discounted Cash Flow Total Valuation EBITDA Perpetuity Total of present value of cash flows 87,759 87,759 Present value of terminal value 418,896 350,681 Total Enterprise Value 506,655 438,440 Net Debt, Non-controlling interests,preferred securities 29,568 29,568 Equity Value 477,087 408,872 Share Count (Millions) 1,880 1,880 Share Price 253.77 $ 217.49 $ Implied Upside 19.1% 2.1%
  • 20. EV/EBITDA 253.8 19.0x 20.0x 21.0x 22.6x 24.0x 25.0x 26.0x 7.0% 228.1 238.4 248.7 265.2 279.7 290.0 300.3 7.2% 225.6 235.8 246.0 262.3 276.6 286.8 297.0 7.5% 221.9 231.9 242.0 258.0 272.1 282.1 292.1 WACC 7.8% 218.3 228.1 238.0 253.8 267.6 277.4 287.3 8.0% 215.9 225.7 235.4 251.0 264.7 274.4 284.2 8.2% 213.6 223.2 232.9 248.3 261.8 271.5 281.1 8.5% 210.1 219.6 229.1 244.3 257.6 267.1 276.5 Growth Rate 217.5 3.2% 3.3% 3.4% 3.5% 3.6% 3.7% 3.8% 7.0% 252.4 258.6 265.1 272.0 279.3 287.0 295.3 7.2% 238.8 244.3 250.1 256.2 262.7 269.5 276.7 7.5% 220.7 225.4 230.3 235.5 240.9 246.6 252.7 WACC 7.8% 204.8 208.8 213.0 217.4 222.0 226.9 232.0 8.0% 195.6 199.2 203.1 207.1 211.3 215.6 220.2 8.2% 186.9 190.3 193.8 197.4 201.2 205.2 209.3 8.5% 175.2 178.1 181.2 184.4 187.7 191.1 194.7