SlideShare a Scribd company logo
1 of 17
Mouhamadou R. Diaman
TFOA: Professional Preparatory Charter School, Grade 1
1
Proficient Data Narrative-Standard Mastery
Teaching Context
I am a 1st Grade teacher at Professional Prep Charter School in Bedford-
Stuyvesant, Brooklyn New York. The population of Bedford Stuyvesant consists of
332,555 people. According to nyc.gov “64% of residents in Bedford-Stuyvesant are
black, 20% Hispanic, 11% White, 2% Asian and 2% others.” (2016). One in three
residents of Bedford Stuyvesant lives below the federal poverty level and Bedford
Stuyvesant is considered one of the eight-poorest neighborhoods in New York City.
100% of my students (20 out of 20) are eligible for free lunch. Part of our school model,
all of the teachers must live in Bedford Stuyvesant, and I love the fact that when I am
shopping in the grocery store I get to see my students in the neighborhood. It is solely the
main reason why in our school we call each other brothers and sisters because TFOA is
actually a family both in school and outside of the classroom.
Professional Prep Charter School is a K- 5th grade school with 382 students.
Recently, the school was approved to expand to 6th grade for the school year 2016-2017.
50.79% of the students are male and 49.21% of the students are female. 83.25% of the
students are black, 15.97% are Latino, .26%Asian, White .52%. 366 students out of the
382 live in Brooklyn, New York.
I am an inclusion teacher, meaning that my co-teacher and I are the primary
classroom teachers. We teach our students throughout the day. My young scholars
receive movement twice a week, they received soccer twice a week and they have
“Kuumba” (Arts) four-times a week. In addition, the students take Spanish four-times a
week. My co-teacher and I are responsible for the students’ day-to-day learning and
mastery of contents. We have worked very hard to make sure that we are creating a
classroom environment that foster learning and most importantly attending to the little
things with love. We supported our students academically and socially. We take
classroom trips and explore content areas through museums, through music, and
community walks because we want learning in the classroom to be relevant to them.
The demographic of our 1st grade class fairly represent the Bedford Stuyvesant
community and the Professional Prep Charter School’s community at large. 75% of my
students are African American (15 out of 20 students), 3 out of the 15 students (20%)
visits Jamaica periodically because some of their family members live there. 15% of my
students (3 out 20) are Africans, 5% of my student (s) from Mexico (1 out 20) and 5%
Puerto Rican. One of the most amazing features of our classroom is that 90% (18 out 20)
of my students have a sibling that is attending Professional Prep Charter School in one of
the grades from K-5. This makes professional prep unique and demonstrates the core
2
value of family. In the classroom I promote this idea of family to my students and how
we are connected as one because the truth of the matter is that we are a family.
I understand that many of my students have stressful lives and they live in
imperfect situations in which they are not in control of at times. However, their situations
do not define who they are and I want to help shape students who are resilient and who
do give up when they face setbacks. I find first grade to be a very pivotal year for all
children because it is a stage they acquire foundational knowledge in academics and
character education. An Article titled “ How Kids Learn Resilience” by Paul Tough states
“executive functions, which include working memory, attention control, and cognitive
flexibility, are exceptionally helpful in navigating unfamiliar situations and processing
new information…” These findings and my school’s dedication to serve the needs of our
students helped me create a classroom environment that is catering to the needs of the
students. In my classroom, I make sure the students are exploring the content through
multiple modalities and creating opportunities for them to strengthen their executive
functioning skills.
I think that teaching my students about resilience and practicing situation that
involves resilience to solve a particular issue sets them up for success. They are learning
that setbacks are setups for comebacks. This process teaches them problem solving, love,
and be willing to seat and solve problems peacefully through different modalities.
________________________________________________________________________
Data Analysis for All Students
Students’ learning, relative to the Achievement Floor and Ambitious Goal:
My sphere of influence represents the greatest area of impact that I have spent
most time teaching in the classroom. I selected, Social Studies standard mastery as my
area of focus.
I measured 11 standards from the Common Core state Standards (CCSS) for 1st
grade in social studies. These set of standards represent the skills and knowledge
necessary in order for a student to gain mastery of the content and advancement to the
next grade. The instructional scope in my classroom is designed to make sure that all
students demonstrate mastery on the 11 specific common core standards. So based on
these specific standards I could measure student growth based on what I have taught in
the classroom. Throughout the year, I administered four period assessments that are
aligned to the common core social studies standards selected. I average the result of each
interim assessment and the results across all standards for all students to establish overall
standards mastery for the class.
Martin Luther King Jr. is quoted saying “the function of education is to teach one
to think intensively and to think critically. Intelligence plus character-that is the goal of
true education.” This was something that both my co-teacher and I were aiming for the
students. We have morning affirmations and we talk about what it means to be a critical
Mouhamadou R. Diaman
TFOA: Professional Preparatory Charter School, Grade 1
3
thinker and why does having character matter in sharing the space with others in the
classroom? It was a classroom understanding, to work hard and share the classroom
environment with one another. We want to cultivate students who are not only producing
academically but students who embody the attributes of confidence, inquiry, fairness,
focus, reflection, and being able to empathize with their brothers and sisters in the
classroom environment.
Through this process of measuring student achievement, the expectation is to
measure the whole class “Ambitious Goal” to be 80% and an “Achievement floor,” for
70% class average, which is the minimum. So, the aim is to have an ambitious standard
mastery goal of 80% per student and whole class. For social studies, the whole class
Achievement Floor was set at 70% and the ambitious goal was set at a standard mastery
of 80% in social studies.
Overall for social studies we met the Achievement Floor of 70% average standard
mastery, but we didn’t meet the ambitious goal of 80%. Our overall standard mastery
across the social studies standards across First Grade CCSS-Mastery was 79%.
All the students’ academic achievement, displayed relative to the Floor and Goal
The performance groupings for social studies standards mastery relative to the floor and
the goal can be seen in the graph below (figure 1.2).
Figure 1.2- demonstrates the Overall Standards Mastery Achievement, Relative to the
Floor and Goal.
12
8
3
0
2
4
6
8
10
12
14
80%+ Ambitious Goal 70% to<80% Floor, No Goal <70% No Floor
NumberofStudents
Goal Groupings
Yearlong Social Studies Standards Mastery,Relative to
Goal
4
For Social Studies Standards Mastery, 3 students failed to achieve 70% floor
average standards mastery, 12 students achieved 80% average standards mastery of the
ambitious goal, 8 students achieved the floor goal not the ambitious goal. The two
students out of the three students, who have not achieved standard mastery, are students
with speech and language impairment.
Distribution of academic performance for all students:
The performance distribution for individual students in social studies mastery can be seen
in the graphic that follows (figure 1.4).
Figure 1.4-Distribution of individual students’ Social Studies Standards Mastery Achievement.
The range for student performance in social studies standards mastery was not
what I have anticipated. I anticipated that all my students would be meeting at least the
70% average standard mastery; however, that was not the case. The lowest student score
was 44% average standards mastery. The student was 26 points away from the floor goal
and 36 points away from the ambitious goal. The highest score achieved with the four
interim assessments was 97% standards mastery.
Disaggregate Analysis:
For this analysis, it allowed me to explore and investigate trends within the data.
The exploration allows me to show an illustration of the overall standards mastery across
all the assessments. Through the investigation, I decided to make a comparative data
representation between the girls and the boys within the classroom across all the four
assessments. I have 11 girls (n = 11) in my classroom and 12 boys (n = 12) in my
classroom. The girls outperformed the boys by 8 points.
10%
20%
30%
40%
50%
60%
70%
80%
90%
100%
MS KC PT CM SB NH DV TB FA MW MC Jo KM SP ZC IM DR JS SD MB HN FS CS
AverageStandardsMastery
Student Initials
Yearlong Social Studies Mastery,By Student
Mouhamadou R. Diaman
TFOA: Professional Preparatory Charter School, Grade 1
5
Gender Comparison
Gender Overall Average Social StudiesStandard Mastery
F 83%
M 75%
Overall Average 79%
Table 1.2 –Girls vs. Boys, Overall Average Math Standards Mastery
Figure 1.6 below illustrates the aggregate information contained in table 1.4
above. Average standards mastery percentages are demonstrated for each student,
separating boys and girls by blue and red bars in respective bars represented within the
graph.
Figure 1.6- Girls vs. Boys, Overall Average Social Studies Standards Mastery,Student-by-
Student
The distribution of boys and girls performance across the social studies standards
mastery looks fairly close in comparison. The categories are organized from the highest
performing student to the lowest performing student within all four interim assessments.
The graph has demonstrated that the highest performing scholar in the classroom is a boy
and the lowest performing student in the classroom is a boy as well. For the overall
assessment data for the year, there is a noteworthy difference among the three boys in
comparisons to the performance of all the girls in the classroom.
0%
10%
20%
30%
40%
50%
60%
70%
80%
90%
100%
OverallStandardsMastery
Student Initials
Overall Standards Mastery by Gender
Female
Male
6
It is pivotal to understand that the scores above in figure 1.6 are averages of
students’ overall standards mastery. The overall overage was retrieved from the four
interim assessments taken by the students throughout the whole year measuring the 11
social studies standards.
Figure 1.4 shows the distribution of performance for boys versus girls across all
the interim assessments. The graphs demonstrate the average among all the students.
However, the depiction of the graphs do not give you an overall understanding to which
specific standards were mastered by each respective student nor the skills or concepts
necessary to gain mastery of the specific standards.
Figure 1.7- Girls vs. Boys, Midterm, Student by Student
**Midterm score average represents pure assessment average, not standard mastery.
(Attention: first 12 students listed from left to right are female and the remaining 11
students are male).
A glance at figure 1.7 demonstrates a steadiness of performance in all interim
assessments between boys and girls. The overall standard mastery average among the
boys and girls was a performance difference of 8 points. Graph 1.2 demonstrates such
difference between the girls and the boys. Furthermore, the girls’ performance in all the
interim assessments met the ambitious goal of achievement; however, the boys’ total
average of all assessments met the floor goal (70% less than 80%) not the ambitious goal
of 80%. The highest performer in interim assessment #1 was a tie between 3 students
0%
10%
20%
30%
40%
50%
60%
70%
80%
90%
100%
SB ZC SD NH KM HN SP JS FS DV MW FA MB TB KC CM IM DR CS MS PT JW MC
Score
Student Intials
Assessment Level by Student
Groupedby Gender
Assessment 1 Assessment 2 Assessment 3
Assessemnt 4 Linear (Assessment 1) Linear (Assessment 2)
Linear (Assessment 3)
Mouhamadou R. Diaman
TFOA: Professional Preparatory Charter School, Grade 1
7
and 2/3 of the top performers are girls. In interim assessment #2 it was a tie between a
girl and a boy and in assessment #3 it was the same outcome. However, in assessment #4
there were 3 girls that scored a perfect score on the assessment but no boys received a
perfect score in the assessment. In all 4 interim assessments a boy earned the lowest
score.
From a year standpoint, the girls performed at a higher rate than the boys in the
classroom. Due to the rigor of the assessments and the thinking skills needed to master
the exams a student had to be reading at DRA level 20; however, some of my boys were
lacking the reading skills necessary to master the content because they had to read text
and answer questions without guidance. However, all the students demonstrated
resilience and produced their best in all interim assessments.
Descriptive Statistic comparison Boys vs. Girls Standards Mastery
Girls Standard Mastery Boys Standard Mastery Scores
Student
Name
Standard Mastery
Shannon B. 74
Zaina C. 82
Sanii D. 89
Nyla H. 75
Kyleah M. 83
Hadidja N. 91
Saniyah P. 83
Jaslene S. 88
Fatoumata S. 93
Diana V. 82
Madison W. 76
Girls Boys
Mean: 83% Mean: 75%
Median: 83 Median: 78%
Mode: 82 and 83 Mode: 77 and 79
N: 11 N: 12
Range: 19 Range: 53
Based on the descriptive statistical data the girls performed better. Not only that
the girls have a higher average of standards mastery, but the range of performance among
the girls’ scores are lot lower in comparison to the boys. The scores from the girls are less
scattered in comparison to the boys.
My perspective on these whole-class results:
Student
Name
Standard Mastery
Fred A. 77
Mory B. 89
Tavier B. 77
Kareem C. 44
Christopher
M.
74
Isaiah M. 85
Devon R. 88
Cayden S. 97
Mekehi S. 47
Paul T. 68
Jaydin W. 79
Makonene 79
8
In totally, my young scholars have met the Achievement Floor (70% < 80%) in
the standards mastery pathway. The students were one point shy to meet the ambitious
goal of 80%. I believe as a class they are well prepared to perform in the next upcoming
grade and be able to demonstrate their understanding of the content they have learned
with me. The data has illustrated amazing growth and performance from many students;
however, it provided a clear picture in areas where I could improve in teaching my
students and giving them more at bat in specific skills for the young scholars to gain
mastery. In addition, the data gave me an opportunity to reflect on my practice and how
to best serve the young scholars in the future.
I feel satisfied with the results and growth the students have demonstrated;
however, 3 students missed to make the 70% floor achievement and 8 students have met
floor achievement but not the ambitious goal of 80% and above. The students and I were
striving for 80% performance and above for the year; however, we came a bit short.
20/23 students have demonstrated a proficiency of 70% or greater in their overall average
of all 4 interim assessments. I am going to have the same first graders in second grade
and I am looking forward to having the same students again and tailoring instruction to
their needs to meet mastery within the content area. I am excited for the upcoming year,
as I know they are prepared for the next grade in the content area.
Data Analysis for CharacterResults
Character Measure:
I want my students to perform magnificently academically and I also want them
to have a love for learning. I want them to become curious, and question the things they
are learning in the classroom because it allows exploration and investigation of the
content. I want to cultivate students who are agents of their own learning and making
choices that are fair not only to themselves but choices that demonstrate fairness to them
and their greater community. I want scholars who are going to be analyzing every data
they come across and make critical, fair choices that benefit the greater good.
I remember when I was in college my professor used to quote Sriniasan Sririam
from India by stating: “a teacher’s purpose is not to create students in his own image, but
to develop students who can create their own image.” I want my students to appeal upon
this idea of love to help them through setbacks and to solve academic challenges and the
way they communicate with others in the community. So, in order for them to be able to
apply such concept of love with the things or situation they encounter I had explicit
lessons teaching how it looks, sound, feel, taste, and so on...
Mouhamadou R. Diaman
TFOA: Professional Preparatory Charter School, Grade 1
9
Character Results Analysis
Mastery-Based Results In the final (fourth) round of data collection, across all the
indicator evaluations for teacher and student, the average score was 3.88. For the teacher
evaluations, the indicator average was 4.06; for student evaluations, the indicator average
was 3.71.
1.11 below displays the average scores by individual indicator, disaggregated by the type
of evaluation (student vs. teacher).
Strength
Figure 1.11- Average Score by Individual Indicator, based on Final Round
The final average indicator score demonstrate that there is a gap in scoring
between student scores and teacher scores in the evaluation process. However, the
students remained consistent on how they evaluated their demonstration of care for
others, self and recognizing and appreciating others strengths in the classroom.
In figure 1.1-Average score by individual indicator, based on final round, reveals
that the student evaluation of each indicator received a total score of 3.7 out of 5. The
students were more critical in scoring their demonstration of the indicators/actions. Some
of the students who demonstrated the indicators of love tend to evaluate themselves lower
and the ones who may need some work in certain indicators tend to evaluate themselves a
little higher. But, I do see a sense of awareness among the students in regards to their
demonstration of the indicators and how they can align their actions with the specific
1
1.5
2
2.5
3
3.5
4
4.5
Demonstrates
care for others
Demonstrates
care for self
Recognizes and
appreciate others
strengths
outof(5points
Average Final Indicator Score
Student
Teacher
10
indicators in the classroom. (Look at figure 1.12- to see the evolution of students’
awareness of the indicators and how they started evaluating themselves).
Figure 1.12- students evaluation of the indicators Round 1-3
Figure 1.12 shows the greatest difference of student evaluation from round #1 to
round #3. With the student evaluation of demonstrating care for others there is .34
scoring difference between round #1 and #2. However, there is a 0.2 difference from the
average of round #2 and round #3. This demonstrates an evolution of the students
understanding of what this indicator means and how it looks, and feels when it is put into
action.
Character Result Storyline:
How did you build this strength with your students across the year?
At the beginning of the year, some of my students did not demonstrate a lot of
care for their schoolhouse and the way they interacted with each other as classmates was
a bit disconnecting. However, there were few students who embodied the indicators of
love which are demonstrating care for others, demonstrating care for self, and recognizes
and appreciate others’ strength. I usually modeled the indicators of love and made
students aware of their actions when they demonstrate indicators of love as well.
Everyday after breakfast, the students will write their goals on how they are going
to demonstrate the indicators of love throughout the day. At the end of the day, all the
students will share whether they have met their goals or not. If a student has not met his
goal, he has the opportunity to share with the class the next steps needed to accomplish
his specific goal. And sometimes the specific student could ask classmates to share some
positive steps he could take to accomplish his goal. This reflective process on a daily
basis helped the students to continuously reflect on their ability to demonstrate the
Average Round
1
Average Round
2
Average Round
3
Student Evaluation 3.64 3.3 3.5
3.64
3.3
3.5
3.1
3.2
3.3
3.4
3.5
3.6
3.7
outof5points
Demonstrates Care for Others
Mouhamadou R. Diaman
TFOA: Professional Preparatory Charter School, Grade 1
11
indicators of love and become mindful of the choices they are making in and outside of
the classroom.
I started teaching a series of character lessons about love through Nelson
Mandela, Martin Luther King Jr., and Ruby Bridges. The students learned about
Mandela’s desire to fight for human rights and Martin Luther King’s love for his people
and through non-violence marched for equality, justice, and peace. Furthermore, we
explore Ruby Bridges love for learning. Our classroom is named after Mahatma Gandhi
so we explored how do the indicators match with Gandhi’s actions.
This is our daily affirmation of self:
I love myself
I love my self
I love my face
I love my face
I love my nose
I love my nose
I love my lips
I love my lips
I love my ears
I love my ears
I love my hair
I love my hair
I love my brain
I love my brain
And I love my skin
And I love you!!
The affirmation, the lessons and learning about leaders who have demonstrated
the indicators of love have helped and shaped my classroom to the right direction to
become a community.
Are these results reflective of your teacher actions?
Overall my students grew in all indicators and most importantly they are able to
associate the indicators of love with their actions. So with their abilities to recall the
indicators of love it allows them to become mindful with their interactions with others.
The positive change from start of the year to the end of the year was that students started
using the language during their reflection. If another student is not depicting the
indicators of love other students remind such specific student if his actions demonstrate
the indicators of love?
The students have grew in their demonstration of demonstrate care for self. The
round 3-students’ evaluation was 3.61 and round 4 student evaluation of the same
indicator was 4.09. The teacher’s evaluation average for round 3 was 4.04 and round 4
12
teacher’s evaluation average was 4.09. One could see that there is not much of a
difference between the teacher’s evaluation in comparison to the student evaluation and
this is due to the intentional teaching of character education in the classroom. The
students became more aware of the indicators.
In regards to the manifestation of the specific showing of care for others the
students’ evaluation average was 3.70 and the teacher’s evaluation average was 3.95 out
of 5 points. The point’s difference between the teacher scoring average and the students
was .25. Beside the evaluation of the first round average the students have been very
reflective through the evaluation process of how they are demonstrating the specific
indicators. Many of the students during their reflection time spoke about taking
responsibility and being more honest with themselves with their depictions of the
indicators of love. I think that during AM and PM seminars, it revealed the honesty and
the commitment the students maintained through the process.
For many students differentiating between demonstrating care for self and
demonstrate care for others was a tough concept to grasp. The core idea of demonstrating
love is that one has to make a choice based on all the three indicators; however, at the
beginning some students were focusing on only how to show care for self and ignoring
the other two indicators. Due to such circumstances, I had a lesson in exploring the
misconceptions of love. For instance I will ask the students, am I showing the actions of
love if I care for self and do not demonstrate the other actions of love? Please explain.
The students were able to partner up, share their understanding and debate each other.
Students get to share their response with the class and through inquiry and exploring their
misconceptions they come to an understanding of what it means to demonstrate love.
In addition, I shared a quote from Dalai Lama and it states “the best way to
resolve any problem in the human world is for all sides to sit down and talk.” This was a
powerful lesson because it allowed students opportunities to talk to their peers in a loving
manner on things they have done to them and solve those issues in a peaceful manner. I
gave them sentence starters like: When you laugh at me, I feel___________. The
sentences starters allowed the students to explore their feelings and be able to open up to
each other. In return, the activity brought the students closer to each other and
understanding they have more in common.
_______________________________________________
Mouhamadou R. Diaman
TFOA: Professional Preparatory Charter School, Grade 1
13
Next Steps from Analyses of Academic and Character Data
Action step #1 (from academic analyses):
Overall, many of my students have reached the achievement floor (70)% and
some has achieved the ambitious goal (80%). The students have obtained knowledge and
skills necessary to demonstrate their level of mastery to the next grade. However, I have
three young scholars who have not met the floor goal or the ambitious goal. (See figure
1.2- demonstrates the Overall Standards Mastery Achievement, Relative to the Floor and
Goal. And Figure 1.4-Distribution of individual students’ Social Studies Standards
Mastery Achievement.) Based on my analysis it illustrated that the students need more at
bat answering open-ended questions and questions regarding main idea. However, the
underline issue was that the three students were reading below grade level. I have created
opportunities to work with them and used strategies from TEL-301: interventions for
struggling readers for them to have more at bat using different strategies when they come
across unknown words.
Furthermore, I should have collaborated and consulted with other teachers within
the school because that could have benefited the students progression in the classroom. I
could have applied my understanding of SOP-312: Collaboration and Consultation with
Colleagues to collaborate with special education teachers to help differentiate the work
for those three specific students in the classroom.
Many of my students were able to meet the achievement floor and the ambitious
goal because it required me to analyze each quarter’s data. The process allowed me to see
trends among the type of questions they are able to answer and the type of question the
class needs more exposure. The data analysis’ investigation from each quarter painted a
vivid picture on concepts and skills students need to master.
I have intentionally used TC-311 principles of Specialized Instruction to further
push my students in the classroom by teaching to mastery with daily assessments,
checking for understanding, increase individualized practice with the social studies
concepts and creating opportunities for students to experience what they are learning
through classroom trips and demonstrating their understanding through exploration. For
instance, when they were learning about needs and wants I set up a classroom shop and
students had $10 to go shopping in the classroom market. They had to identify what they
bought if it was a need or a want and explore if their choice of certain items will help
them with their survival. This way of teaching my students and exploring the content was
inspired by TC-210: Unit planning because I was able to plan by the Understanding By
Design framework to create key learning experiences for the students.
Another module assessment that inspired my teaching was SOP-216: Working
With Communities. “Community is a word rich in meaning; it can describe both a group
of people who live within certain boundaries (i.e., a neighborhood) and those who share
14
experiences, practices, interests, or beliefs.” (Relay SOP-216, 2016). We were able to
take community walks and engage with community gardens to understanding why do
they have gardens in the community. The students became aware of their communities
and the resource in the Bedford Stuyvesant community has to offer.
I have differentiated work in different levels for my students and pushing their thinking.
However, I should have utilized more of the strategies of TEL-320: Teaching Gifted
Learners to further push the performance of some of my scholars who were performing
above grade level both in social studies concepts, skills and reading level as well.
I am fortunate that I am going to have the same students next year who have
demonstrated mastery of the social studies concepts and skills. Going forward next year, I
have data that will help me with my planning phase for next year to elevate student
performance.
Action Step #2 (from character analysis)
When I used to coach soccer, I used to teach character education to children
before I enter the education system. However, this character growth data collection at
Relay taught me in order to be effective in measuring character there has to be a sense of
understanding from both parties what is being measured and how one is going to be
measured. I enjoyed seeing my students evaluating themselves and seeing where they
stand in demonstrating the indicators of love. It allow me to see the students reflect on
their actions and wondering if their actions matched with the indicators of love.
I had some great scholars who I think exemplify and express the indicators of
love; however, when it came to evaluating themselves they were so harsh on themselves
in the evaluation process. However, it also allowed me opportunities for me to speak to
those students and see their thinking process when they were evaluating themselves. I had
one student who is such a great example in the classroom and demonstrate all the
indicators of love proficiently. But, he usually rates himself low during evaluation. So, I
asked him why he evaluates himself so low and he said, “because at home I don’t listen
to my parents but in school I follow all the directions.” This allowed me to give him a
journal in which he writes down how he has demonstrated the indicators of love at home.
This reflection process helped him a lot and I was surprised his mother called me telling
me she started to see change on how her son is interacting with her. So moving forward
next year, I am going to be pushing my parents to be part of the parent evaluation process
because I saw it shape the relationship between a parent and her son.
I had frequent meaningful conversations with my students in the classroom
regarding demonstration of the indicators of love; however, next year I want to be able to
bring in guest speakers who demonstrate these specific indicators and how those
indicators help them through their profession, interactions with others, and how such
indicators are helping them change the world. Or, I could invite different staff members
and teachers within the school community to have a “TEDTALK” on how showing the
Mouhamadou R. Diaman
TFOA: Professional Preparatory Charter School, Grade 1
15
indicators of love through their line of work help them become better individuals and
workers.
According to a document titled “A Brief History of Character Education in
America,” it states, “the present and future well-being of our society requires an involved,
caring citizenry with good moral character…. people do not automatically develop good
moral character; therefore, conscientious efforts must be made to help young people
develop the values and abilities necessary for moral decision making and conduct.” (U.S
News & World Report, 1996). I have the knowledge and systems in place to now
intentionally measure character growth and help student reflect on this process of
metamorphosing into leaders who demonstrate love, peace, and being critical contributors
of their respective communities.
________________________________________________________________________
Final suggested Action Step (Character Growth)
At professional Prep Charter School the teachers and parents fill out an executive
functioning skills questionnaires. These questionnaires allow the teacher and the parents
to gather information on the child’s strength and weaknesses. This information allows the
teachers to plan and intentionally strengthen the deficient areas of the child and
continuously strengthening the student’s area of strength as well.
The executive function skills are: Self awareness of strength and limitations, goal
setting, planning/organization, initiating, inhibiting, self monitoring and evaluation,
strategic thinking, flexible shifting, adjusting, benefiting from feedback.” (Feeney, 2005).
While I was collecting data on students who were demonstrating the indicators of love I
realized students who lack the ability to independently start an action or an activity
(initiation) tend to not demonstrate the indicators of love.
In addition, mental flexibility is defined as the ability to easily shift from one idea,
train of thought, activity or way of looking at things. (Guare & Dawson, 2013). I realized
students who lack the ability to be flexible in thinking it was very difficult for them to
compromise with others at times or shifting from one thing to another. Therefore, the lack
of flexibility in thinking hindered those students to solve problems peacefully because
they only have one way of looking at a situation. So, it becomes difficult for those young
scholars to demonstrate care for others when things are not going their way or frame of
thinking.
All the executive functioning skills are connected; however, my students focused
on goal setting and planning. According to Hotchkiss, loving and Carson from the
Exceptional Student Services Unit of Colorado Department of Education, “planning is the
ability to set a goal, identify a sequence of actions to reach the goal and carry out that
sequence of steps.” (2015). The process requires ways to solve problems and how they
16
are going to solve problems when they face it. Due to such process and intentional
character lessons it helped many of the students to start solving matters peacefully.
Mouhamadou R. Diaman
TFOA: Professional Preparatory Charter School, Grade 1
17
References
Tough, Paul. (2016). How Kids Learn Resilience. The Atlantic. Retrieved June 2016.
From http://www.theatlantic.com/magazine/archive/2016/06/how-kids-really-
succeed/480744/
Brooklyn Community District 3: Bedford Stuyvesant. (2015) Retrieved June 2nd, 2016.
From https://www1.nyc.gov/assets/doh/downloads/pdf/data/2015chp-bk3.pdf >.
P.2
“A brief history of Character Education in America.” (1996). U.S News and World
Report. Retrieved June 11th, 2016.
<http://www.waarden.org/studie/concepten/history.html>. P.3-4.
Guare, Richard, and Peg Dawson. Smart but Scattered Teens: The Executive Skills
Program for Helping Teens Reach Their Potential. (2013). New York: Guilford.
Print. http://www.guilford.com/guare-forms
Hotchkiss, Heather, and Loving, Kate, et.al. Building Executive Function Skills.
Exceptional Student Services Unit of Colorado Department of Education. (2015).
Retrieved June, 15th.
https://www.cde.state.co.us/facilityschools/facschoolsspringregtraining2015_exec
funcppt>. P-14

More Related Content

Similar to 1st Grade Social Studies Mastery at 79

Closing the achievement gap
Closing the achievement gapClosing the achievement gap
Closing the achievement gapkmf55040
 
Closing the achievement gap
Closing the achievement gapClosing the achievement gap
Closing the achievement gapkmf55040
 
Teacher Work Sample-Darrell Frasier
Teacher Work Sample-Darrell FrasierTeacher Work Sample-Darrell Frasier
Teacher Work Sample-Darrell FrasierDarrell Frasier
 
Intro to RTI
Intro to RTIIntro to RTI
Intro to RTIkkysar
 
CHAPTER  11Standards, Curriculum, and AccountabilityTeacher 
CHAPTER  11Standards, Curriculum, and AccountabilityTeacher CHAPTER  11Standards, Curriculum, and AccountabilityTeacher 
CHAPTER  11Standards, Curriculum, and AccountabilityTeacher JinElias52
 
Youth truth, valerie threlfall
Youth truth, valerie threlfallYouth truth, valerie threlfall
Youth truth, valerie threlfallNAFCareerAcads
 
2009 Wsu Intern Presentation
2009 Wsu Intern Presentation2009 Wsu Intern Presentation
2009 Wsu Intern PresentationWSU Cougars
 
Claughton Middle School Breakthrough School Article
Claughton Middle School Breakthrough School ArticleClaughton Middle School Breakthrough School Article
Claughton Middle School Breakthrough School Articledelicl
 
Fusion Academy Community Meeting 10 26 09 D 1
Fusion Academy Community Meeting 10 26 09 D 1Fusion Academy Community Meeting 10 26 09 D 1
Fusion Academy Community Meeting 10 26 09 D 1mrosegilman
 
Philosophy of Education
Philosophy of EducationPhilosophy of Education
Philosophy of Educationsarahcsreardon
 
The interview final2
The interview final2The interview final2
The interview final2faneliabaskin
 
C Nofo Action Research Pt 2 2009
C Nofo Action Research Pt 2 2009C Nofo Action Research Pt 2 2009
C Nofo Action Research Pt 2 2009guest3f82a4
 
EnvisionPrep Academy
EnvisionPrep AcademyEnvisionPrep Academy
EnvisionPrep Academyjuchunc
 
spec-item1-Slides.pptx
spec-item1-Slides.pptxspec-item1-Slides.pptx
spec-item1-Slides.pptxAldrinApon2
 

Similar to 1st Grade Social Studies Mastery at 79 (20)

Closing the achievement gap
Closing the achievement gapClosing the achievement gap
Closing the achievement gap
 
Closing the achievement gap
Closing the achievement gapClosing the achievement gap
Closing the achievement gap
 
Teacher Work Sample-Darrell Frasier
Teacher Work Sample-Darrell FrasierTeacher Work Sample-Darrell Frasier
Teacher Work Sample-Darrell Frasier
 
Intro to RTI
Intro to RTIIntro to RTI
Intro to RTI
 
Mostaq`S Portfolio
Mostaq`S  PortfolioMostaq`S  Portfolio
Mostaq`S Portfolio
 
CHAPTER  11Standards, Curriculum, and AccountabilityTeacher 
CHAPTER  11Standards, Curriculum, and AccountabilityTeacher CHAPTER  11Standards, Curriculum, and AccountabilityTeacher 
CHAPTER  11Standards, Curriculum, and AccountabilityTeacher 
 
Sample kesselus
Sample kesselusSample kesselus
Sample kesselus
 
Youth truth, valerie threlfall
Youth truth, valerie threlfallYouth truth, valerie threlfall
Youth truth, valerie threlfall
 
2009 Wsu Intern Presentation
2009 Wsu Intern Presentation2009 Wsu Intern Presentation
2009 Wsu Intern Presentation
 
Portfolio
PortfolioPortfolio
Portfolio
 
Claughton Middle School Breakthrough School Article
Claughton Middle School Breakthrough School ArticleClaughton Middle School Breakthrough School Article
Claughton Middle School Breakthrough School Article
 
Fusion Academy Community Meeting 10 26 09 D 1
Fusion Academy Community Meeting 10 26 09 D 1Fusion Academy Community Meeting 10 26 09 D 1
Fusion Academy Community Meeting 10 26 09 D 1
 
Philosophy of Education
Philosophy of EducationPhilosophy of Education
Philosophy of Education
 
The interview final2
The interview final2The interview final2
The interview final2
 
The interview final
The interview finalThe interview final
The interview final
 
C Nofo Action Research Pt 2 2009
C Nofo Action Research Pt 2 2009C Nofo Action Research Pt 2 2009
C Nofo Action Research Pt 2 2009
 
Portfolio showcase
Portfolio showcasePortfolio showcase
Portfolio showcase
 
EnvisionPrep Academy
EnvisionPrep AcademyEnvisionPrep Academy
EnvisionPrep Academy
 
spec-item1-Slides.pptx
spec-item1-Slides.pptxspec-item1-Slides.pptx
spec-item1-Slides.pptx
 
SABStudent Training.pptx
SABStudent Training.pptxSABStudent Training.pptx
SABStudent Training.pptx
 

1st Grade Social Studies Mastery at 79

  • 1. Mouhamadou R. Diaman TFOA: Professional Preparatory Charter School, Grade 1 1 Proficient Data Narrative-Standard Mastery Teaching Context I am a 1st Grade teacher at Professional Prep Charter School in Bedford- Stuyvesant, Brooklyn New York. The population of Bedford Stuyvesant consists of 332,555 people. According to nyc.gov “64% of residents in Bedford-Stuyvesant are black, 20% Hispanic, 11% White, 2% Asian and 2% others.” (2016). One in three residents of Bedford Stuyvesant lives below the federal poverty level and Bedford Stuyvesant is considered one of the eight-poorest neighborhoods in New York City. 100% of my students (20 out of 20) are eligible for free lunch. Part of our school model, all of the teachers must live in Bedford Stuyvesant, and I love the fact that when I am shopping in the grocery store I get to see my students in the neighborhood. It is solely the main reason why in our school we call each other brothers and sisters because TFOA is actually a family both in school and outside of the classroom. Professional Prep Charter School is a K- 5th grade school with 382 students. Recently, the school was approved to expand to 6th grade for the school year 2016-2017. 50.79% of the students are male and 49.21% of the students are female. 83.25% of the students are black, 15.97% are Latino, .26%Asian, White .52%. 366 students out of the 382 live in Brooklyn, New York. I am an inclusion teacher, meaning that my co-teacher and I are the primary classroom teachers. We teach our students throughout the day. My young scholars receive movement twice a week, they received soccer twice a week and they have “Kuumba” (Arts) four-times a week. In addition, the students take Spanish four-times a week. My co-teacher and I are responsible for the students’ day-to-day learning and mastery of contents. We have worked very hard to make sure that we are creating a classroom environment that foster learning and most importantly attending to the little things with love. We supported our students academically and socially. We take classroom trips and explore content areas through museums, through music, and community walks because we want learning in the classroom to be relevant to them. The demographic of our 1st grade class fairly represent the Bedford Stuyvesant community and the Professional Prep Charter School’s community at large. 75% of my students are African American (15 out of 20 students), 3 out of the 15 students (20%) visits Jamaica periodically because some of their family members live there. 15% of my students (3 out 20) are Africans, 5% of my student (s) from Mexico (1 out 20) and 5% Puerto Rican. One of the most amazing features of our classroom is that 90% (18 out 20) of my students have a sibling that is attending Professional Prep Charter School in one of the grades from K-5. This makes professional prep unique and demonstrates the core
  • 2. 2 value of family. In the classroom I promote this idea of family to my students and how we are connected as one because the truth of the matter is that we are a family. I understand that many of my students have stressful lives and they live in imperfect situations in which they are not in control of at times. However, their situations do not define who they are and I want to help shape students who are resilient and who do give up when they face setbacks. I find first grade to be a very pivotal year for all children because it is a stage they acquire foundational knowledge in academics and character education. An Article titled “ How Kids Learn Resilience” by Paul Tough states “executive functions, which include working memory, attention control, and cognitive flexibility, are exceptionally helpful in navigating unfamiliar situations and processing new information…” These findings and my school’s dedication to serve the needs of our students helped me create a classroom environment that is catering to the needs of the students. In my classroom, I make sure the students are exploring the content through multiple modalities and creating opportunities for them to strengthen their executive functioning skills. I think that teaching my students about resilience and practicing situation that involves resilience to solve a particular issue sets them up for success. They are learning that setbacks are setups for comebacks. This process teaches them problem solving, love, and be willing to seat and solve problems peacefully through different modalities. ________________________________________________________________________ Data Analysis for All Students Students’ learning, relative to the Achievement Floor and Ambitious Goal: My sphere of influence represents the greatest area of impact that I have spent most time teaching in the classroom. I selected, Social Studies standard mastery as my area of focus. I measured 11 standards from the Common Core state Standards (CCSS) for 1st grade in social studies. These set of standards represent the skills and knowledge necessary in order for a student to gain mastery of the content and advancement to the next grade. The instructional scope in my classroom is designed to make sure that all students demonstrate mastery on the 11 specific common core standards. So based on these specific standards I could measure student growth based on what I have taught in the classroom. Throughout the year, I administered four period assessments that are aligned to the common core social studies standards selected. I average the result of each interim assessment and the results across all standards for all students to establish overall standards mastery for the class. Martin Luther King Jr. is quoted saying “the function of education is to teach one to think intensively and to think critically. Intelligence plus character-that is the goal of true education.” This was something that both my co-teacher and I were aiming for the students. We have morning affirmations and we talk about what it means to be a critical
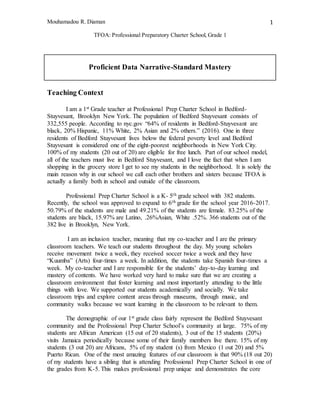
  • 3. Mouhamadou R. Diaman TFOA: Professional Preparatory Charter School, Grade 1 3 thinker and why does having character matter in sharing the space with others in the classroom? It was a classroom understanding, to work hard and share the classroom environment with one another. We want to cultivate students who are not only producing academically but students who embody the attributes of confidence, inquiry, fairness, focus, reflection, and being able to empathize with their brothers and sisters in the classroom environment. Through this process of measuring student achievement, the expectation is to measure the whole class “Ambitious Goal” to be 80% and an “Achievement floor,” for 70% class average, which is the minimum. So, the aim is to have an ambitious standard mastery goal of 80% per student and whole class. For social studies, the whole class Achievement Floor was set at 70% and the ambitious goal was set at a standard mastery of 80% in social studies. Overall for social studies we met the Achievement Floor of 70% average standard mastery, but we didn’t meet the ambitious goal of 80%. Our overall standard mastery across the social studies standards across First Grade CCSS-Mastery was 79%. All the students’ academic achievement, displayed relative to the Floor and Goal The performance groupings for social studies standards mastery relative to the floor and the goal can be seen in the graph below (figure 1.2). Figure 1.2- demonstrates the Overall Standards Mastery Achievement, Relative to the Floor and Goal. 12 8 3 0 2 4 6 8 10 12 14 80%+ Ambitious Goal 70% to<80% Floor, No Goal <70% No Floor NumberofStudents Goal Groupings Yearlong Social Studies Standards Mastery,Relative to Goal
  • 4. 4 For Social Studies Standards Mastery, 3 students failed to achieve 70% floor average standards mastery, 12 students achieved 80% average standards mastery of the ambitious goal, 8 students achieved the floor goal not the ambitious goal. The two students out of the three students, who have not achieved standard mastery, are students with speech and language impairment. Distribution of academic performance for all students: The performance distribution for individual students in social studies mastery can be seen in the graphic that follows (figure 1.4). Figure 1.4-Distribution of individual students’ Social Studies Standards Mastery Achievement. The range for student performance in social studies standards mastery was not what I have anticipated. I anticipated that all my students would be meeting at least the 70% average standard mastery; however, that was not the case. The lowest student score was 44% average standards mastery. The student was 26 points away from the floor goal and 36 points away from the ambitious goal. The highest score achieved with the four interim assessments was 97% standards mastery. Disaggregate Analysis: For this analysis, it allowed me to explore and investigate trends within the data. The exploration allows me to show an illustration of the overall standards mastery across all the assessments. Through the investigation, I decided to make a comparative data representation between the girls and the boys within the classroom across all the four assessments. I have 11 girls (n = 11) in my classroom and 12 boys (n = 12) in my classroom. The girls outperformed the boys by 8 points. 10% 20% 30% 40% 50% 60% 70% 80% 90% 100% MS KC PT CM SB NH DV TB FA MW MC Jo KM SP ZC IM DR JS SD MB HN FS CS AverageStandardsMastery Student Initials Yearlong Social Studies Mastery,By Student
  • 5. Mouhamadou R. Diaman TFOA: Professional Preparatory Charter School, Grade 1 5 Gender Comparison Gender Overall Average Social StudiesStandard Mastery F 83% M 75% Overall Average 79% Table 1.2 –Girls vs. Boys, Overall Average Math Standards Mastery Figure 1.6 below illustrates the aggregate information contained in table 1.4 above. Average standards mastery percentages are demonstrated for each student, separating boys and girls by blue and red bars in respective bars represented within the graph. Figure 1.6- Girls vs. Boys, Overall Average Social Studies Standards Mastery,Student-by- Student The distribution of boys and girls performance across the social studies standards mastery looks fairly close in comparison. The categories are organized from the highest performing student to the lowest performing student within all four interim assessments. The graph has demonstrated that the highest performing scholar in the classroom is a boy and the lowest performing student in the classroom is a boy as well. For the overall assessment data for the year, there is a noteworthy difference among the three boys in comparisons to the performance of all the girls in the classroom. 0% 10% 20% 30% 40% 50% 60% 70% 80% 90% 100% OverallStandardsMastery Student Initials Overall Standards Mastery by Gender Female Male
  • 6. 6 It is pivotal to understand that the scores above in figure 1.6 are averages of students’ overall standards mastery. The overall overage was retrieved from the four interim assessments taken by the students throughout the whole year measuring the 11 social studies standards. Figure 1.4 shows the distribution of performance for boys versus girls across all the interim assessments. The graphs demonstrate the average among all the students. However, the depiction of the graphs do not give you an overall understanding to which specific standards were mastered by each respective student nor the skills or concepts necessary to gain mastery of the specific standards. Figure 1.7- Girls vs. Boys, Midterm, Student by Student **Midterm score average represents pure assessment average, not standard mastery. (Attention: first 12 students listed from left to right are female and the remaining 11 students are male). A glance at figure 1.7 demonstrates a steadiness of performance in all interim assessments between boys and girls. The overall standard mastery average among the boys and girls was a performance difference of 8 points. Graph 1.2 demonstrates such difference between the girls and the boys. Furthermore, the girls’ performance in all the interim assessments met the ambitious goal of achievement; however, the boys’ total average of all assessments met the floor goal (70% less than 80%) not the ambitious goal of 80%. The highest performer in interim assessment #1 was a tie between 3 students 0% 10% 20% 30% 40% 50% 60% 70% 80% 90% 100% SB ZC SD NH KM HN SP JS FS DV MW FA MB TB KC CM IM DR CS MS PT JW MC Score Student Intials Assessment Level by Student Groupedby Gender Assessment 1 Assessment 2 Assessment 3 Assessemnt 4 Linear (Assessment 1) Linear (Assessment 2) Linear (Assessment 3)
  • 7. Mouhamadou R. Diaman TFOA: Professional Preparatory Charter School, Grade 1 7 and 2/3 of the top performers are girls. In interim assessment #2 it was a tie between a girl and a boy and in assessment #3 it was the same outcome. However, in assessment #4 there were 3 girls that scored a perfect score on the assessment but no boys received a perfect score in the assessment. In all 4 interim assessments a boy earned the lowest score. From a year standpoint, the girls performed at a higher rate than the boys in the classroom. Due to the rigor of the assessments and the thinking skills needed to master the exams a student had to be reading at DRA level 20; however, some of my boys were lacking the reading skills necessary to master the content because they had to read text and answer questions without guidance. However, all the students demonstrated resilience and produced their best in all interim assessments. Descriptive Statistic comparison Boys vs. Girls Standards Mastery Girls Standard Mastery Boys Standard Mastery Scores Student Name Standard Mastery Shannon B. 74 Zaina C. 82 Sanii D. 89 Nyla H. 75 Kyleah M. 83 Hadidja N. 91 Saniyah P. 83 Jaslene S. 88 Fatoumata S. 93 Diana V. 82 Madison W. 76 Girls Boys Mean: 83% Mean: 75% Median: 83 Median: 78% Mode: 82 and 83 Mode: 77 and 79 N: 11 N: 12 Range: 19 Range: 53 Based on the descriptive statistical data the girls performed better. Not only that the girls have a higher average of standards mastery, but the range of performance among the girls’ scores are lot lower in comparison to the boys. The scores from the girls are less scattered in comparison to the boys. My perspective on these whole-class results: Student Name Standard Mastery Fred A. 77 Mory B. 89 Tavier B. 77 Kareem C. 44 Christopher M. 74 Isaiah M. 85 Devon R. 88 Cayden S. 97 Mekehi S. 47 Paul T. 68 Jaydin W. 79 Makonene 79
  • 8. 8 In totally, my young scholars have met the Achievement Floor (70% < 80%) in the standards mastery pathway. The students were one point shy to meet the ambitious goal of 80%. I believe as a class they are well prepared to perform in the next upcoming grade and be able to demonstrate their understanding of the content they have learned with me. The data has illustrated amazing growth and performance from many students; however, it provided a clear picture in areas where I could improve in teaching my students and giving them more at bat in specific skills for the young scholars to gain mastery. In addition, the data gave me an opportunity to reflect on my practice and how to best serve the young scholars in the future. I feel satisfied with the results and growth the students have demonstrated; however, 3 students missed to make the 70% floor achievement and 8 students have met floor achievement but not the ambitious goal of 80% and above. The students and I were striving for 80% performance and above for the year; however, we came a bit short. 20/23 students have demonstrated a proficiency of 70% or greater in their overall average of all 4 interim assessments. I am going to have the same first graders in second grade and I am looking forward to having the same students again and tailoring instruction to their needs to meet mastery within the content area. I am excited for the upcoming year, as I know they are prepared for the next grade in the content area. Data Analysis for CharacterResults Character Measure: I want my students to perform magnificently academically and I also want them to have a love for learning. I want them to become curious, and question the things they are learning in the classroom because it allows exploration and investigation of the content. I want to cultivate students who are agents of their own learning and making choices that are fair not only to themselves but choices that demonstrate fairness to them and their greater community. I want scholars who are going to be analyzing every data they come across and make critical, fair choices that benefit the greater good. I remember when I was in college my professor used to quote Sriniasan Sririam from India by stating: “a teacher’s purpose is not to create students in his own image, but to develop students who can create their own image.” I want my students to appeal upon this idea of love to help them through setbacks and to solve academic challenges and the way they communicate with others in the community. So, in order for them to be able to apply such concept of love with the things or situation they encounter I had explicit lessons teaching how it looks, sound, feel, taste, and so on...
  • 9. Mouhamadou R. Diaman TFOA: Professional Preparatory Charter School, Grade 1 9 Character Results Analysis Mastery-Based Results In the final (fourth) round of data collection, across all the indicator evaluations for teacher and student, the average score was 3.88. For the teacher evaluations, the indicator average was 4.06; for student evaluations, the indicator average was 3.71. 1.11 below displays the average scores by individual indicator, disaggregated by the type of evaluation (student vs. teacher). Strength Figure 1.11- Average Score by Individual Indicator, based on Final Round The final average indicator score demonstrate that there is a gap in scoring between student scores and teacher scores in the evaluation process. However, the students remained consistent on how they evaluated their demonstration of care for others, self and recognizing and appreciating others strengths in the classroom. In figure 1.1-Average score by individual indicator, based on final round, reveals that the student evaluation of each indicator received a total score of 3.7 out of 5. The students were more critical in scoring their demonstration of the indicators/actions. Some of the students who demonstrated the indicators of love tend to evaluate themselves lower and the ones who may need some work in certain indicators tend to evaluate themselves a little higher. But, I do see a sense of awareness among the students in regards to their demonstration of the indicators and how they can align their actions with the specific 1 1.5 2 2.5 3 3.5 4 4.5 Demonstrates care for others Demonstrates care for self Recognizes and appreciate others strengths outof(5points Average Final Indicator Score Student Teacher
  • 10. 10 indicators in the classroom. (Look at figure 1.12- to see the evolution of students’ awareness of the indicators and how they started evaluating themselves). Figure 1.12- students evaluation of the indicators Round 1-3 Figure 1.12 shows the greatest difference of student evaluation from round #1 to round #3. With the student evaluation of demonstrating care for others there is .34 scoring difference between round #1 and #2. However, there is a 0.2 difference from the average of round #2 and round #3. This demonstrates an evolution of the students understanding of what this indicator means and how it looks, and feels when it is put into action. Character Result Storyline: How did you build this strength with your students across the year? At the beginning of the year, some of my students did not demonstrate a lot of care for their schoolhouse and the way they interacted with each other as classmates was a bit disconnecting. However, there were few students who embodied the indicators of love which are demonstrating care for others, demonstrating care for self, and recognizes and appreciate others’ strength. I usually modeled the indicators of love and made students aware of their actions when they demonstrate indicators of love as well. Everyday after breakfast, the students will write their goals on how they are going to demonstrate the indicators of love throughout the day. At the end of the day, all the students will share whether they have met their goals or not. If a student has not met his goal, he has the opportunity to share with the class the next steps needed to accomplish his specific goal. And sometimes the specific student could ask classmates to share some positive steps he could take to accomplish his goal. This reflective process on a daily basis helped the students to continuously reflect on their ability to demonstrate the Average Round 1 Average Round 2 Average Round 3 Student Evaluation 3.64 3.3 3.5 3.64 3.3 3.5 3.1 3.2 3.3 3.4 3.5 3.6 3.7 outof5points Demonstrates Care for Others
  • 11. Mouhamadou R. Diaman TFOA: Professional Preparatory Charter School, Grade 1 11 indicators of love and become mindful of the choices they are making in and outside of the classroom. I started teaching a series of character lessons about love through Nelson Mandela, Martin Luther King Jr., and Ruby Bridges. The students learned about Mandela’s desire to fight for human rights and Martin Luther King’s love for his people and through non-violence marched for equality, justice, and peace. Furthermore, we explore Ruby Bridges love for learning. Our classroom is named after Mahatma Gandhi so we explored how do the indicators match with Gandhi’s actions. This is our daily affirmation of self: I love myself I love my self I love my face I love my face I love my nose I love my nose I love my lips I love my lips I love my ears I love my ears I love my hair I love my hair I love my brain I love my brain And I love my skin And I love you!! The affirmation, the lessons and learning about leaders who have demonstrated the indicators of love have helped and shaped my classroom to the right direction to become a community. Are these results reflective of your teacher actions? Overall my students grew in all indicators and most importantly they are able to associate the indicators of love with their actions. So with their abilities to recall the indicators of love it allows them to become mindful with their interactions with others. The positive change from start of the year to the end of the year was that students started using the language during their reflection. If another student is not depicting the indicators of love other students remind such specific student if his actions demonstrate the indicators of love? The students have grew in their demonstration of demonstrate care for self. The round 3-students’ evaluation was 3.61 and round 4 student evaluation of the same indicator was 4.09. The teacher’s evaluation average for round 3 was 4.04 and round 4
  • 12. 12 teacher’s evaluation average was 4.09. One could see that there is not much of a difference between the teacher’s evaluation in comparison to the student evaluation and this is due to the intentional teaching of character education in the classroom. The students became more aware of the indicators. In regards to the manifestation of the specific showing of care for others the students’ evaluation average was 3.70 and the teacher’s evaluation average was 3.95 out of 5 points. The point’s difference between the teacher scoring average and the students was .25. Beside the evaluation of the first round average the students have been very reflective through the evaluation process of how they are demonstrating the specific indicators. Many of the students during their reflection time spoke about taking responsibility and being more honest with themselves with their depictions of the indicators of love. I think that during AM and PM seminars, it revealed the honesty and the commitment the students maintained through the process. For many students differentiating between demonstrating care for self and demonstrate care for others was a tough concept to grasp. The core idea of demonstrating love is that one has to make a choice based on all the three indicators; however, at the beginning some students were focusing on only how to show care for self and ignoring the other two indicators. Due to such circumstances, I had a lesson in exploring the misconceptions of love. For instance I will ask the students, am I showing the actions of love if I care for self and do not demonstrate the other actions of love? Please explain. The students were able to partner up, share their understanding and debate each other. Students get to share their response with the class and through inquiry and exploring their misconceptions they come to an understanding of what it means to demonstrate love. In addition, I shared a quote from Dalai Lama and it states “the best way to resolve any problem in the human world is for all sides to sit down and talk.” This was a powerful lesson because it allowed students opportunities to talk to their peers in a loving manner on things they have done to them and solve those issues in a peaceful manner. I gave them sentence starters like: When you laugh at me, I feel___________. The sentences starters allowed the students to explore their feelings and be able to open up to each other. In return, the activity brought the students closer to each other and understanding they have more in common. _______________________________________________
  • 13. Mouhamadou R. Diaman TFOA: Professional Preparatory Charter School, Grade 1 13 Next Steps from Analyses of Academic and Character Data Action step #1 (from academic analyses): Overall, many of my students have reached the achievement floor (70)% and some has achieved the ambitious goal (80%). The students have obtained knowledge and skills necessary to demonstrate their level of mastery to the next grade. However, I have three young scholars who have not met the floor goal or the ambitious goal. (See figure 1.2- demonstrates the Overall Standards Mastery Achievement, Relative to the Floor and Goal. And Figure 1.4-Distribution of individual students’ Social Studies Standards Mastery Achievement.) Based on my analysis it illustrated that the students need more at bat answering open-ended questions and questions regarding main idea. However, the underline issue was that the three students were reading below grade level. I have created opportunities to work with them and used strategies from TEL-301: interventions for struggling readers for them to have more at bat using different strategies when they come across unknown words. Furthermore, I should have collaborated and consulted with other teachers within the school because that could have benefited the students progression in the classroom. I could have applied my understanding of SOP-312: Collaboration and Consultation with Colleagues to collaborate with special education teachers to help differentiate the work for those three specific students in the classroom. Many of my students were able to meet the achievement floor and the ambitious goal because it required me to analyze each quarter’s data. The process allowed me to see trends among the type of questions they are able to answer and the type of question the class needs more exposure. The data analysis’ investigation from each quarter painted a vivid picture on concepts and skills students need to master. I have intentionally used TC-311 principles of Specialized Instruction to further push my students in the classroom by teaching to mastery with daily assessments, checking for understanding, increase individualized practice with the social studies concepts and creating opportunities for students to experience what they are learning through classroom trips and demonstrating their understanding through exploration. For instance, when they were learning about needs and wants I set up a classroom shop and students had $10 to go shopping in the classroom market. They had to identify what they bought if it was a need or a want and explore if their choice of certain items will help them with their survival. This way of teaching my students and exploring the content was inspired by TC-210: Unit planning because I was able to plan by the Understanding By Design framework to create key learning experiences for the students. Another module assessment that inspired my teaching was SOP-216: Working With Communities. “Community is a word rich in meaning; it can describe both a group of people who live within certain boundaries (i.e., a neighborhood) and those who share
  • 14. 14 experiences, practices, interests, or beliefs.” (Relay SOP-216, 2016). We were able to take community walks and engage with community gardens to understanding why do they have gardens in the community. The students became aware of their communities and the resource in the Bedford Stuyvesant community has to offer. I have differentiated work in different levels for my students and pushing their thinking. However, I should have utilized more of the strategies of TEL-320: Teaching Gifted Learners to further push the performance of some of my scholars who were performing above grade level both in social studies concepts, skills and reading level as well. I am fortunate that I am going to have the same students next year who have demonstrated mastery of the social studies concepts and skills. Going forward next year, I have data that will help me with my planning phase for next year to elevate student performance. Action Step #2 (from character analysis) When I used to coach soccer, I used to teach character education to children before I enter the education system. However, this character growth data collection at Relay taught me in order to be effective in measuring character there has to be a sense of understanding from both parties what is being measured and how one is going to be measured. I enjoyed seeing my students evaluating themselves and seeing where they stand in demonstrating the indicators of love. It allow me to see the students reflect on their actions and wondering if their actions matched with the indicators of love. I had some great scholars who I think exemplify and express the indicators of love; however, when it came to evaluating themselves they were so harsh on themselves in the evaluation process. However, it also allowed me opportunities for me to speak to those students and see their thinking process when they were evaluating themselves. I had one student who is such a great example in the classroom and demonstrate all the indicators of love proficiently. But, he usually rates himself low during evaluation. So, I asked him why he evaluates himself so low and he said, “because at home I don’t listen to my parents but in school I follow all the directions.” This allowed me to give him a journal in which he writes down how he has demonstrated the indicators of love at home. This reflection process helped him a lot and I was surprised his mother called me telling me she started to see change on how her son is interacting with her. So moving forward next year, I am going to be pushing my parents to be part of the parent evaluation process because I saw it shape the relationship between a parent and her son. I had frequent meaningful conversations with my students in the classroom regarding demonstration of the indicators of love; however, next year I want to be able to bring in guest speakers who demonstrate these specific indicators and how those indicators help them through their profession, interactions with others, and how such indicators are helping them change the world. Or, I could invite different staff members and teachers within the school community to have a “TEDTALK” on how showing the
  • 15. Mouhamadou R. Diaman TFOA: Professional Preparatory Charter School, Grade 1 15 indicators of love through their line of work help them become better individuals and workers. According to a document titled “A Brief History of Character Education in America,” it states, “the present and future well-being of our society requires an involved, caring citizenry with good moral character…. people do not automatically develop good moral character; therefore, conscientious efforts must be made to help young people develop the values and abilities necessary for moral decision making and conduct.” (U.S News & World Report, 1996). I have the knowledge and systems in place to now intentionally measure character growth and help student reflect on this process of metamorphosing into leaders who demonstrate love, peace, and being critical contributors of their respective communities. ________________________________________________________________________ Final suggested Action Step (Character Growth) At professional Prep Charter School the teachers and parents fill out an executive functioning skills questionnaires. These questionnaires allow the teacher and the parents to gather information on the child’s strength and weaknesses. This information allows the teachers to plan and intentionally strengthen the deficient areas of the child and continuously strengthening the student’s area of strength as well. The executive function skills are: Self awareness of strength and limitations, goal setting, planning/organization, initiating, inhibiting, self monitoring and evaluation, strategic thinking, flexible shifting, adjusting, benefiting from feedback.” (Feeney, 2005). While I was collecting data on students who were demonstrating the indicators of love I realized students who lack the ability to independently start an action or an activity (initiation) tend to not demonstrate the indicators of love. In addition, mental flexibility is defined as the ability to easily shift from one idea, train of thought, activity or way of looking at things. (Guare & Dawson, 2013). I realized students who lack the ability to be flexible in thinking it was very difficult for them to compromise with others at times or shifting from one thing to another. Therefore, the lack of flexibility in thinking hindered those students to solve problems peacefully because they only have one way of looking at a situation. So, it becomes difficult for those young scholars to demonstrate care for others when things are not going their way or frame of thinking. All the executive functioning skills are connected; however, my students focused on goal setting and planning. According to Hotchkiss, loving and Carson from the Exceptional Student Services Unit of Colorado Department of Education, “planning is the ability to set a goal, identify a sequence of actions to reach the goal and carry out that sequence of steps.” (2015). The process requires ways to solve problems and how they
  • 16. 16 are going to solve problems when they face it. Due to such process and intentional character lessons it helped many of the students to start solving matters peacefully.
  • 17. Mouhamadou R. Diaman TFOA: Professional Preparatory Charter School, Grade 1 17 References Tough, Paul. (2016). How Kids Learn Resilience. The Atlantic. Retrieved June 2016. From http://www.theatlantic.com/magazine/archive/2016/06/how-kids-really- succeed/480744/ Brooklyn Community District 3: Bedford Stuyvesant. (2015) Retrieved June 2nd, 2016. From https://www1.nyc.gov/assets/doh/downloads/pdf/data/2015chp-bk3.pdf >. P.2 “A brief history of Character Education in America.” (1996). U.S News and World Report. Retrieved June 11th, 2016. <http://www.waarden.org/studie/concepten/history.html>. P.3-4. Guare, Richard, and Peg Dawson. Smart but Scattered Teens: The Executive Skills Program for Helping Teens Reach Their Potential. (2013). New York: Guilford. Print. http://www.guilford.com/guare-forms Hotchkiss, Heather, and Loving, Kate, et.al. Building Executive Function Skills. Exceptional Student Services Unit of Colorado Department of Education. (2015). Retrieved June, 15th. https://www.cde.state.co.us/facilityschools/facschoolsspringregtraining2015_exec funcppt>. P-14