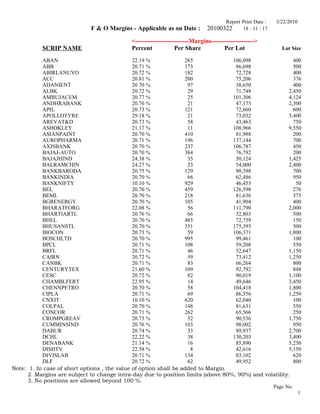
Moneysukh Margin level report 22/3/2010
•Download as DOC, PDF•
0 likes•48 views

The Report contains information about the margin levels

Recommended
Recommended
More Related Content
What's hot
What's hot (20)
Viewers also liked
Viewers also liked (6)
Similar to Moneysukh Margin level report 22/3/2010
Similar to Moneysukh Margin level report 22/3/2010 (20)
More from Mansukh Investment & Trading Solutions
More from Mansukh Investment & Trading Solutions (20)
Moneysukh Margin level report 22/3/2010
- 1. Report Print Date : 3/22/2010 F & O Margins - Applicable as on Date : 20100322 18 : 11 : 17 <-------------------------Margins--------------------> SCRIP NAME Percent Per Share Per Lot Lot Size ABAN 22.19 % 265 106,098 400 ABB 20.71 % 173 86,698 500 ABIRLANUVO 20.72 % 182 72,728 400 ACC 20.81 % 200 75,206 376 ADANIENT 20.70 % 97 38,650 400 ALBK 20.72 % 29 71,748 2,450 AMBUJACEM 20.77 % 25 101,306 4,124 ANDHRABANK 20.76 % 21 47,173 2,300 APIL 20.73 % 121 72,660 600 APOLLOTYRE 29.18 % 21 73,032 3,400 AREVAT&D 20.73 % 58 43,463 750 ASHOKLEY 21.17 % 11 108,966 9,550 ASIANPAINT 20.70 % 410 81,988 200 AUROPHARMA 20.71 % 196 137,144 700 AXISBANK 20.70 % 237 106,787 450 BAJAJ-AUTO 20.70 % 384 76,792 200 BAJAJHIND 24.38 % 35 50,124 1,425 BALRAMCHIN 24.27 % 23 54,000 2,400 BANKBARODA 20.75 % 129 90,398 700 BANKINDIA 20.70 % 66 62,486 950 BANKNIFTY 10.10 % 929 46,453 50 BEL 20.70 % 459 126,598 276 BEML 20.70 % 218 81,636 375 BGRENERGY 20.70 % 105 41,904 400 BHARATFORG 22.08 % 56 111,790 2,000 BHARTIARTL 20.76 % 66 32,803 500 BHEL 20.70 % 485 72,759 150 BHUSANSTL 20.70 % 351 175,393 500 BIOCON 20.73 % 59 106,371 1,800 BOSCHLTD 20.70 % 995 99,461 100 BPCL 20.71 % 108 59,208 550 BRFL 20.71 % 46 52,647 1,150 CAIRN 20.72 % 59 73,412 1,250 CANBK 20.71 % 83 66,264 800 CENTURYTEX 21.60 % 109 92,792 848 CESC 20.72 % 82 90,019 1,100 CHAMBLFERT 22.95 % 14 49,646 3,450 CHENNPETRO 20.70 % 58 104,418 1,800 CIPLA 20.71 % 69 86,556 1,250 CNXIT 10.10 % 620 62,040 100 COLPAL 20.70 % 148 81,631 550 CONCOR 20.71 % 262 65,566 250 CROMPGREAV 20.73 % 52 90,536 1,750 CUMMINSIND 20.76 % 103 98,002 950 DABUR 20.74 % 33 89,937 2,700 DCHL 22.22 % 38 130,203 3,400 DENABANK 21.14 % 16 85,890 5,250 DISHTV 22.58 % 8 42,616 5,150 DIVISLAB 20.71 % 134 83,102 620 DLF 20.72 % 62 49,952 800 Note: 1. In case of short options , the value of option shall be added to Margin. 2. Margins are subject to change intra-day due to position limits (above 80%, 90%) and volatility. 3. No positions are allowed beyond 100 %. Page No: 1
- 2. Report Print Date : 3/22/2010 F & O Margins - Applicable as on Date : 20100322 18 : 11 : 17 <-------------------------Margins--------------------> SCRIP NAME Percent Per Share Per Lot Lot Size DRREDDY 20.71 % 263 105,058 400 EDUCOMP 21.49 % 162 60,634 375 EKC 21.48 % 25 50,660 2,000 ESSAROIL 22.08 % 30 42,939 1,412 FEDERALBNK 20.74 % 53 45,154 851 FINANTECH 20.70 % 336 50,467 150 FORTIS 21.35 % 38 49,290 1,300 FSL 21.80 % 6 59,850 9,500 GAIL 20.71 % 85 95,333 1,125 GESHIP 20.72 % 59 70,722 1,200 GLAXO 20.70 % 361 108,381 300 GMRINFRA 20.85 % 12 29,888 2,500 GODREJIND 20.98 % 30 39,611 1,300 GRASIM 20.70 % 601 105,790 176 GSPL 20.80 % 18 109,617 6,100 GTL 20.73 % 85 63,521 750 GTLINFRA 20.88 % 9 41,977 4,850 GTOFFSHORE 20.70 % 87 86,530 1,000 GVKPIL 20.79 % 9 41,278 4,750 HCC 20.75 % 28 59,745 2,100 HCLTECH 20.70 % 77 99,626 1,300 HDFC 20.70 % 546 81,892 150 HDFCBANK 20.70 % 380 76,053 200 HDIL 22.53 % 64 49,246 774 HEROHONDA 20.70 % 403 80,631 200 HINDALCO 22.45 % 38 134,229 3,518 HINDPETRO 20.72 % 66 42,959 650 HINDUNILVR 20.73 % 47 47,275 1,000 HINDZINC 20.70 % 258 128,833 500 HOTELEELA 20.76 % 10 74,100 7,500 IBREALEST 26.03 % 39 50,765 1,300 ICICIBANK 20.70 % 194 67,839 350 ICSA 21.65 % 29 34,212 1,200 IDBI 20.70 % 24 57,288 2,400 IDEA 21.67 % 15 39,703 2,700 IDFC 20.72 % 34 99,504 2,950 IFCI 21.00 % 11 83,055 7,880 INDHOTEL 21.76 % 22 83,841 3,798 INDIACEM 20.77 % 27 39,259 1,450 INDIAINFO 21.95 % 26 64,025 2,500 INDIANB 20.76 % 34 75,768 2,200 INFOSYSTCH 20.70 % 572 114,366 200 IOB 20.75 % 18 54,265 2,950 IOC 20.73 % 62 74,640 1,200 ISPATIND 21.02 % 4 50,111 12,450 ITC 20.72 % 54 61,048 1,125 IVRCLINFRA 20.76 % 34 68,120 2,000 JINDALSAW 20.73 % 46 227,700 5,000 JINDALSTEL 20.71 % 142 136,315 960 JISLJALEQS 22.42 % 215 53,849 250 JPASSOCIAT 22.41 % 33 55,636 1,688 Note: 1. In case of short options , the value of option shall be added to Margin. 2. Margins are subject to change intra-day due to position limits (above 80%, 90%) and volatility. 3. No positions are allowed beyond 100 %. Page No: 1
- 3. Report Print Date : 3/22/2010 F & O Margins - Applicable as on Date : 20100322 18 : 11 : 17 <-------------------------Margins--------------------> SCRIP NAME Percent Per Share Per Lot Lot Size JPPOWER 20.70 % 14 43,641 3,125 JSWSTEEL 21.39 % 263 108,558 412 KFA 21.85 % 11 45,603 4,250 KOTAKBANK 20.71 % 155 85,014 550 KSOILS 20.86 % 14 82,954 5,900 LICHSGFIN 20.71 % 167 70,818 425 LITL 23.09 % 12 75,635 6,380 LT 20.71 % 335 67,005 200 LUPIN 20.72 % 341 119,292 350 M&M 21.72 % 228 71,089 312 MARUTI 20.70 % 290 57,934 200 MCDOWELL-N 20.71 % 278 69,475 250 MCLEODRUSS 22.54 % 58 52,389 900 MINIFTY 10.10 % 527 10,533 20 MLL 21.57 % 13 61,397 4,900 MOSERBAER 22.70 % 17 41,679 2,475 MPHASIS 20.70 % 138 110,340 800 MRPL 20.79 % 15 68,775 4,450 MTNL 20.75 % 15 48,912 3,200 MUNDRAPORT 20.71 % 151 45,216 300 NAGARCONST 20.76 % 33 65,400 2,000 NAGARFERT 20.91 % 7 34,309 5,250 NATIONALUM 20.82 % 83 47,498 575 NEYVELILIG 20.70 % 32 46,647 1,475 NIFTY 10.10 % 527 26,327 50 NOIDATOLL 20.80 % 7 58,589 8,200 NTPC 20.73 % 42 68,039 1,625 OFSS 20.70 % 478 143,358 300 ONGC 20.70 % 220 49,461 225 ONMOBILE 21.63 % 86 47,284 550 OPTOCIRCUI 20.73 % 46 93,299 2,040 ORCHIDCHEM 22.04 % 34 72,083 2,100 ORIENTBANK 22.44 % 66 79,446 1,200 PANTALOONR 20.73 % 80 67,698 850 PATELENG 20.72 % 92 92,470 1,000 PATNI 20.70 % 109 142,006 1,300 PETRONET 20.70 % 16 69,960 4,400 PFC 20.71 % 53 64,002 1,200 PIRHEALTH 20.71 % 85 128,010 1,500 PNB 20.70 % 198 59,252 300 POLARIS 22.12 % 38 106,610 2,800 POWERGRID 20.71 % 22 42,928 1,925 PRAJIND 20.78 % 17 38,302 2,200 PTC 20.75 % 23 54,614 2,350 PUNJLLOYD 20.75 % 37 55,185 1,500 RANBAXY 20.72 % 95 76,324 800 RCOM 20.71 % 36 24,857 700 RECLTD 20.77 % 52 101,078 1,950 RELCAPITAL 20.71 % 162 44,636 276 RELIANCE 20.71 % 222 66,698 300 RELINFRA 20.71 % 210 58,030 276 Note: 1. In case of short options , the value of option shall be added to Margin. 2. Margins are subject to change intra-day due to position limits (above 80%, 90%) and volatility. 3. No positions are allowed beyond 100 %. Page No: 1
- 4. Report Print Date : 3/22/2010 F & O Margins - Applicable as on Date : 20100322 18 : 11 : 17 <-------------------------Margins--------------------> SCRIP NAME Percent Per Share Per Lot Lot Size RELMEDIA 21.88 % 48 29,031 600 RENUKA 26.75 % 20 100,775 5,000 RNRL 20.81 % 13 46,256 3,576 ROLTA 20.73 % 37 66,978 1,800 RPOWER 20.76 % 30 59,220 2,000 SAIL 20.71 % 50 67,028 1,350 SBIN 20.71 % 423 55,794 132 SCI 20.72 % 33 78,156 2,400 SESAGOA 22.29 % 99 148,395 1,500 SIEMENS 20.71 % 151 113,898 752 SINTEX 20.73 % 57 79,772 1,400 STER 20.71 % 169 73,921 438 STERLINBIO 21.17 % 23 57,000 2,500 SUNPHARMA 20.71 % 354 79,702 225 SUNTV 22.49 % 94 93,515 1,000 SUZLON 22.45 % 16 49,335 3,000 SYNDIBANK 20.73 % 18 67,754 3,800 TATACHEM 20.72 % 64 86,879 1,350 TATACOMM 20.71 % 60 31,658 525 TATAMOTORS 23.53 % 179 151,895 850 TATAPOWER 20.70 % 277 55,369 200 TATASTEEL 20.91 % 131 100,447 764 TATATEA 20.73 % 197 108,523 550 TCS 20.71 % 172 171,650 1,000 TECHM 20.71 % 189 113,457 600 TITAN 20.70 % 372 76,611 206 TRIVENI 27.86 % 39 148,629 3,850 TTML 20.72 % 5 52,720 10,450 TULIP 20.71 % 180 89,998 500 TV-18 20.72 % 15 27,941 1,825 UCOBANK 20.78 % 12 58,025 5,000 ULTRACEMCO 20.72 % 233 93,056 400 UNIONBANK 20.75 % 57 59,971 1,050 UNIPHOS 20.72 % 32 45,059 1,400 UNITECH 20.94 % 15 67,365 4,500 VIDEOIND 20.70 % 47 40,091 854 VIJAYABANK 20.87 % 10 67,827 6,900 VOLTAS 20.78 % 37 98,699 2,700 WELGUJ 20.73 % 57 91,784 1,600 WIPRO 20.71 % 151 90,768 600 YESBANK 20.91 % 50 110,407 2,200 ZEEL 20.73 % 54 75,950 1,400 Note: 1. In case of short options , the value of option shall be added to Margin. 2. Margins are subject to change intra-day due to position limits (above 80%, 90%) and volatility. 3. No positions are allowed beyond 100 %. Page No: 1