Data Analysis: Putting Data Capital to Work
•
3 likes•832 views

This short deck explains the work of a modern data analyst. Putting data capital to work in the business enables decision quality & velocity, operating speed and growth

Recommended
Recommended
More Related Content
What's hot
What's hot (20)
Similar to Data Analysis: Putting Data Capital to Work
Similar to Data Analysis: Putting Data Capital to Work (20)
Recently uploaded
Recently uploaded (20)
Data Analysis: Putting Data Capital to Work
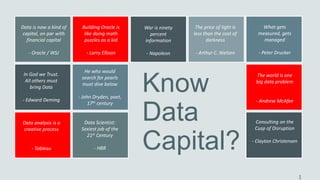
- 1. 1 Know Data Capital? What gets measured, gets managed - Peter Drucker The price of light is less than the cost of darkness - Arthur C. Nielsen War is ninety percent information - Napoleon In God we Trust. All others must bring Data - Edward Deming Building Oracle is like doing math puzzles as a kid - Larry Ellison He who would search for pearls must dive below - John Dryden, poet, 17th century Data Scientist: Sexiest job of the 21st Century - HBR Consulting on the Cusp of Disruption - Clayton Christensen Data is now a kind of capital, on par with financial capital - Oracle Data analysis is a creative process - Tableau The world is one big data problem - Andrew McAfee
- 2. Data Analysis Putting Data Capital to Work Mohit Mahendra Analyst / Strategist Oracle Corp Views are a professional point of view, synthesized from multiple sources.
- 3. Its All About Decisions 3 “…It is possible for executives—and companies— to significantly improve their chances of success by making one straightforward (albeit not simple) change: expanding their tool kit of decision support tools and understanding which tools work best for which decisions.” - Deciding How to Decide, HBR Reports Scorecards Dashboards Drill-down Decisions
- 4. Both Intuition and Analytics Matter For Big Decisions 4 Average value of future profitability of big decisions made by technology industry executives Tech executives relied on Data & Analytics Inputs the most for their last big decision 63% 53% Tech executives expect to make a big decision at least once per month. Just as many plan to revisit their most important decisions every 3-6 months. Tech executives have changed the way they approach big decision making as a result of Data & Analytics, over the last 24 months. Source: PwC’s Global Data & Analytics Survey 2014: Big Decisions $320M 43% 29% 28% Own Experience & Intuition Experience of others
- 5. What Are Big Decisions? 5 Source: PwC’s Global Data & Analytics Survey 2014: Big Decisions Top goals for big decisions, among Technology industry executives
- 6. What Does An Analyst Do? Oracle Confidential – Internal 6 1. Perspective – Data discovery and strategic business analysis 2. Impact – How effectively did a strategy work? Why or why not? 3. Projection – What will a strategy look like? 4. Recommendation - What strategy will work best? Analytics to Innovate, Differentiate and Compete
- 7. New Expectations of an Analyst 7 AGILE Decisions STRATEGIC FUELS INNOVATION CREATIVE DATASCIENTIST Problem Solver BUSINESS KNOWLEDGE DATA WRANGLER COMPETITIVE EDGE VISUAL&ARTISTIC OPTIMIZATION ANALYTIC SKILLS RESEARCHER ACADEMIC COMMUNICATION BIG PICTURE NUMBERS MATH LEARNING TOOLS EXPERIMENTS
- 8. Functional Tracks of Decision Science DATA TOOLS & SKILLS ANALYSIS & MODELS QUESTIONS DECISIONS STRATEGY SYSTEMS & INFRASTRUCTURE FASTER, BETTER SKILLS SCALE w/ LOWER COST SKILLS BETTER TOOLING CUSTOM TOOLING REUSABLE IP ANALYTICS SPEED / SCALE Business Value Productive Value ANSWERS
- 9. Business Intelligence has evolved Old Model New Model Reporting & Dashboards Back-Office / Tactical BI Systems of Record Low Adoption among Users Decisions needing Consistency IT-Centric Producers vs Consumers Waterfall Development One-stop Data Warehouse HIPPO Discovery, Exploration, Storytelling Business Competency / Strategic BI Systems of Innovation Ad-hoc, Self-serve BI Decisions needing Agility Business-Centric ‘Prosumers’ Rapid Time to Insight Data lakes / Fail fast, fail cheap analytic models Wisdom of Crowds
- 10. Key Competencies Product, Market & Industry Knowledge Data Modeling & Tool Skills Quant, Financial & Analytic Skills Market/ Fin Analyst BI Analyst Ops/ Business Analyst The Decision Science Venn Diagram, inspired by The Data Science Venn Diagram (2010) DECISION SCIENCE
- 11. Source: Business Intelligence: A Core Business Competency, Gartner 2014
- 12. • “Although art and analytics may seem different, there is a common thread: both are on a mission to reveal truth and impart meaning, both challenge their viewers to look at the world through a different lens, both rely on observation and curiosity and encourage creative problem-solving.” – Christian Chabot, Tableau Keynote • “Somebody will always have to open the can.” VS. Keeping Ahead: Man vs Machine • Computers • Dispassionate analysis • Data and statistics • Discipline and rigor • People • Passionate advocacy • Intuition • Creativity and insight Tableau Keynote
- 13. Thanks Email: mohit.mahendra@oracle.com Social: LinkedIn, Twitter, Quora, Pinterest