1. Over the previous several months, Unanimous A.I. has been asking the question: “What is a fair
price for a movie ticket?” A total of 11 unums have been collected. Of these 11, six of the
answers were either $6.25 or $6.50. A histogram of the data can be seen below.
8.07.57.06.56.05.55.0
6
5
4
3
2
1
0
Price
Frequency
Histogram of Price
The purpose of this article is to investigate how unum performs compared to questionnaires.
Does one tend to give more accurate answers? Is one more efficient when it comes to using
smaller sample sizes? In order to answer these questions, I decided to simulate the results of a
questionnaire. My first step was to construct a probability distribution which represented what an
individual thinks is a fair price for a movie ticket.
The probability distribution I designed was based off the data collected from the 11 unums. I
began with a normal distribution curve, treating each of the 11 unums as means. From my data, I
could use the same mean from my data ($6.34) and increase the standard deviation accordingly
(take the standard deviation from our data and multiply if by the square root of our sample size).
The resulting normal distribution ended up dipping a little bit too low for my liking (as low as
zero dollars), so I ended up using a gamma distribution slightly skewed to the right with a low
cutoff of $3 and a high cutoff around $11. The mean of the distribution was the same mean as the
aforementioned normal curve with roughly the same standard deviation. The purpose of all this
was to simulate questionnaires of roughly the same type of people who participated in the
unums. This way I can eliminate the confounding variable of a difference in people’s opinions
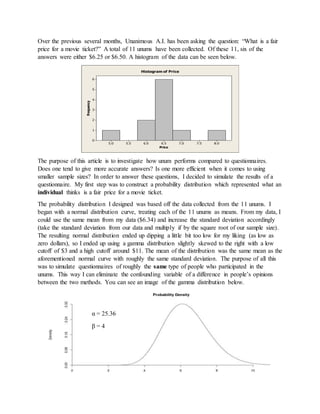
between the two methods. You can see an image of the gamma distribution below.
α = 25.36
β = 4
2. Now that we have our sampling distribution, we can begin simulating results from a
questionnaire and compare its performance to unum. When a questionnaire or unum gets
conducted, you want to obtain answers that give a good representation of the population as a
whole. A good way to measure this is by how close the average answer is to the population
average. In the real world, we never know the true population average. But in this example, we
actually do know our population average is $6.34 (our average of the probability distribution).
Unum answers for this question were on a scale of $0.25. So the two closest possible unum
answers to the population mean are $6.25 and $6.50. Of the 11 unums, 6 of them were either
$6.25 or $6.50. This means that 54.5% of the unums did an extremely good job of landing close
to the population mean. But remember, this is to be expected because we formed our population
distribution based off the data we collected in our unums! The important part is seeing how
unum compares to our simulated questionnaires using the same distribution.
In order to run to our simulation, we must consider that the probability distribution is on a
continuous scale, meaning it doesn’t operate on a .25 scale. To work around this, we will run
10,000 questionnaires of 36 people and look at the percentage of questionnaires whose average
fell within $6.25 - $6.50. The reason each questionnaire contains 36 people is because that is the
average number of users in each unum from the data we collected. Once we obtain the
percentage of questionnaires that fall within our specified range, we can compare it to the 54.5%
of the unums and test for a significant difference in proportions. Below is the code I used for the
simulation:
When I ran the simulation, I found that approximately, 44% of the questionnaires had an average
response within $6.25 - $6.50. This is lower than unums 54.5%, but not significantly lower.
So from our limited data, we do not have enough evidence to show that unum gives a more
accurate answer than our simulated questionnaires. But how does unum perform versus a
questionnaire when the sample sizes are smaller? Obviously, the variation in the questionnaire’s
3. average answers is going to increase as the sample size decreases. However, the same rules don’t
necessarily apply to unums.
If we look at all the unums with under 15 users, the percentage of unum answers either $6.25 or
$6.50 is an extraordinary 80% (4 out of 5)! Logically, there should be no reason to believe
smaller sample sizes result in more accurate answers, it just wouldn’t make any sense. But due to
the nature of how unum’s interface operates, there could be reason to believe the accuracy of
unum’s answers isn’t effected by smaller sample sizes.
So for the sake of this example, let’s assume that the percentage of unums answering either $6.25
or $6.50 remains at 54.5% when using a sample size of 15 or less. In order to see how this
compares to questionnaires, we will use the same simulation process as before with a sample size
of 9 people per questionnaire (this is the average number of users in unums with a sample size of
15 or less.
As it turns out, about 23% of the simulated questionnaires fell within the $6.25 - $6.50 range.
The results for a one proportion test comparing the 23% to unum’s 54.5% are below:
The null hypothesis of our test assumes the proportion of unums with answers of $6.25 or $6.50
is equal to what we found from our simulated questionnaires (23%). The alternate hypothesis
states that proportion of unums with answers of $6.25 or $6.50 is greater than 23%. I used the
data from all the unums in order to find a significant p-value. Remember that for sample sizes of
15 or less, the proportion of unums with answers of $6.25 or $6.50 actually 80% (4 out of 5). I
wanted to use the proportion from the data as a whole (6 out of 11) because I believe it is a more
realistic expectation. This method assumes that unum’s accuracy isn’t effected as the sample size
decreases. Our results found a small p-value equal to .023, so we are able to find a significant
difference in proportions.
So for the time being, I feel comfortable saying unum tends to give more accurate answers than
questionnaires when it comes to using small sample sizes. However, it’s important to remember
that our data set is incredibly small (only 11 observations), so these results should be taken with
a grain of salt. Once we are able to collect more data on the subject, it could be proven that unum
tends to give more accurate answers than questionnaires with larger sample sizes, or it could be
shown that unum doesn’t give more accurate answers than questionnaires regardless of sample
size. Either way, more data needs to be collected on this subject.