1. To: Naomi Kelly From: Keith Li Memorandum
Subject: Analysis of crimes attempted at attractions in San Francisco
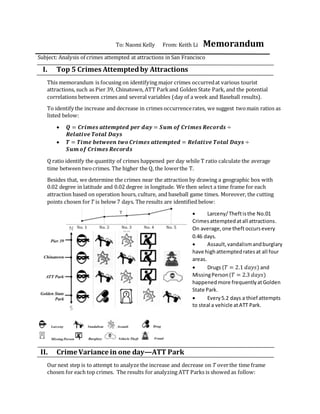
I. Top 5 Crimes Attemptedby Attractions
This memorandum is focusing on identifying major crimes occurredat various tourist
attractions, such as Pier 39, Chinatown, ATT Parkand Golden State Park, and the potential
correlations between crimes and several variables (day of a week and Baseball results).
To identify the increase and decrease in crimes occurrencerates, we suggest twomain ratios as
listed below:
𝑸 = 𝑪𝒓𝒊𝒎𝒆𝒔 𝒂𝒕𝒕𝒆𝒎𝒑𝒕𝒆𝒅 𝒑𝒆𝒓 𝒅𝒂𝒚 = 𝑺𝒖𝒎 𝒐𝒇 𝑪𝒓𝒊𝒎𝒆𝒔 𝑹𝒆𝒄𝒐𝒓𝒅𝒔 ÷
𝑹𝒆𝒍𝒂𝒕𝒊𝒗𝒆 𝑻𝒐𝒕𝒂𝒍 𝑫𝒂𝒚𝒔
𝑻 = 𝑻𝒊𝒎𝒆 𝒃𝒆𝒕𝒘𝒆𝒆𝒏 𝒕𝒘𝒐 𝑪𝒓𝒊𝒎𝒆𝒔 𝒂𝒕𝒕𝒆𝒎𝒑𝒕𝒆𝒅 = 𝑹𝒆𝒍𝒂𝒕𝒊𝒗𝒆 𝑻𝒐𝒕𝒂𝒍 𝑫𝒂𝒚𝒔 ÷
𝑺𝒖𝒎 𝒐𝒇 𝑪𝒓𝒊𝒎𝒆𝒔 𝑹𝒆𝒄𝒐𝒓𝒅𝒔
Q ratio identify the quantity of crimes happened per day while T ratio calculate the average
time between twocrimes. The higher the Q, the lowerthe T.
Besides that, we determine the crimes near the attraction by drawing a geographic box with
0.02 degree in latitude and 0.02 degree in longitude. We then select a time frame for each
attraction based on operation hours, culture, and baseball game times. Moreover, the cutting
points chosen forT is below 7 days. The results are identified below:
Larceny/Theftisthe No.01
Crimesattemptedat all attractions.
On average,one theft occursevery
0.46 days.
Assault,vandalismandburglary
have high attemptedrates at all four
areas.
Drugs (𝑇 = 2.1 𝑑𝑎𝑦𝑠) and
MissingPerson(𝑇 = 2.3 𝑑𝑎𝑦𝑠)
happened more frequentlyatGolden
State Park.
Every5.2 days a thief attempts
to steal a vehicle atATT Park.
II. Crime Variance in one day—ATT Park
Our next step is to attempt to analyze the increase and decrease on T overthe time frame
chosen for each top crimes. The results for analyzing ATT Parks is showed as follow:
2. Results: The T for TheftCrime increases constantly, indicating that the occurrencerate decreases
constantly from6 P.M.to 12 A.M. Generally, more burglary and vehicle theft happen during the
nightfall period (6-8 pm) than midnight. On the contrary,Assault crime arises from6 pm to 12 am.
Sunday
Monday
Tuesday
Wednesday
Thursday
Friday
Saturday
3. III. Win & Loss Effect
To better describe and better classify the criminal position around ATT park, it will be
reasonable to put the effectof baseball game (win/loss) into consideration. More data is
collectedfrom Baseball-reference.com1,asports data collectionwebsite. Data scraped and used
here includes game-by-game schedules and results for Giant’s 2010-2015 seasons.
Dates are divided into three categories, Winning (Home),Losing (Home) and Non-Home. We
first run an analysis for 2010 seasons (Note: only join with dates in our original crime data).
The results are shown below:
Results:It can be noticed that the time between two crimes increases for both the losing
nights and non-home-game nights, suggesting that the crime incidents per day decreases as
time goes on.
On the contrary, it is interesting to notice that, on winning nights, crimes incidents decrease
during the game time and then increases significantly after the game. That trends can be
used to allocate police resources more effectively.
The results need to be verifiedwith more data tested for 2011-2015 seasons.
1 http://www.baseball-reference.com/teams/SFG/2010-schedule-scores.shtml
http://www.baseball-reference.com/teams/SFG/2011-schedule-scores.shtml
Season: 2010
Time Period: 7/1-12/31
Types DAYS
WIN 24
LOSS 15
NON-HOME 145
Total 184