More Related Content
More from Michael J. (Mike) Stoever (7)
M. Stoever Final Map
- 1. Esri, HERE, DeLorme, MapmyIndia, © OpenStreetMap
contributors, and the GIS user community
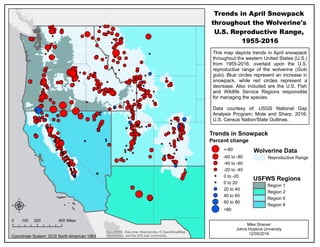
Trends in April Snowpack
throughout the Wolverine's
U.S. Reproductive Range,
1955-2016
This map depicts trends in April snowpack
throughout the western United States (U.S.)
from 1955-2016, overlaid upon the U.S.
reproductive range of the wolverine (Gulo
gulo). Blue circles represent an increase in
snowpack, while red circles represent a
decrease. Also included are the U.S. Fish
and Wildlife Service Regions responsible
for managing the species.
Data courtesy of: USGS National Gap
Analysis Program; Mote and Sharp, 2016;
U.S. Census Nation/State Outlines.
µ0 200 400100 Miles
Mike Stoever
Johns Hopkins University
12/05/2016
USFWS Regions
Region 1
Region 2
Region 6
Region 8
Wolverine Data
Reproductive Range
Trends in Snowpack
Percent change
<-80
-60 to -80
-40 to -60
-20 to -40
0 to -20
0 to 20
20 to 40
40 to 60
60 to 80
>80
Coordinate System: GCS North American 1983