Download to read offline
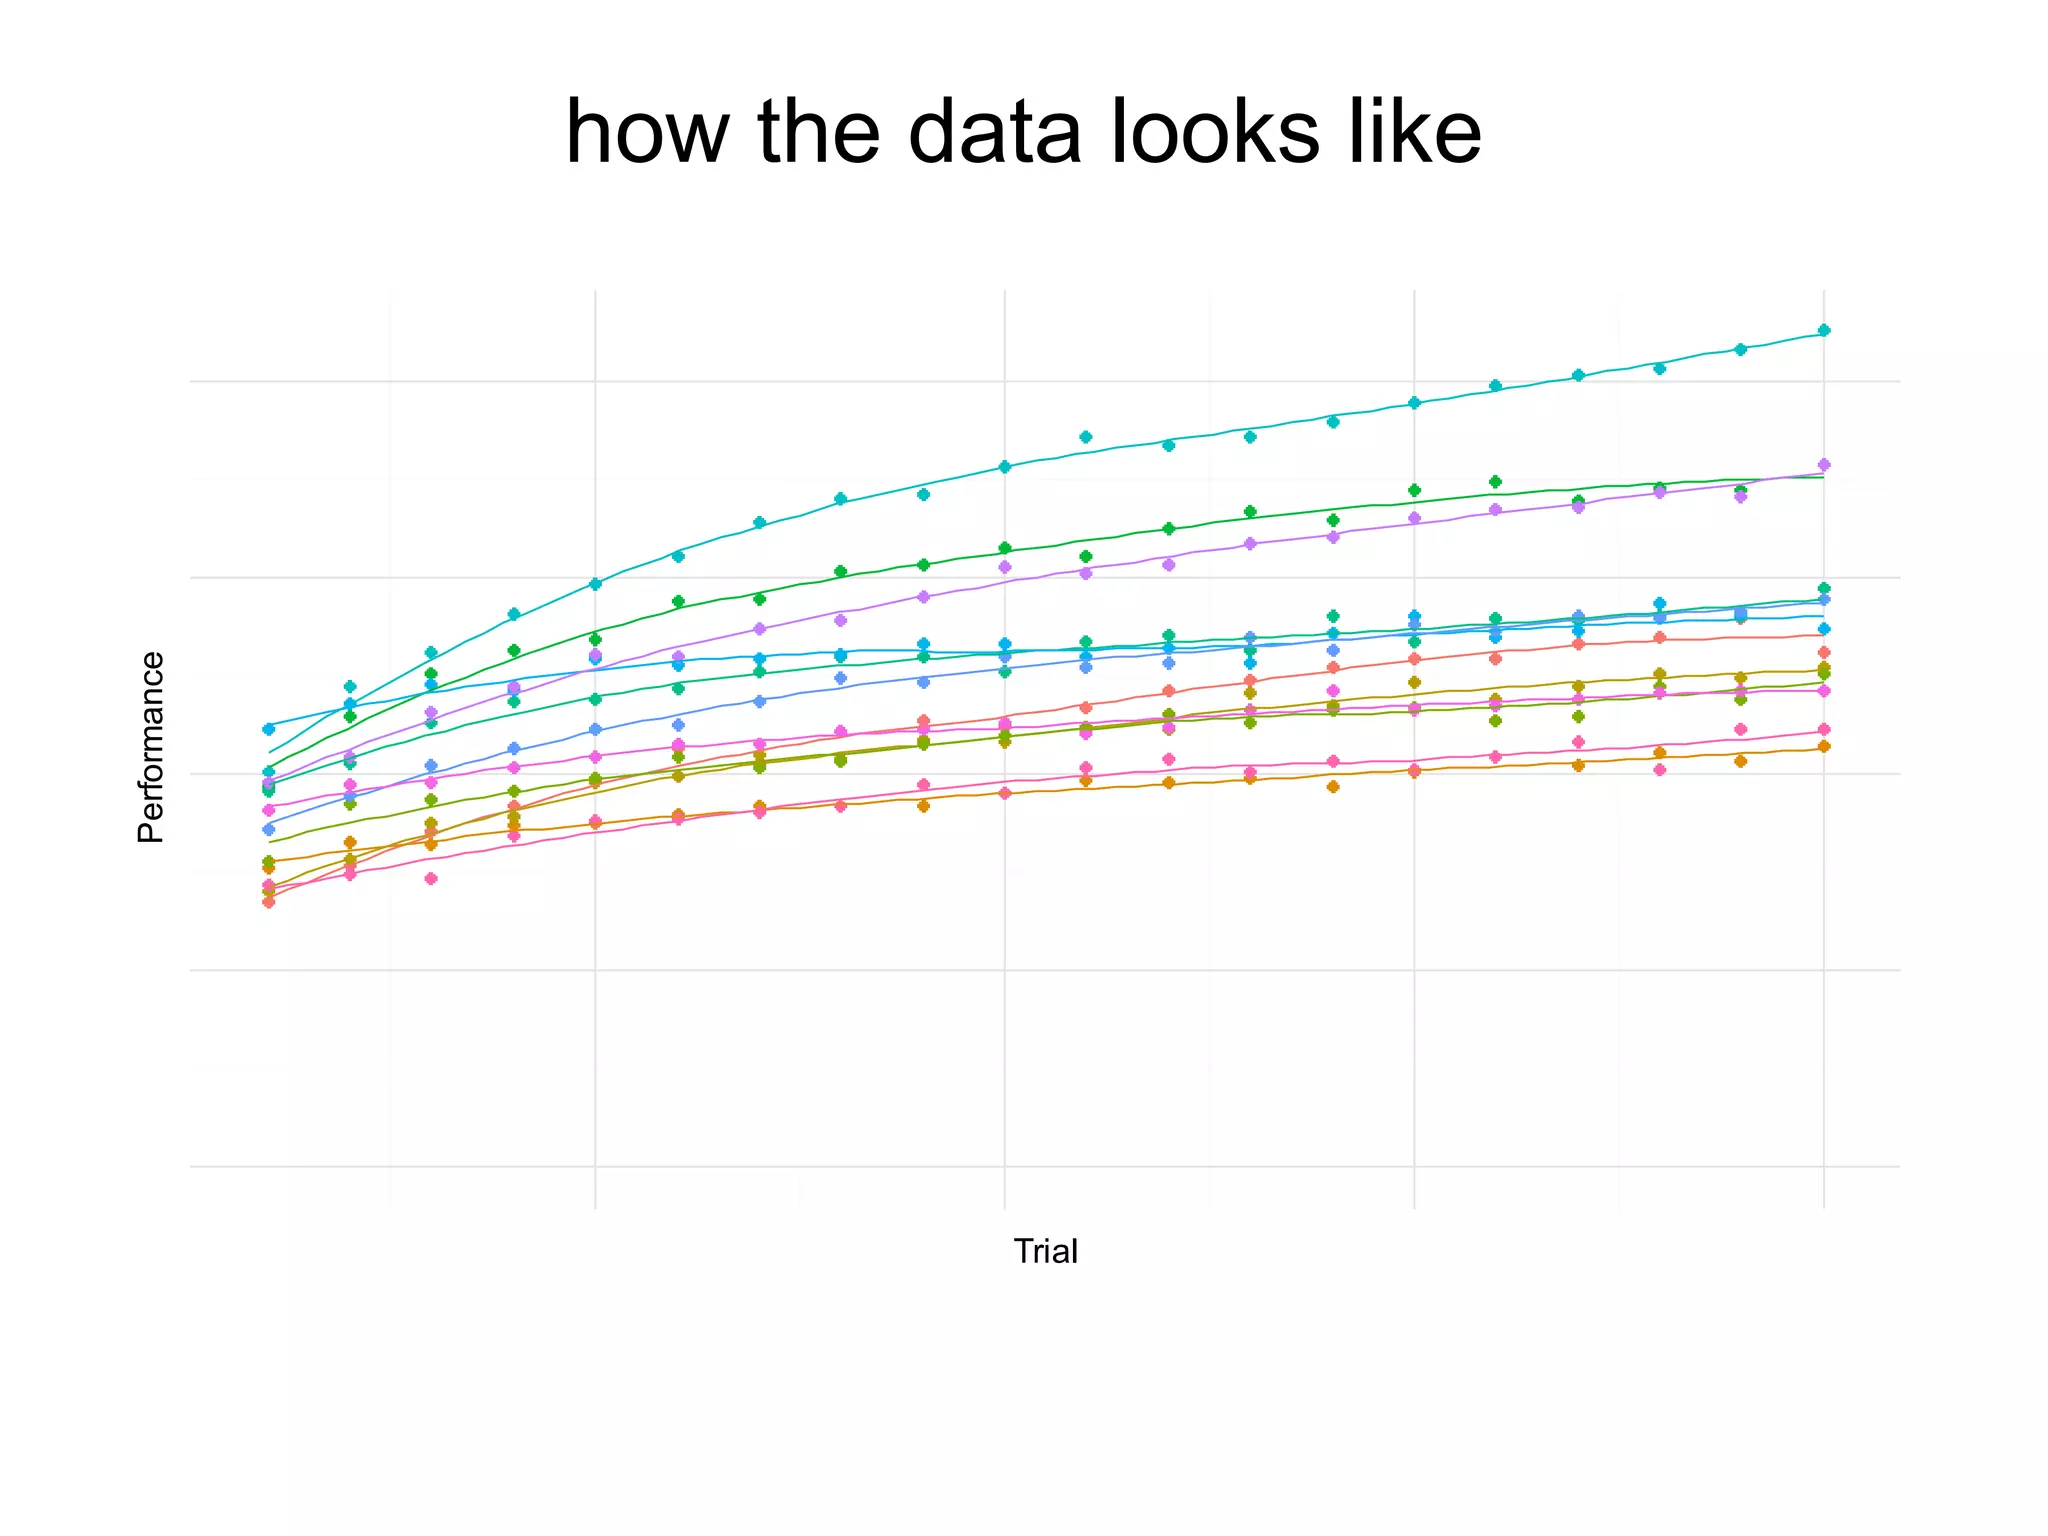
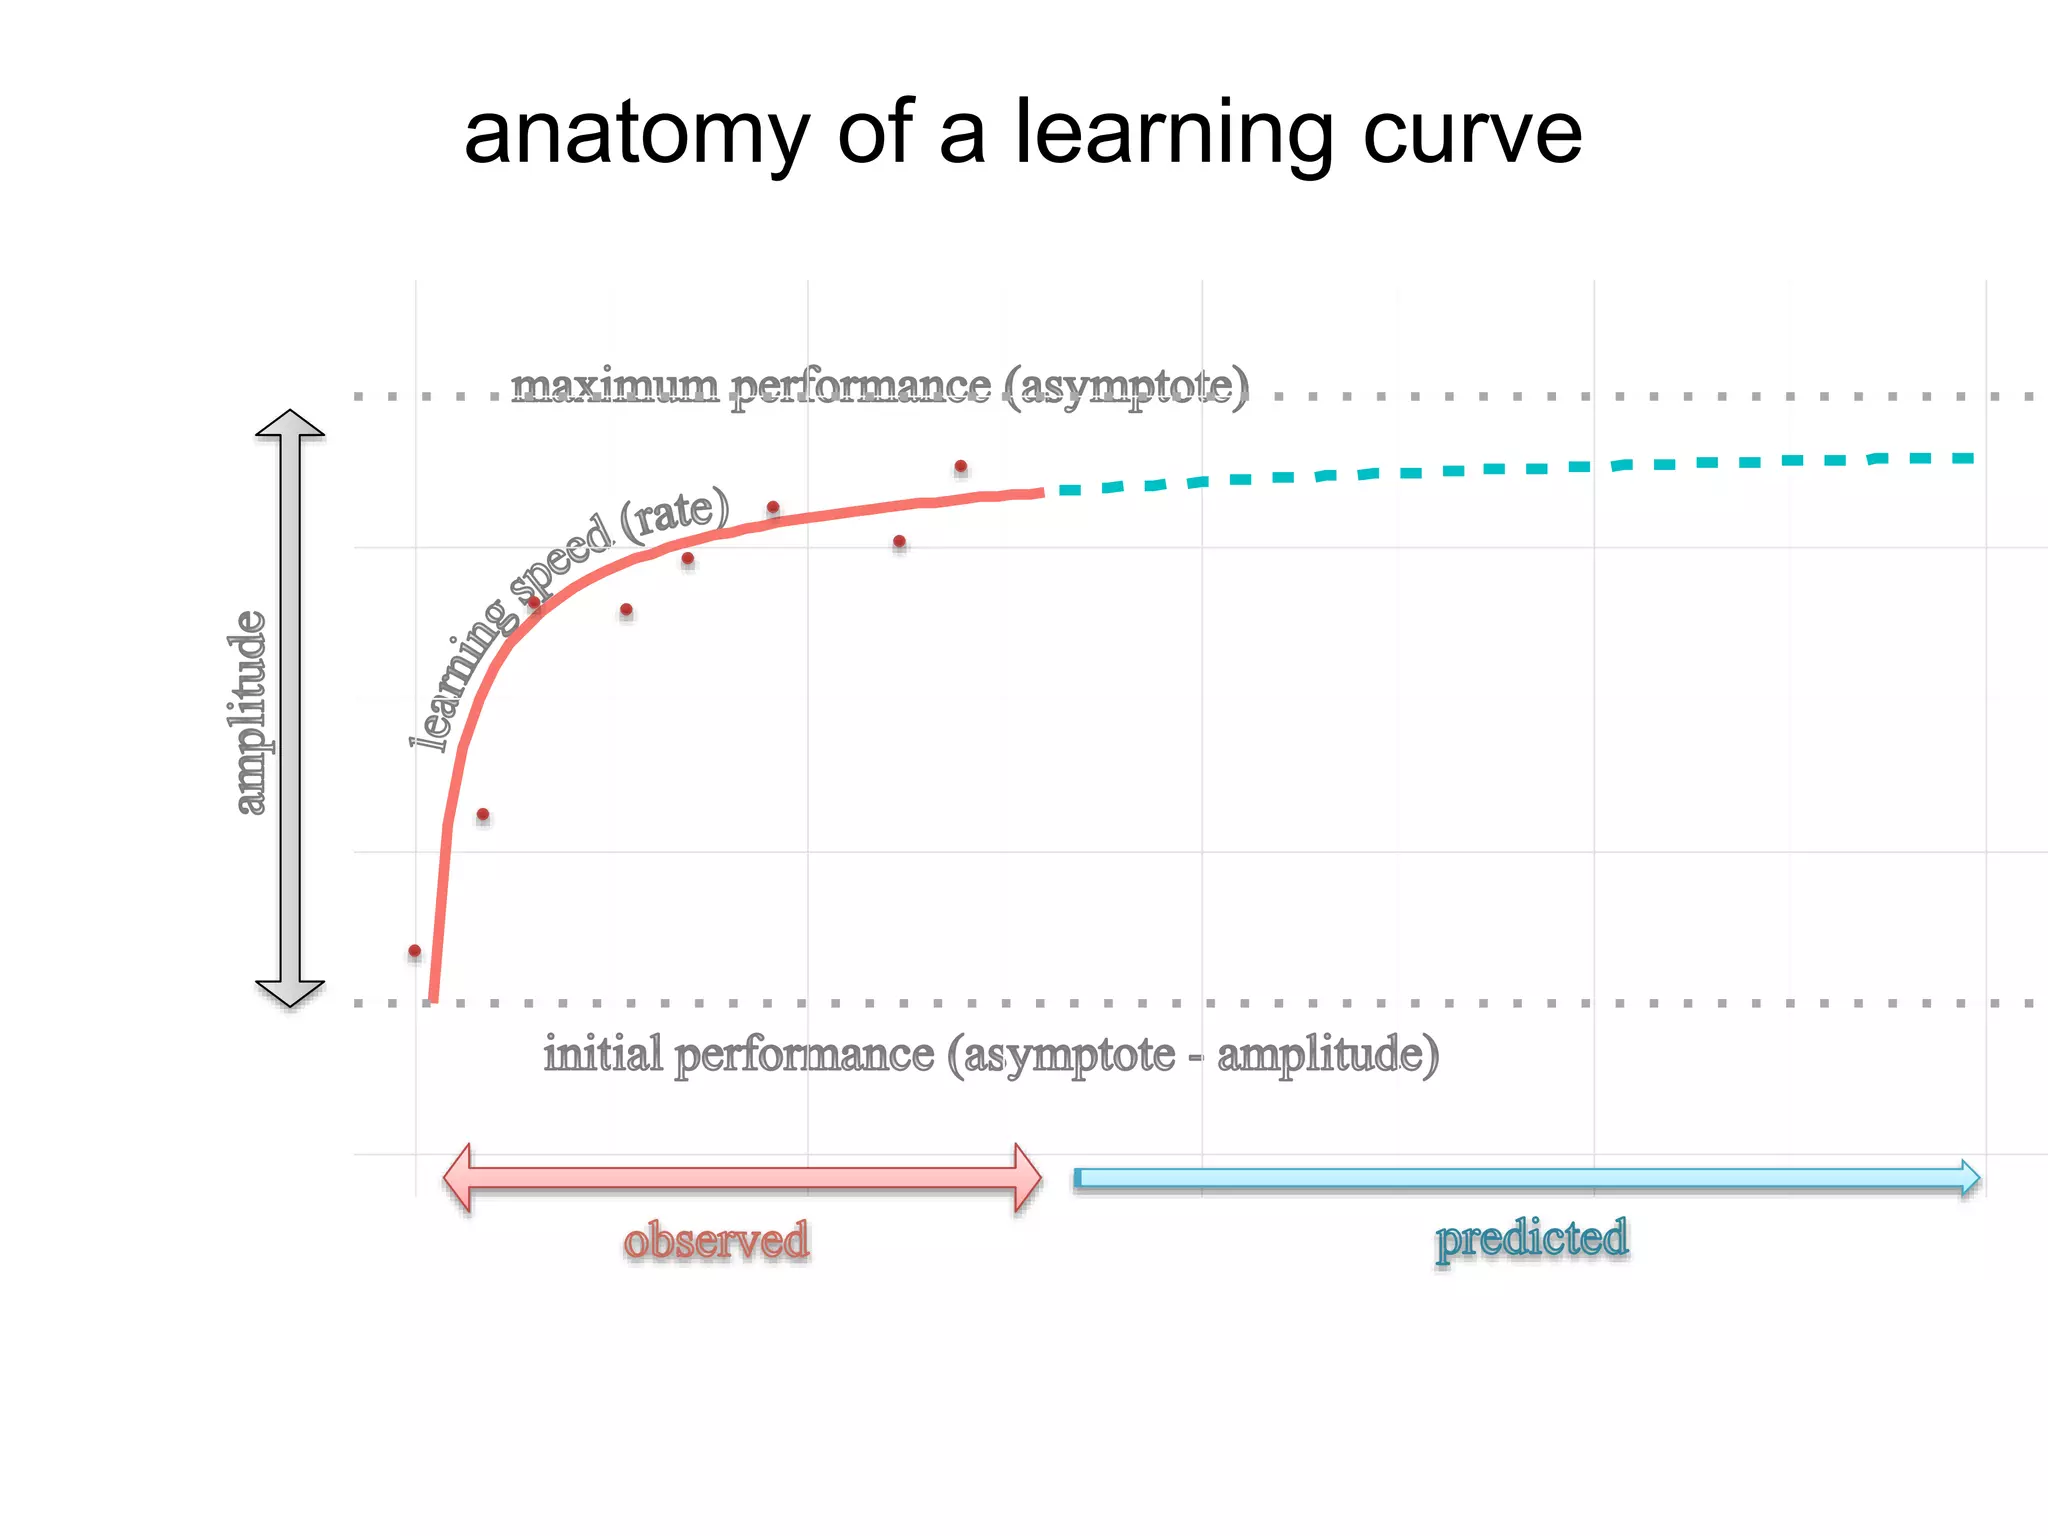
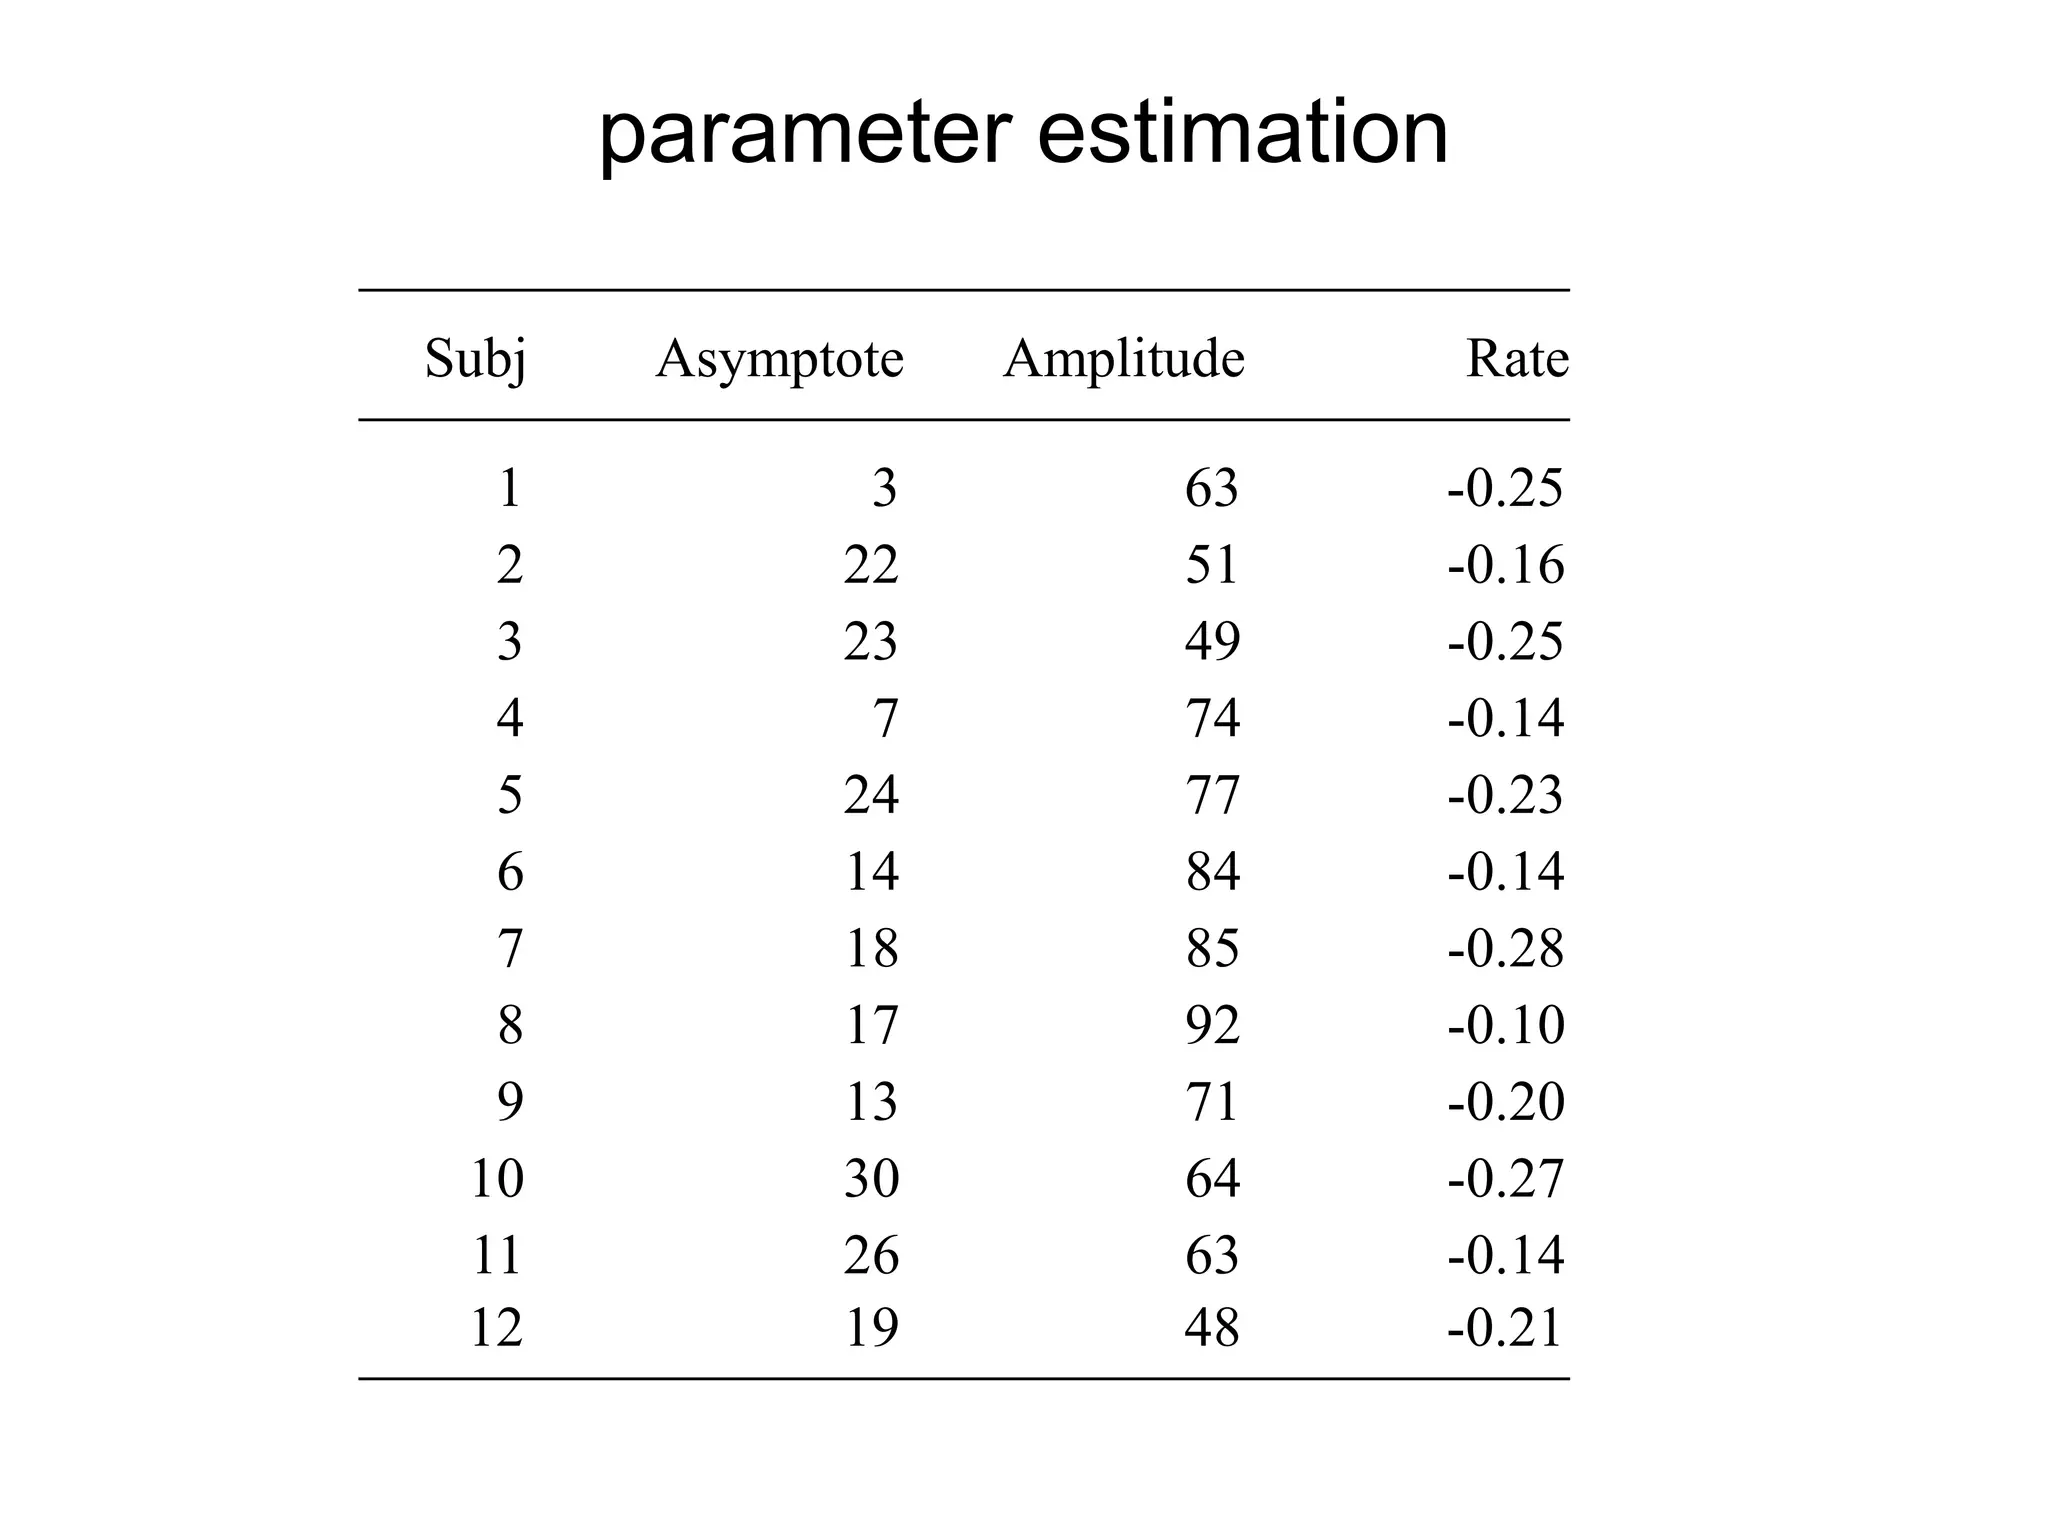

The document presents data regarding trial performance and describes the anatomy of a learning curve, including key parameters such as asymptote, amplitude, and rate. It lists values for multiple subjects, highlighting their respective performances. The details suggest variations in performance metrics across different trials.


