SlideShare a Scribd company logo
1 of 1
Download to read offline
RESEARCH POSTER PRESENTATION DESIGN © 2011
www.PosterPresentations.com
The troubling issue of the SAT Superscore as an institutional metric
Mark A. Davenport
University of North Carolina at Greensboro
Joe’s superscore is 1080 based on high
section scores with tests 1 and 2. His
superscore can go up but never go
down, regardless of further retakes. In
effect, all error is assumed to
underestimate his superscore, never
overestimate it.
We graphed Joe’s four SAT scores below
in the order he took the tests.
According to classical test theory, as his
SAT Composite average score goes up or
down with each retake, his average
(about 988) will approach a better
estimate of his true aptitude.
Some institutions cite changes in cohort
SAT score averages as evidence that
efforts to improve applicant quality
have worked (or fallen short). This
assumes that SAT aggregate scores are
mostly analogous to individual scores:
That is, changes in average SAT scores
reflect changes in the ‘average
aptitude’ of the cohort. However, hybrid
scoring schemes such as the
‘Superscore’ may introduce some
troubling confounds for aggregate score
users.
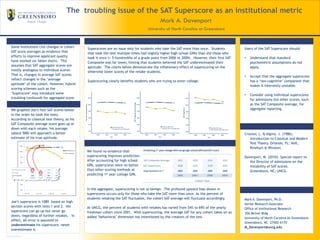
Superscores are an issue only for students who take the SAT more than once. Students
that took the test multiple times had slightly higher high school GPAs than did those who
took it once (< 5-hundredths of a grade point from 2006 to 2009). However, their first SAT
Composite was far lower, hinting that students believed the SAT underestimated their
aptitude. The charts below demonstrate the inflationary effect of superscoring on the
otherwise lower scores of the retake students.
Superscoring clearly benefits students who are trying to enter college.
We found no evidence that
superscoring improves prediction.
After accounting for high school
GPA, superscores were no better
than other scoring methods at
predicting 1st year college GPA.
In the aggregate, superscoring is not so benign. The profound upward bias shown in
superscores occurs only for those who take the SAT more than once. As the percent of
students retaking the SAT fluctuates, the cohort SAT average will fluctuate accordingly.
At UNCG, the percent of students with retakes has varied from 54% to 69% of the yearly
freshman cohort since 2001. With superscoring, the average SAT for any cohort takes on an
added ‘behavioral’ dimension not intentioned by the creators of the test.
Users of the SAT Superscore should:
• Understand that standard
psychometric assumptions do not
apply.
• Accept that the aggregate superscore
has a ‘non-cognitive’ component that
makes it inherently unstable.
• Consider using individual superscores
for admissions but other scores, such
as the SAT Composite average, for
aggregate reporting.
Crocker, L. & Algina, J. (1986).
Introduction to Classical and Modern
Test Theory. Orlando, FL: Holt,
Rinehart & Winston.
Davenport, M. (2010). Special report to
the Director of Admissions on the
instability of SAT scores.
Greensboro, NC: UNCG.
Mark A. Davenport, Ph.D.
Senior Research Associate
Office of Institutional Research
356 McIver Bldg
University of North Carolina At Greensboro
Greensboro, NC 27402-6170
M_Davenport@uncg.edu
More Related Content

Similar to PosterPresentations-36x48-final_final_final_publish_1

To predict the academic performance of an elementary school using Linear Regr...
To predict the academic performance of an elementary school using Linear Regr...To predict the academic performance of an elementary school using Linear Regr...
To predict the academic performance of an elementary school using Linear Regr...Kamalika Some
 
International Journal of Engineering Research and Development
International Journal of Engineering Research and DevelopmentInternational Journal of Engineering Research and Development
International Journal of Engineering Research and DevelopmentIJERD Editor
 
Evaas concepts nc es and ses
Evaas concepts   nc es and sesEvaas concepts   nc es and ses
Evaas concepts nc es and sesKeith Eades
 
AIOU Code 697 Assessment in Science Education Solved Assignment 1.pptx
AIOU Code 697 Assessment in Science Education Solved Assignment 1.pptxAIOU Code 697 Assessment in Science Education Solved Assignment 1.pptx
AIOU Code 697 Assessment in Science Education Solved Assignment 1.pptxZawarali786
 
AIOU Code 697 Assessment in Science Education Solved Assignment 1.pdf
AIOU Code 697 Assessment in Science Education Solved Assignment 1.pdfAIOU Code 697 Assessment in Science Education Solved Assignment 1.pdf
AIOU Code 697 Assessment in Science Education Solved Assignment 1.pdfZawarali786
 
overviewaccountabilitymetrics_june2014.ppt
overviewaccountabilitymetrics_june2014.pptoverviewaccountabilitymetrics_june2014.ppt
overviewaccountabilitymetrics_june2014.pptMohamedHendawy17
 
MCAS Analysis Educational Growth
MCAS Analysis Educational GrowthMCAS Analysis Educational Growth
MCAS Analysis Educational GrowthFranklin Matters
 
Low vs high-stakes tests
Low  vs high-stakes testsLow  vs high-stakes tests
Low vs high-stakes testsSarahTaouir
 
Gradding and reporting
Gradding and reporting Gradding and reporting
Gradding and reporting HennaAnsari
 
Snow College GPA Study
Snow College GPA StudySnow College GPA Study
Snow College GPA StudyJoshua Woods
 
F41417 5edc20025b1b4d9f9c229e4ce4b12b8a
F41417 5edc20025b1b4d9f9c229e4ce4b12b8aF41417 5edc20025b1b4d9f9c229e4ce4b12b8a
F41417 5edc20025b1b4d9f9c229e4ce4b12b8aizzyka
 
Web 2.0 assessment presentation
Web 2.0 assessment presentation Web 2.0 assessment presentation
Web 2.0 assessment presentation heatherkmiles
 
Chief accountability officers presentation
Chief accountability officers presentationChief accountability officers presentation
Chief accountability officers presentationJohn Cronin
 
Standardized testing edf 2005
Standardized testing edf 2005Standardized testing edf 2005
Standardized testing edf 2005Alex Eicher
 
Final Meta Analysis 1
Final Meta Analysis 1Final Meta Analysis 1
Final Meta Analysis 1Keller A
 

Similar to PosterPresentations-36x48-final_final_final_publish_1 (20)

Norm Reference Test
Norm Reference TestNorm Reference Test
Norm Reference Test
 
To predict the academic performance of an elementary school using Linear Regr...
To predict the academic performance of an elementary school using Linear Regr...To predict the academic performance of an elementary school using Linear Regr...
To predict the academic performance of an elementary school using Linear Regr...
 
International Journal of Engineering Research and Development
International Journal of Engineering Research and DevelopmentInternational Journal of Engineering Research and Development
International Journal of Engineering Research and Development
 
A1070109
A1070109A1070109
A1070109
 
Navigator: February 2017
Navigator: February 2017Navigator: February 2017
Navigator: February 2017
 
Evaas concepts nc es and ses
Evaas concepts   nc es and sesEvaas concepts   nc es and ses
Evaas concepts nc es and ses
 
AIOU Code 697 Assessment in Science Education Solved Assignment 1.pptx
AIOU Code 697 Assessment in Science Education Solved Assignment 1.pptxAIOU Code 697 Assessment in Science Education Solved Assignment 1.pptx
AIOU Code 697 Assessment in Science Education Solved Assignment 1.pptx
 
AIOU Code 697 Assessment in Science Education Solved Assignment 1.pdf
AIOU Code 697 Assessment in Science Education Solved Assignment 1.pdfAIOU Code 697 Assessment in Science Education Solved Assignment 1.pdf
AIOU Code 697 Assessment in Science Education Solved Assignment 1.pdf
 
overviewaccountabilitymetrics_june2014.ppt
overviewaccountabilitymetrics_june2014.pptoverviewaccountabilitymetrics_june2014.ppt
overviewaccountabilitymetrics_june2014.ppt
 
Growth Analysis
Growth AnalysisGrowth Analysis
Growth Analysis
 
MCAS Analysis Educational Growth
MCAS Analysis Educational GrowthMCAS Analysis Educational Growth
MCAS Analysis Educational Growth
 
Low vs high-stakes tests
Low  vs high-stakes testsLow  vs high-stakes tests
Low vs high-stakes tests
 
Gradding and reporting
Gradding and reporting Gradding and reporting
Gradding and reporting
 
Snow College GPA Study
Snow College GPA StudySnow College GPA Study
Snow College GPA Study
 
F41417 5edc20025b1b4d9f9c229e4ce4b12b8a
F41417 5edc20025b1b4d9f9c229e4ce4b12b8aF41417 5edc20025b1b4d9f9c229e4ce4b12b8a
F41417 5edc20025b1b4d9f9c229e4ce4b12b8a
 
Web 2.0 assessment presentation
Web 2.0 assessment presentation Web 2.0 assessment presentation
Web 2.0 assessment presentation
 
Chief accountability officers presentation
Chief accountability officers presentationChief accountability officers presentation
Chief accountability officers presentation
 
Va 101 ppt
Va 101 pptVa 101 ppt
Va 101 ppt
 
Standardized testing edf 2005
Standardized testing edf 2005Standardized testing edf 2005
Standardized testing edf 2005
 
Final Meta Analysis 1
Final Meta Analysis 1Final Meta Analysis 1
Final Meta Analysis 1
 

PosterPresentations-36x48-final_final_final_publish_1

  • 1. RESEARCH POSTER PRESENTATION DESIGN © 2011 www.PosterPresentations.com The troubling issue of the SAT Superscore as an institutional metric Mark A. Davenport University of North Carolina at Greensboro Joe’s superscore is 1080 based on high section scores with tests 1 and 2. His superscore can go up but never go down, regardless of further retakes. In effect, all error is assumed to underestimate his superscore, never overestimate it. We graphed Joe’s four SAT scores below in the order he took the tests. According to classical test theory, as his SAT Composite average score goes up or down with each retake, his average (about 988) will approach a better estimate of his true aptitude. Some institutions cite changes in cohort SAT score averages as evidence that efforts to improve applicant quality have worked (or fallen short). This assumes that SAT aggregate scores are mostly analogous to individual scores: That is, changes in average SAT scores reflect changes in the ‘average aptitude’ of the cohort. However, hybrid scoring schemes such as the ‘Superscore’ may introduce some troubling confounds for aggregate score users. Superscores are an issue only for students who take the SAT more than once. Students that took the test multiple times had slightly higher high school GPAs than did those who took it once (< 5-hundredths of a grade point from 2006 to 2009). However, their first SAT Composite was far lower, hinting that students believed the SAT underestimated their aptitude. The charts below demonstrate the inflationary effect of superscoring on the otherwise lower scores of the retake students. Superscoring clearly benefits students who are trying to enter college. We found no evidence that superscoring improves prediction. After accounting for high school GPA, superscores were no better than other scoring methods at predicting 1st year college GPA. In the aggregate, superscoring is not so benign. The profound upward bias shown in superscores occurs only for those who take the SAT more than once. As the percent of students retaking the SAT fluctuates, the cohort SAT average will fluctuate accordingly. At UNCG, the percent of students with retakes has varied from 54% to 69% of the yearly freshman cohort since 2001. With superscoring, the average SAT for any cohort takes on an added ‘behavioral’ dimension not intentioned by the creators of the test. Users of the SAT Superscore should: • Understand that standard psychometric assumptions do not apply. • Accept that the aggregate superscore has a ‘non-cognitive’ component that makes it inherently unstable. • Consider using individual superscores for admissions but other scores, such as the SAT Composite average, for aggregate reporting. Crocker, L. & Algina, J. (1986). Introduction to Classical and Modern Test Theory. Orlando, FL: Holt, Rinehart & Winston. Davenport, M. (2010). Special report to the Director of Admissions on the instability of SAT scores. Greensboro, NC: UNCG. Mark A. Davenport, Ph.D. Senior Research Associate Office of Institutional Research 356 McIver Bldg University of North Carolina At Greensboro Greensboro, NC 27402-6170 M_Davenport@uncg.edu