1. Final project SSS16
Group 1: Environmental health
Edoardo Fanteria, Juho Heikkinen, Giulia Miniaci, Maria Ramos
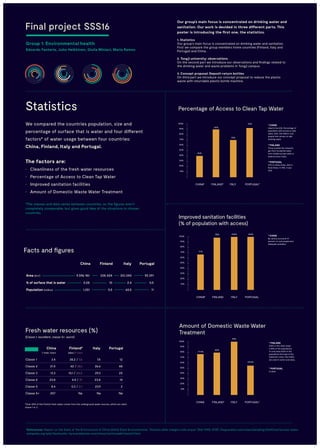
Statistics
We compared the countries population, size and
percentage of surface that is water and four different
factors* of water usage between four countries:
China, Finland, Italy and Portugal.
The factors are:
• Cleanliness of the fresh water resources
• Percentage of Access to Clean Tap Water
• Improved sanitation facilities
• Amount of Domestic Waste Water Treatment
*The classes and data varies between countries, so the figures aren’t
completely comparable, but gives good idea of the situations in chosen
countries.
References: Report on the State of the Environment of China (2003) State Environmnetal, “Sistema delle indagini sulle acque” (SIA-1999), ISTAT, theguardian.com/news/datablog/2009/mar/access-water,
wikipedia.org/wiki/Vesihuolto, factsanddetails.com/china/cat13/sub85/item317.html
Our group’s main focus is concentrated on drinking water and
sanitation. Our work is devided in three different parts. This
poster is introducing the first one, the statistics.
1. Statistics
Our group’s main focus is concentrated on drinking water and sanitation.
First we compare the group members home countries (Finland, Italy and
Portugal) and China.
2. Tongji university: observations
On the second part we introduce our observations and findings related to
the drinking water and waste problems in Tongji campus.
3. Concept proposal: Deposit-return bottles
On third part we introduce our concept proposal to reduce the plastic
waste with returnable plastic bottle machine.
Facts and figures
Area (km2
)
% of surface that is water
Population (million)
9. 596. 961
0.28
1,351
338. 424
10
5.5
301.340
2.4
60.5
92.391
0.5
11
China Finland Italy Portugal
Fresh water resources (%)
(Classe 1: excellent, classe 5+: worst)
Classe 1
Classe 2
Classe 3
Classe 4
Classe 5
Classe 5+
3.4
21.4
13.3
23.8
8.4
29.7
38.2 / 7.6
42 / 35.1
15.1 / 24.2
4.4 / 31
0.3 / 2.1
Na
7.4
26.6
29.3
23.8
23.9
Na
12
48
25
14
2
Na
China
7 main rivers
Finland*
lakes / rivers
Italy Portugal
*Over 50% of the Finnish fresh water comes from the underground water sources, which are rated
classe 1 or 2
100%
90%
50%
70%
30%
80%
40%
40%
90%
93%
70%
60%
20%
10%
Percentage of Access to Clean Tap Water
CHINA* FINLAND* PORTUGAL*ITALY
* CHINA
Used to be 43%. Percentage of
population with access to safe
water: 83%. 360 million rural
people lack access to safe
drinking water.
* FINLAND
Those outside the networks
get their household water
from shallow private wells or
bedrock bore-holes.
* PORTUGAL
97% in Urban Areas, 50% in
Rural Areas. In 1993, it was
50%.
* CHINA
By various accounts 97
percent of rural people lack
adequate sanitation
100%
90%
50%
70%
30%
80%
40%
77%
98% 100%100%
60%
20%
10%
Improved sanitation facilities
(% of population with access)
CHINA* FINLAND PORTUGALITALY
100%
90%
50%
70%
30%
80%
40%
77. 5%
80%
55.8%
99%
60%
20%
10%
Amount of Domestic Waste Water
Treatment
CHINA FINLAND* PORTUGAL*ITALY
* FINLAND
100% in the urban areas
(~80% of the population),
in rural areas (20% of the
population) the level of the
treatment varies. Dry toilets
are used in some rural areas.
* PORTUGAL
In 2009