2. into “perfect” sitting positions in terms of the “optimal” spinal curva-
ture during sitting (Waongenngarm et al., 2015; O'Sullivan et al.,
2012a; Pynt et al., 2001; Baumgartner et al., 2012; Zemp et al., 2013),
broad consensus is lacking, suggesting that the “correct” sitting position
might be subject-specific (Claus et al., 2016). Moreover, Claus et al.
(2009) proposed that any sustained sitting posture could result in fa-
tigue, discomfort and pain, suggesting that a “good” posture could still
be detrimental if it persists uninterrupted for extended periods (Coenen
et al., 2017). As a result, postural variability as well as regular small
movements are plausibly beneficial for the prevention of LBP (Davis
and Kotowski, 2014; Vergara and Page, 2002; Pynt et al., 2001;
Srinivasan and Mathiassen, 2012; Aarås et al., 2000).
Dynamic sitting behaviour is thought to provide beneficial biolo-
gical and physiological effects, since postural variations can reduce
spinal loads (Davis and Kotowski, 2014) and spinal shrinkage (van
Deursen et al., 2000), prevent muscle fatigue through alternating motor
unit activation (van Dieën et al., 2001), and inhibit damage to the
posterior aspect of the annulus pulposus by means of low magnitude
dynamic movements (Callaghan and McGill, 2001). Moreover, Straker
and Mathiassen (2009) indicated that short periods of inactivity can
already cause local changes regarding biomechanical, physiological and
neurological capability. It therefore appears reasonable that less dy-
namic sitting habits may result in discomfort and pain, especially in the
lower back.
In previous studies, different measurement technologies such as
video analysis (Womersley and May, 2006), accelerometers (Ryan
et al., 2011), optoelectronic motion analysis (Dunk and Callaghan,
2005), force sensors (Yamada et al., 2009; Zemp et al., 2016b) and
pressure distribution sensors (Zemp et al., 2016a) have all been used to
assess sitting behaviour. Here, pressure distribution sensors offer a re-
latively cheap measurement approach that neither disturbs nor affects
the subject during measurement, and allows high accuracy for classi-
fying individual sitting behaviour and positions (Zemp et al., 2016a;
Kamiya et al., 2008). Additionally, pressure mats are easily attachable
and therefore offer a practical solution for analysing the sitting beha-
viour of participants on their own chair.
A previously conducted pilot study (N = 20) demonstrated ten-
dencies towards a more static sitting behaviour in participants with
mild LBP (Zemp et al., 2016a). Towards gaining a deeper understanding
of the relationships between LBP and occupational sitting habits, the
goal of this study was to build on the previous pilot data and establish
whether call-centre employees with LBP express different sitting be-
haviour patterns from those without LBP.
2. Methods
2.1. Participants
Since the working task is known to strongly impact on sitting be-
haviour (van Dieën et al., 2001; Dunk and Callaghan, 2005; Ellegast
et al., 2012; Groenesteijn et al., 2012; Grooten et al., 2017), this study
selected a large number of participants that worked in an environment
with highly standardised working tasks. Furthermore, in order to
maintain real-world validity, no additional work assignments, or sit-
ting/movement instructions were provided to the participants during
the measurement period. Therefore, seventy office workers from a
professional call-centre company located in Dresden and Leipzig (Ger-
many) were recruited. Participants were required to speak German and
were excluded if they were pregnant, took glucocorticoids, or were
currently undergoing medical treatment for other physical complaints
besides back pain. All participants provided written informed consent
prior to participation in this study, which was conceptualised and
performed in accordance with the principals of the declaration of
Helsinki and was approved by the ethics committees of the University
Potsdam, Germany (no. 42/2014) and confirmed by the ethics com-
mission of ETH Zürich, Switzerland. After measurement completion, all
participants received 15 Euros compensation and were provided with
their individual study results.
2.2. Study environment
The call-centre environment offers a contemporary office work
setting with regard to job assignments and physical organisation. Our
selected call-centre specifically dealt with difficult and challenging
customer situations, and it was therefore assumed that participants
were exposed to a considerable mental stress burden (Johnson et al.,
2005; Oh et al., 2017). The employees' work tasks were highly stan-
dardised, comprising typing at a computer and calling clients using a
head-set, with nearly all duties undertaken in a sitting position. Since
the company's work policy required a change of workplace every 3 h, it
was not possible to ergonomically adjust the office desk and computer
set-up to the individual requirements and preferences.
2.3. Study design
This study was conducted within 2 weeks at two different worksites
of the call-centre company and each participant was assessed during
one complete working shift. In order to investigate the true relation-
ships between daily sitting behaviour and LBP, it was essential that the
measurements were based on each subjects' real-world performance in
the natural office environment, with participant's each using their own
office chair, undertaking their own daily office tasks. The company
provided three different office chair models, which all allowed adap-
tation of seat height and depth, as well as the option to fix the backrest
at a certain angle or allow dynamic reclination. After measurement
system set-up, data was collected for the entire working shift, including
breaks. At the end of the working day, calibration measurements for the
classification of the different sitting positions were performed. Similarly
to the preceding pilot study (Zemp et al., 2016a), participants were
asked to sit four times in seven predefined sitting positions: upright
(P1), reclined (P2), forward inclined (P3), laterally tilted right/left (P4/
P5), crossed legs right over left/left over right (P6/P7). Afterwards the
participants were asked to fill out the questionnaire (section 2.5).
2.4. Measurement systems
In order to assess sitting behaviour, spatio-temporal changes in the
distribution of pressure across the participants' sitting interface were
monitored by means of the textile pressure mat “sensomative science”
(sensomative GmbH, Rothenburg, Switzerland) consisting of a 196
(14 × 14) sensor matrix with a size of 45 cm × 45 cm (www.
sensomative.com). The pressure data were recorded at 1.5 Hz with a
resolution of 8 bits and a maximum pressure limit of 60 kPa. Using
Bluetooth Low Energy, the data were transferred from the textile mat to
a connected mobile phone (Nexus 5X, Google, LG, Seoul, Korea) where
the data were stored in the corresponding mobile phone application. In
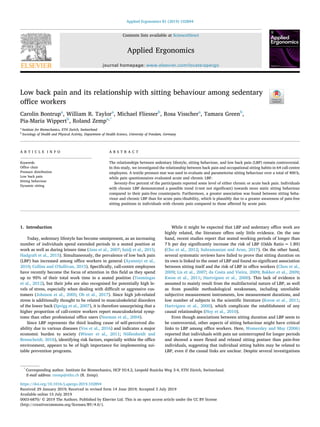
order to prevent the mat from sliding, the system was laterally fixed
with two textile straps and belt loops (Fig. 1). Due to the pressure mats’
thin and flexible nature, participants were not able to feel its presence.
2.5. Questionnaires
In order to gather information about short- and long-term pain
status, including corresponding functional limitations, as well as so-
ciodemographic information, the following standardised questionnaires
were used:
2.5.1. Chronic Pain Grade questionnaire
To assess pain intensity and pain related functional limitations in
the previous three months, participants were requested to complete the
Chronic Pain Grade (CPG) questionnaire (Von Korff et al., 1992), which
is divided into two subscales: (1) Korff characteristic pain intensity
C. Bontrup, et al. Applied Ergonomics 81 (2019) 102894
2
3. (CPI) and (2) Korff disability (DISS). Each CPG item ranged from 0 (“no
pain/impairment”) to 10 (“worst possible pain”/“I wasn‘t able to do
anything”). For data analysis, items of each subscale were presented on
a scale ranging from 0 to 100. Missing or inconsistent data were treated
according to the CPG recommendations.
2.5.2. German brief pain inventory
The Brief Pain Inventory (BPI) (Radbruch et al., 1999) was used to
estimate subjects’ acute LBP within the previous 24 h. Similar to the
CPG questionnaire, the BPI is subdivided into two subscales: (1) pain
severity (BPISeverity) and (2) pain-related interference (BPIInterfere) of
daily functions. Answering possibilities for the BPI ranged from 0 (“no
pain”/“no interference”) to 10 (“pain as bad as you can imagine”/“in-
terferes completely”) (Daut et al., 1983). The BPI also included a body
chart to illustrate each participant's pain area(s), which allowed con-
firmation (or otherwise) of pain in the lower back region. Missing or
inconsistent data were treated according to the BPI recommendations.
2.6. Data analysis
Data processing and analysis was performed similarly to the pilot
study of Zemp et al. (2016a), which is only briefly described below:
2.6.1. Low back pain
The four pain variables (CPI, DISS, BPISeverity, BPIInterfere) were used
to allocate participants into either subgroup A: no pain; no functional
disability, or into subgroup B: with pain; with functional disability.
Thereby, all participants with scores of 0 were allocated to subgroup A
and all participants with scores greater than 0 were assigned to sub-
group B.
2.6.2. Sitting position classification and validation
Raw pressure data were analysed using MATLAB (R2017a
MathWorks Inc., Natick, USA). The random forest classification ap-
proach was applied to determine the sitting position of each subject at
any instant during the entire working day (Zemp et al., 2016a, 2016b).
The calibration measurements of all participants were used to create
one general random forest classifier. Here, all pressure values of every
calibration measurement were normalised to the maximal value of the
196 sensors, and an ensemble of 500 decision trees was used while all
other parameters were kept at MATLAB's default levels.
In order to quantify the reliability of the sitting position classifier
within this study, a leave-one-out (LOO) cross-validation was per-
formed. Here, the calibration measurements of all participants except
one was used as training data and the remaining measurement was used
for validation. The classified sitting positions were then identified as
correct or incorrect. This procedure was repeated for every calibration
measurement in order to quantify the overall classification accuracy.
2.6.3. Participant sitting behaviour
In order to identify transient periods (when participants showed
small body movements or moved from one sitting posture to another),
firstly, raw pressure data were filtered using a zero-phase low-pass filter
(1st order Butterworth filter, cut-off frequency: 0.2 Hz). A threshold
value was then calculated for every participant, which was defined as
0.35% of the 93rd percentile of the pressure values throughout the
working day. Finally, if more than two-thirds of the loaded sensors
exhibited a higher differential in the pressure values from one time
point to the next than the defined threshold value, these time points
were considered as transient periods. In cases where the time between
two transient periods was shorter than 3 s, the two transient periods
were considered as one longer transient period. Remaining phases
without transient periods were defined as stable sitting. Using the
previously created random forest classifier, the specific sitting position
was calculated 1 s after the onset of a stable sitting period and allocated
to the whole stable period. In order to quantify sitting behaviour, four
parameters were defined:
N ˆ
move : Mean number of movements per working hour, characterised
by the number of transient periods during the whole working day
divided by the number of working hours
Nˆ
pos : Mean number of positional changes per working hour, cal-
culated as the number of sitting position changes during the whole
working day divided by the number of working hours
t ˆ
stable : Mean time period of stable sitting, characterised by the mean
length of stable sitting periods over the whole working day
P
transient: Percentage of transient periods during the whole working
period
2.6.4. Statistical analysis
Data management and statistical analysis were carried out using the
software suite IBM SPSS Statistics (v24, SPSS Inc., Chicago, USA). In
order to summarise the four sitting behaviour parameters (N ˆ
move , Nˆ
pos ,
t ˆ
stable , P
transient) to one general parameter (SitBePar), a Principal
Component Analysis (PCA) was conducted. Here, a FACTOR analysis
with the correlation matrix method was used to extract the principal
components, as well as to calculate SitBePar using a least squares re-
gression approach.
After verifying normally distributed data by means of the Shapiro-
Wilk-test, the influence of different characteristics of pain (CPI, DISS,
BPISeverity, BPIInterfere) on the overall sitting behaviour (SitBePar) was
analysed using two-tailed independent t-tests. In a second step, the
same tests were applied for the pain groupings with the lowest p-values
and for N ˆ
move , Nˆ
pos , t ˆ
stable , and P
transient in order to quantify the influ-
ence of the pain variables on the four individual sitting behaviour
parameters.
3. Results
3.1. Participants
This study included 70 call-centre employees, from which six par-
ticipants (8.6%) were excluded due to participation withdrawal (N = 2)
or incomplete data sets of the measured pressure distribution (N = 4),
resulting in a study sample of 64 participants (43 ± 13 years;
78 kg ± 21 kg; 170 cm ± 10 cm; 40 females). Furthermore, two sub-
jects could not be included for analysis of the CPI and BPISeverity due to
inconsistent and/or missing entries resulting in a total of 62 partici-
pants for the CPI and BPISeverity, and a total of 64 participants for the
DISS and BPIInterfere grouping variable.
3.2. Low back pain
The two subscales of the CPG and BPI questionnaires showed good
internal consistencies with Cronbach's alpha values of 0.92 (CPI), 0.92
(DISS), 0.94 (BPISeverity) and 0.92 (BPIInterfere). Overall, the majority of
participants reported some level of either chronic or acute back pain
Fig. 1. Textile pressure mat (sensomative science) fixed with two textile straps
and belt loops at the seat pan of an office chair.
C. Bontrup, et al. Applied Ergonomics 81 (2019) 102894
3
4. (N = 48, 75%), with an average low to medium pain intensity
(CPI = 39.49 ± 20.01; BPISeverity = 2.13 ± 1.73) and related dis-
ability (DISS = 28.75 ± 19.06; BPIInterfere = 2.22 ± 1.69). Moreover,
the findings indicated a large variability within all four pain groupings
(Table 1).
3.3. Sitting position classification and validation
Since most of the participants preferred to work with a fixed
backrest, the positions “upright” (P1) and “reclined” (P2) were con-
sidered as one and the same position. The random forest classifier de-
monstrated an overall classification accuracy of 90% (Table 2) ranging
from 70% up to 100% for the different participants.
3.4. Participant sitting behaviour
Participants worked on average 6.2 ± 1.5 h (range: 2.8–8.7 h),
which resulted in 397 h of data collection. SitBePar captured 74% of the
entire variance within the data and was therefore chosen to be the
overall representative sitting behaviour parameter. The corresponding
component loadings were 0.937 N
( ˆ )
move , 0.629 (Nˆ
pos ), −0.931 (t ˆ
stable ),
0.902 (P
transient), comprised almost equally of all four sitting behaviour
parameters except Nˆ
pos , which was weighted slightly lower.
The p-values and Cohen's effect size of the two-tailed independent t-
tests for SitBePar and the four grouping variables indicated that the
relationship between sitting behaviour and chronic pain grouping
variables (CPI: p = 0.052, d = 0.579; DISS: p = 0.076, d = 0.471) was
higher than the relationship between SitBePar and acute pain conditions
(BPISeverity: p = 0.625, d = 0.120; BPIInterfere: p = 0.253, d = 0.291).
Participants experiencing chronic LBP showed a lower overall per-
centage of transient periods (25.69 ± 11.69%) compared to pain-free
participants (35.23 ± 14.55%) indicating a moderate effect
(p = 0.011, d = 0.723). Similarly, a moderate effect (p = 0.036,
d = 0.544) was observed between participants who felt disabled due to
chronic LBP (DISS) (25.64 ± 12.28%) and corresponding non-disabled
counterparts (32.75 ± 13.81%) (Figs. 2 and 3; Appendix: Table A1).
A closer analysis of the mean values indicated that participants with
chronic pain and/or functional disability demonstrated less transient
periods (P
transient) and less movements per hour (Nmove), slightly fewer
position changes per hour (Nˆ
pos ), and longer time periods of stable
sitting (t ˆ
stable ) compared with corresponding counterparts (Figs. 2 and
3).
Mean values of almost all four sitting behaviour parameters for the
four pain groupings indicated that participants with pain and pain re-
lated disability demonstrated a rather static sitting behaviour compared
to their pain-free counterparts (Appendix: Table A1).
4. Discussion
This study aimed to analyse the relationships between sitting be-
haviour and LBP by investigating the sitting habits of call-centre
workers whose assignments were undertaken in an almost continuous
sitting position. We found a small association between general sitting
behaviour and participants reporting chronic LBP and/or pain related
functional disability. These observations over extended periods were
consistent with reported sitting activity over short periods (1hr), where
subjects also exhibited more frequent postural shifts than chronic LBP
workers (Akkarakittichoke and Janwantanakul, 2017). The lack of a
stronger relationship between LBP and sitting behaviour was most
likely due to the highly multifactorial causality of LBP, including socio-
psychological and physiological factors (Hoy et al., 2010). Another
reason could be the complex and largely individual sitting habits, which
are known to vary considerably among office workers (Goossens et al.,
2012; Zemp et al., 2016a), thereby producing inhomogeneity in sitting
behaviour.
Since almost all analysed sitting behaviour parameters for all pain
groupings showed more dynamic activity in pain free participants, this
study indicates a possible trend (0.011 < p < 0.453) towards a more
static sitting behaviour among the majority of participants perceiving
pain and/or suffering from pain related disability. These results are in
line with several studies showing that participants with LBP or lumbar
discomfort exhibit a more static sitting behaviour by demonstrating less
micro-movements and longer periods of uninterrupted sitting (Zemp
et al., 2016a; O'Keeffe et al., 2013; O'Sullivan et al., 2012b; Vergara and
Table 1
Overview of the two subgroups (participants with and without pain/pain-re-
lated disability).
A B
Number of participants Number of participants
Mean value ± SD
Range
CPI (N = 62) #16 (26.8%) #46 (74.2%)
39.49 ± 20.01
6.66–96.66
DISS (N = 64) #24 (37.5%) #40 (62.5%)
28.75 ± 19.06
3.33–70.00
BPISeverity (N = 62) #28 (45.2%) #34 (54.8%)
2.13 ± 1.73
0.25–7.00
BPIInterfere (N = 64) #30 (46.9%) #34 (53.1%)
2.22 ± 1.69
0.14–6.42
Based on the pain groupings, all participants were assigned to subgroup A if
they indicated no pain and/or disability (score = 0), or to subgroup B if they
indicated pain and/or disability (score > 0). The numbers of the participants
belonging to the different subgroups are marked with “#” (percentage of total
in brackets). For subgroup B, mean values ( ± SD) and the ranges regarding the
intensity of pain and disability are also provided.
Table 2
Leave-one-out cross-validation confusion matrix.
Classified sitting position Accuracy
P1/P2 P3 P4 P5 P6 P7
Actual Sitting Position P1/P2 98.0% 0.3% 0.3% 0.6% 0.3% 0.6% 98.0%
P3 6.9% 91.1% 1.0% 0.0% 0.0% 1.0% 91.1%
P4 14.7% 1.5% 78.7% 0.0% 0.0% 5.1% 78.7%
P5 15.8% 2.5% 0.0% 76.7% 5.0% 0.0% 76.7%
P6 0.0% 0.0% 0.5% 2.4% 97.1% 0.0% 97.1%
P7 0.5% 0.0% 1.0% 0.0% 0.5% 98.1% 98.1%
Precision 87.7% 93.9% 95.5% 92.9% 96.2% 95.3%
Confusion matrix of the random forest classification algorithm with the actual sitting position shown in rows and the classified sitting positions in columns. The
correctly classified cases (diagonal elements) are marked in bold. The sitting positions analysed were: upright and reclined together (P1/P2), forward inclined (P3),
laterally tilted right/left (P4/P5), crossed legs right over left/left over right (P6/P7).
C. Bontrup, et al. Applied Ergonomics 81 (2019) 102894
4
5. Page, 2002; Womersley and May, 2006). A reasonable explanation for
this observation could be the so-called “fear-avoidance behaviour”
(Vlaeyen and Linton, 2000) meaning that, for instance, regular move-
ments or positional alternation are reduced or avoided due to fear of
experiencing pain (Vlaeyen et al., 2016).
In this study, a greater association between sitting behaviour and
LBP was found for participants in the chronic LBP and/or related dis-
ability grouping than for those with acute pain/disability. It is therefore
plausible that participants with chronic pain have a higher level of
awareness to pain-free sitting positions and pain provoking movements
compared to individuals affected by acute pain. Such an habitual
awareness could result in fewer transitions between sitting positions as
well as a reduction in small movements, indicating a type of avoidance
learning based on their pain history (Krypotos, 2015). A similar phe-
nomenon was reported by Panhale et al. (2016) who found a strong
correlation between fear-avoidance belief and activity limitation in
patients with chronic LBP; hence reflecting an underestimated impact
of fear avoidance beliefs on the patient‘s behaviour.
Overall, transient periods were lower in participants with chronic
LBP than pain free participants, indicating reduced movement
throughout their working day. Since less frequent postural shifts have
previously been observed among subjects with chronic LBP compared
to healthy participants (Akkarakittichoke and Janwantanakul, 2017), it
is likely that dominant drivers of sitting behaviour may exist that are
related to chronic LBP. Although these results do not allow any con-
clusions nor definite statements to be drawn regarding a possible causal
relationship or adaptational process among individuals with chronic
LBP, a more static sitting behaviour is generally known to have phy-
siological and biological consequences. Sustained pressure under the
buttocks due to prolonged, uninterrupted sitting could be reduced by
varying posture (Søndergaard et al., 2010; Vergara and Page, 2002;
Zemp et al., 2015, 2016c, 2019) by means of e.g. regular pelvis rota-
tions (van Geffen et al., 2008). Moreover, since continuous compression
on an intervertebral disc can result in reduced disc nutrition (Kingma
et al., 2000; Pynt et al., 2001) frequent postural movements are also
recommended through lordosis and kyphosis. In this manner, sufficient
metabolic balance of various musculoskeletal structures can be sup-
ported, including a reduction of ischaemic effects due to prolonged
static sitting (Reenalda et al., 2009; Todd et al., 2007).
O'Sullivan et al. (2013) defined dynamic sitting as “increased mo-
tion in sitting, which is facilitated by the use of specific chairs or
equipment”. However, recent studies have shown that dynamic chair
equipment is not sufficient to affect muscle activation, postures and
core kinematics (Ellegast et al., 2012; O'Sullivan et al., 2013; Grooten
et al., 2017; Kingma and van Dieën, 2009). Therefore, it can be con-
cluded that dynamic sitting should be actively stimulated, which can
then be supported by dynamic chair mechanisms, indicating the re-
quirement for a redefinition of dynamic sitting (Pynt, 2015). Such a
redefinition, however, would require valid information in terms of
movement patterns and positional changes that reflect a normal phy-
siological sitting behaviour, which has not yet been fully established.
In order to enhance a more dynamic sitting behaviour among office
employees, technical devices supporting dynamic sitting have recently
been discussed. Several studies (Haller et al., 2011; Goossens et al.,
2012; Davis and Kotowski, 2014) have demonstrated devices capable of
monitoring behaviour and providing feedback for avoiding discomfort
and musculoskeletal disorders at an early stage, with the aim to change
sitting patterns among office workers. However, Roossien et al. (2017)
reported that tactile feedback integrated into an office chair was unable
to change sitting behaviour, suggesting that such feedback is in-
sufficient for reducing musculoskeletal discomfort of office workers on
a sustained basis. Their study used feedback signals to improve sitting
duration in an “optimal supported posture”, instead of facilitating
regular small movements, for instance. Therefore, tactile input com-
bined with visual features may potentially promote more beneficial
sitting habits than either alone (Straker et al., 2013). The textile
Fig. 2. Bar and box plots of the four different sitting behaviour parameters for the grouping variable CPI (chronic pain intensity) with the corresponding t-test's p-
values and Cohen's effect sizes (d).
Fig. 3. Bar and box plots of the four different sitting behaviour parameters for the grouping variable DISS (chronic pain disability) with the corresponding t-test's p-
values and Cohen's effect sizes (d).
C. Bontrup, et al. Applied Ergonomics 81 (2019) 102894
5
6. pressure mat “sensomative science“ used in the presented study, in-
cludes a corresponding smart phone application providing visual
feedback of the current pressure distribution while sitting. Given fur-
ther development in the application, for instance by enabling regular
tactile or visual feedback to the user (smart phone or watch) to initiate
small movements, could have potential for more dynamic sitting be-
haviour in sedentary office workers.
4.1. Limitations and remarks
In the present study only one working shift per employee was
analysed, which might not comprehensively reflect the complete pat-
terns of sitting behaviour in each individual. Our study aimed to
achieve a general impression of sitting behaviour characteristics among
a sedentary population of office workers. Since call-centre work is
predominantly repetitive and inactive in nature (Thorp et al., 2012;
Toomingas et al., 2012; Straker et al., 2013), call-centre employees
were chosen as the focus group of our study. Indeed, observations
during the ongoing measurements indicated that 95% of the working
shift was indeed seated, except for scheduled breaks of 15–30 min
within a working day – data that is highly consistent with the ob-
servations of Toomingas et al. (2012). This regular schedule indicated
that our participants' work was not only highly sedentary, but also
largely equivalent among all workers, which reduced confounding ef-
fects. It is also important to consider that, contrary to ergonomic
guidelines, office tables and chairs were not ergonomically adjusted to
each individual since the company's structure required regular work-
place rotations within the office. To ensure ecological validity, the re-
searchers did not intervene with the provided chair/table placement or
rotation schedule. Nevertheless, the experimental setup including chair
instrumentation, providing study information as well as the presence of
the investigators could have altered the working routine.
From the results of our study, it seems that levels of LBP in call
centre employees are only partially linked to sitting behaviour itself,
and that the multifactorial nature of LBP is therefore possibly more
associated with sedentary lifestyle or other factors such as job tenure,
daily working hours, general fitness, customer reaction, and psycholo-
gical stress etc. When examining sitting behaviour and its relationship
with LBP, future studies should therefore consider these confounding
variables, as well as different levels of pain intensity on a more con-
tinual scale. Since our study mainly analysed participants exhibiting on
average low to medium back pain as well as pain related disability, such
a detailed classification was not included and should therefore be ad-
dressed in future studies. An alternative classification of individuals
with non-specific LBP can define subgroups similar to those presented
by O'Sullivan (2005), distinguishing between mechanically and non-
mechanically triggered pain. In this way, different pain drivers can be
considered when analysing the relationship between sitting behaviour
and LBP.
Due to the highly sedentary working conditions, call-centre em-
ployees are at particular risk of developing musculoskeletal disorders.
As a result, these population-related characteristics need to be carefully
considered when generalising these findings to the majority of office
workers.
5. Conclusion
With scientific discussion to date leading to unclear relationships
between sedentary lifestyle, sitting behaviour, and low back pain, we
have provided standardised (real-world) conditions to investigate
whether sitting behaviour and LBP are inherently linked. Our results
show a possible trend towards more static sitting behaviour among call-
centre workers with chronic LBP pain and pain related disability. A
greater association was found between sitting behaviour and chronic
LBP than for acute pain/disability, which was a possible result of the
fact that participants with chronic pain have a higher level of awareness
to pain-free sitting positions and pain provoking movements compared
to individuals affected by acute pain.
Appendix
Table A1
Descriptive statistics of the different parameter of sitting behaviour (SitBePar, N ˆ ,
move Nˆ
pos , t ˆ
stable , P
transient) of the four pain groupings (CPI, DISS, BPISeverity,
BPIInterfere).
Parameter Subgroups Mean SD Min Max
CPI SitBePar A: CPI = 0 0.40 0.92 −1.90 1.73
B: CPI > 0 −0.15 0.98 −2.99 1.91
N ˆ
move [h−1
] A: CPI = 0 97.68 22.14 46.19 127.39
B: CPI > 0 88.28 23.36 29.91 127.25
Nˆ
pos [h−1
] A: CPI = 0 12.58 6.12 1.10 20.07
B: CPI > 0 10.47 6.87 1.51 30.63
t ˆ
stable [s] A: CPI = 0 26.59 14.27 11.77 69.68
B: CPI > 0 34.75 18.76 12.19 112.44
Ptransient [%] A: CPI = 0 35.23 14.55 10.60 65.30
B: CPI > 0 25.69 11.69 6.59 56.90
DISS SitBePar A: DISS = 0 0.28 0.85 −1.90 1.73
B: DISS > 0 −0.17 1.05 −2.99 1.91
N ˆ
move [h−1
] A: DISS = 0 96.47 20.53 46.19 127.39
B: DISS > 0 88.23 24.88 29.91 134.49
Nˆ
pos [h−1
] A: DISS = 0 11.76 5.93 1.10 20.07
B: DISS > 0 10.46 7.08 1.51 30.63
t ˆ
stable [s] A: DISS = 0 27.38 12.54 11.77 69.68
B: DISS > 0 35.38 19.92 12.19 112.44
Ptransient [%] A: DISS = 0 32.75 13.81 10.60 65.30
B: DISS > 0 25.64 12.28 6.59 56.90
(continued on next page)
C. Bontrup, et al. Applied Ergonomics 81 (2019) 102894
6
7. Table A1 (continued)
Parameter Subgroups Mean SD Min Max
BPISeverity SitBePar A: BPISeverity = 0 0.03 1.03 −2.99 1.73
B: BPISeverity > 0 −0.09 0.97 −2.12 1.91
N ˆ
move [h−1
] A: BPISeverity = 0 90.66 23.88 29.91 127.39
B: BPISeverity > 0 90.76 23.81 39.03 134.49
Nˆ
pos [h−1
] A: BPISeverity = 0 11.35 5.78 1.10 20.07
B: BPISeverity > 0 9.77 6.44 1.51 23.88
t ˆ
stable [s] A: BPISeverity = 0 32.53 20.26 11.77 112.44
B: BPISeverity > 0 32.99 16.18 12.19 82.88
Ptransient [%] A: BPISeverity = 0 29.56 13.82 6.59 65.30
B: BPISeverity > 0 26.64 12.73 10.15 56.90
BPIInterfere SitBePar A: BPIInterfere = 0 0.15 1.07 −2.99 1.91
B: BPIInterfere > 0 −0.14 0.92 −2.12 1.53
N ˆ
move [h−1
] A: BPIInterfere = 0 93.33 24.02 29.91 127.39
B: BPIInterfere > 0 89.55 23.28 39.03 134.49
Nˆ
pos [h−1
] A: BPIInterfere = 0 12.57 6.23 3.18 23.88
B: BPIInterfere > 0 9.51 6.77 1.10 31.63
t ˆ
stable [s] A: BPIInterfere = 0 31.13 19.79 11.77 112.44
B: BPIInterfere > 0 33.48 16.16 13.39 82.88
Ptransient [%] A: BPIInterfere = 0 30.55 13.89 6.59 65.30
B: BPIInterfere > 0 26.32 12.48 10.15 49.99
References
Aarås, A., Horgen, G., Ro, O., 2000. Work with the visual display unit: health con-
sequences. Int. J. Hum. Comput. Interact. 12, 107–134. https://doi.org/10.1207/
S15327590IJHC1201_5.
Akkarakittichoke, N., Janwantanakul, P., 2017. Seat pressure distribution characteristics
during 1 hour sitting in office workers with and without chronic low back pain. Saf.
Health Work 8, 212–219. https://doi.org/10.1016/j.shaw.2016.10.005.
Ayanniyi, O., Ukpai, B., Adeniyi, A., 2010. Differences in prevalence of self-reported
musculoskeletal symptoms among computer and non-computer users in a Nigerian
population: a cross-sectional study. BMC Muscoskelet. Disord. 11. https://doi.org/
10.1186/1471-2474-11-177.
Bakker, E.W.P., Verhagen, A.P., van Trijffel, E., Lucas, C., Koes, B.W., 2009. Spinal me-
chanical load as a risk factor for low back pain: a systematic review of prospective
cohort studies. Spine 34, E281–E293. https://doi.org/10.1097/BRS.
0b013e318195b257.
Baumgartner, D., Zemp, R., List, R., Stoop, M., Naxera, J., Elsig, J.P., Lorenzetti, S., 2012.
The spinal curvature of three different sitting positions analysed in an open MRI
scanner. Sci. World J. 1–7. 2012. https://doi.org/10.1100/2012/184016.
Callaghan, J.P., McGill, S.M., 2001. Low back joint loading and kinematics during
standing and unsupported sitting. Ergonomics 44, 280–294. https://doi.org/10.
1080/00140130010008110.
Chen, S.-M., Liu, M.-F., Cook, J., Bass, S., Lo, S.K., 2009. Sedentary lifestyle as a risk factor
for low back pain: a systematic review. Int. Arch. Occup. Environ. Health 82,
797–806. https://doi.org/10.1007/s00420-009-0410-0.
Cho, C.-Y., Hwang, Y.-S., Cherng, R.-J., 2012. Musculoskeletal symptoms and associated
risk factors among office workers with high workload computer use. J. Manip.
Physiol. Ther. 35, 534–540. https://doi.org/10.1016/j.jmpt.2012.07.004.
Claus, A.P., Hides, J.A., Moseley, G.L., Hodges, P.W., 2016. Thoracic and lumbar posture
behaviour in sitting tasks and standing: progressing the biomechanics from ob-
servations to measurements. Appl. Ergon. 53, 161–168. https://doi.org/10.1016/j.
apergo.2015.09.006.
Claus, A.P., Hides, J.A., Moseley, G.L., Hodges, P.W., 2009. Is ‘ideal’ sitting posture real?:
measurement of spinal curves in four sitting postures. Man. Ther. 14, 404–408.
https://doi.org/10.1016/j.math.2008.06.001.
Coenen, P., Gilson, N., Healy, G.N., Dunstan, D.W., Straker, L.M., 2017. A qualitative
review of existing national and international occupational safety and health policies
relating to occupational sedentary behaviour. Appl. Ergon. 60, 320–333. https://doi.
org/10.1016/j.apergo.2016.12.010.
Collins, J.D., O'Sullivan, L.W., 2015. Musculoskeletal disorder prevalence and psycho-
social risk exposures by age and gender in a cohort of office based employees in two
academic institutions. Int. J. Ind. Ergon. 46, 85–97. https://doi.org/10.1016/j.ergon.
2014.12.013.
da Costa, B.R., Vieira, E.R., 2009. Risk factors for work-related musculoskeletal disorders:
a systematic review of recent longitudinal studies. Am. J. Ind. Med. 53 (3), 285–323.
https://doi.org/10.1002/ajim.20750.
Daut, R.L., Cleeland, C.S., Flanery, R.C., 1983. Development of the Wisconsin Brief Pain
Questionnaire to assess pain in cancer and other diseases. Pain 17, 197–210. https://
doi.org/10.1016/0304-3959(83)90143-4.
Davis, K.G., Kotowski, S.E., 2014. Postural variability: an effective way to reduce mus-
culoskeletal discomfort in office work. Hum. Factors J. Hum. Factors Ergon. Soc. 56,
1249–1261. https://doi.org/10.1177/0018720814528003.
Dunk, N.M., Callaghan, J.P., 2005. Gender-based differences in postural responses to
seated exposures. Clin. Biomech. 20, 1101–1110. https://doi.org/10.1016/j.
clinbiomech.2005.07.004.
Ellegast, R.P., Kraft, K., Groenesteijn, L., Krause, F., Berger, H., Vink, P., 2012.
Comparison of four specific dynamic office chairs with a conventional office chair:
impact upon muscle activation, physical activity and posture. Appl. Ergon. 43,
296–307. https://doi.org/10.1016/j.apergo.2011.06.005.
Goossens, R., Netten, M., Van der Doelen, B., 2012. An office chair to influence the sitting
behavior of office workers. Work 2086–2088. https://doi.org/10.3233/WOR-2012-
0435-2086.
Groenesteijn, L., Ellegast, R.P., Keller, K., Krause, F., Berger, H., de Looze, M.P., 2012.
Office task effects on comfort and body dynamics in five dynamic office chairs. Appl.
Ergon. 43, 320–328. https://doi.org/10.1016/j.apergo.2011.06.007.
Grooten, W.J.A., Äng, B.O., Hagströmer, M., Conradsson, D., Nero, H., Franzén, E., 2017.
Does a dynamic chair increase office workers' movements? – results from a combined
laboratory and field study. Appl. Ergon. 60, 1–11. https://doi.org/10.1016/j.apergo.
2016.10.006.
Hadgraft, N.T., Lynch, B.M., Clark, B.K., Healy, G.N., Owen, N., Dunstan, D.W., 2015.
Excessive sitting at work and at home: correlates of occupational sitting and TV
viewing time in working adults. BMC Public Health 15. https://doi.org/10.1186/
s12889-015-2243-y.
Haller, M., Richter, C., Brandl, P., Gross, S., Schossleitner, G., Schrempf, A., Nii, H.,
Sugimoto, M., Inami, M., 2011. Finding the right way for interrupting people im-
proving their sitting posture. In: Campos, P., Graham, N., Jorge, J., Nunes, N.,
Palanque, P., Winckler, M. (Eds.), Human-Computer Interaction – INTERACT 2011.
Springer Berlin Heidelberg, Berlin, Heidelberg, pp. 1–17. https://doi.org/10.1007/
978-3-642-23771-3_1.
Hartvigsen, J., Leboeuf-Yde, C., Lings, S., Corder, E.H., 2000. Review Article: is sitting-
while-at-work associated with low back pain? A systematic, critical literature review.
Scand. J. Publ. Health 28, 230–239. https://doi.org/10.1177/
14034948000280030201.
Hoy, D., Brooks, P., Blyth, F., Buchbinder, R., 2010. The Epidemiology of low back pain.
Best Pract. Res. Clin. Rheumatol. 24, 769–781. https://doi.org/10.1016/j.berh.2010.
10.002.
Jans, M.P., Proper, K.I., Hildebrandt, V.H., 2007. Sedentary behavior in Dutch workers.
Am. J. Prev. Med. 33, 450–454. https://doi.org/10.1016/j.amepre.2007.07.033.
Johnson, S., Cooper, C., Cartwright, S., Donald, I., Taylor, P., Millet, C., 2005. The ex-
perience of work-related stress across occupations. J. Manag. Psychol. 20, 178–187.
https://doi.org/10.1108/02683940510579803.
Kamiya, Kazuhiro, Kudo, Mineichi, Nonaka, Hidetoshi, Toyama, Jun, 2008. Sitting
Posture Analysis by Pressure Sensors 1–4. https://doi.org/10.1109/ICPR.2008.
4761863.
Kingma, I., van Dieën, J.H., 2009. Static and dynamic postural loadings during computer
work in females: sitting on an office chair versus sitting on an exercise ball. Appl.
Ergon. 40, 199–205. https://doi.org/10.1016/j.apergo.2008.04.004.
Kingma, I., van Dieën, J.H., Nicolay, K., Maat, J.J., Weinans, H., 2000. Monitoring water
content in deforming intervertebral disc tissue by finite element analysis of MRI data.
Magn. Reson. Med. 44, 650–654.
Krypotos, A.-M., 2015. Avoidance learning: a review of theoretical models and recent
developments. Front. Behav. Neurosci. 9. https://doi.org/10.3389/fnbeh.2015.
00189.
Kwon, B.K., Roffey, D.M., Bishop, P.B., Dagenais, S., Wai, E.K., 2011. Systematic review:
occupational physical activity and low back pain. Occup. Med. 61, 541–548. https://
doi.org/10.1093/occmed/kqr092.
Lis, A.M., Black, K.M., Korn, H., Nordin, M., 2007. Association between sitting and oc-
cupational LBP. Eur. Spine J. 16, 283–298. https://doi.org/10.1007/s00586-006-
0143-7.
C. Bontrup, et al. Applied Ergonomics 81 (2019) 102894
7
8. Nöllenheidt, C., Brenscheidt, S., 2016. Arbeitswelt im Wandel Zahlen – Daten – Fakten
Ausgabe 2016. Bundesanstalt für Arbeitsschutz und Arbeitsmedizin (BAuA).
(Dortmund).
Norman, K., Nilsson, T., Hagberg, M., Tornqvist, E.W., Toomingas, A., 2004. Working
conditions and health among female and male employees at a call center in Sweden.
Am. J. Ind. Med. 46, 55–62. https://doi.org/10.1002/ajim.20039.
Oh, H., Park, H., Boo, S., 2017. Mental health status and its predictors among call center
employees: a cross-sectional study: mental health in call center employees. Nurs.
Health Sci. 19, 228–236. https://doi.org/10.1111/nhs.12334.
O'Keeffe, M., Dankaerts, W., O'Sullivan, P., O'Sullivan, L., O'Sullivan, K., 2013. Specific
flexion-related low back pain and sitting: comparison of seated discomfort on two
different chairs. Ergonomics 56, 650–658. https://doi.org/10.1080/00140139.2012.
762462.
O'Sullivan, K., McCarthy, R., White, A., O'Sullivan, L., Dankaerts, W., 2012a. Lumbar
posture and trunk muscle activation during a typing task when sitting on a novel
dynamic ergonomic chair. Ergonomics 55, 1586–1595. https://doi.org/10.1080/
00140139.2012.721521.
O'Sullivan, K., O'Keeffe, M., O'Sullivan, L., O'Sullivan, P., Dankaerts, W., 2012b. The effect
of dynamic sitting on the prevention and management of low back pain and low back
discomfort: a systematic review. Ergonomics 55, 898–908. https://doi.org/10.1080/
00140139.2012.676674.
O'Sullivan, K., O'Sullivan, P., O'Keeffe, M., O'Sullivan, L., Dankaerts, W., 2013. The effect
of dynamic sitting on trunk muscle activation: a systematic review. Appl. Ergon. 44,
628–635. https://doi.org/10.1016/j.apergo.2012.12.006.
O'Sullivan, P., 2005. Diagnosis and classification of chronic low back pain disorders:
maladaptive movement and motor control impairments as underlying mechanism.
Man. Ther. 10, 242–255. https://doi.org/10.1016/j.math.2005.07.001.
Panhale, V., Gurav, R., Nahar, S., 2016. Association of physical performance and fear-
avoidance beliefs in adults with chronic low back pain. Ann. Med. Health Sci. Res. 6,
375. https://doi.org/10.4103/amhsr.amhsr_331_15.
Pynt, J., 2015. Rethinking design parameters in the search for optimal dynamic seating. J.
Bodyw. Mov. Ther. 19, 291–303. https://doi.org/10.1016/j.jbmt.2014.07.001.
Pynt, J., Higgs, J., Mackey, M., 2001. Seeking the optimal posture of the seated lumbar
spine. Physiother. Theory Pract. 17, 5–21. https://doi.org/10.1080/
09593980151143228.
Radbruch, L., Loick, G., Kiencke, P., Lindena, G., Sabatowski, R., Grond, S., Lehmann,
K.A., Cleeland, C.S., 1999. Validation of the German version of the Brief pain in-
ventory. J. Pain Symptom Manag. 18, 180–187. https://doi.org/10.1016/S0885-
3924(99)00064-0.
Reenalda, J., Van Geffen, P., Nederhand, M., Jannink, M., IJzerman, M., Rietman, H.,
2009. Analysis of healthy sitting behavior: interface pressure distribution and sub-
cutaneous tissue oxygenation. J. Rehabil. Res. Dev. 46, 577. https://doi.org/10.
1682/JRRD.2008.12.0164.
Roossien, C.C., Stegenga, J., Hodselmans, A.P., Spook, S.M., Koolhaas, W., Brouwer, S.,
Verkerke, G.J., Reneman, M.F., 2017. Can a smart chair improve the sitting behavior
of office workers? Appl. Ergon. 65, 355–361. https://doi.org/10.1016/j.apergo.2017.
07.012.
Ryan, C.G., Dall, P.M., Granat, M.H., Grant, P.M., 2011. Sitting patterns at work: objective
measurement of adherence to current recommendations. Ergonomics 54, 531–538.
https://doi.org/10.1080/00140139.2011.570458.
Saidj, M., Menai, M., Charreire, H., Weber, C., Enaux, C., Aadahl, M., Kesse-Guyot, E.,
Hercberg, S., Simon, C., Oppert, J.-M., 2015. Descriptive study of sedentary beha-
viours in 35,444 French working adults: cross-sectional findings from the ACTI-Cités
study. BMC Public Health 15. https://doi.org/10.1186/s12889-015-1711-8.
Søndergaard, K.H.E., Olesen, C.G., Søndergaard, E.K., de Zee, M., Madeleine, P., 2010.
The variability and complexity of sitting postural control are associated with dis-
comfort. J. Biomech. 43, 1997–2001. https://doi.org/10.1016/j.jbiomech.2010.03.
009.
Sprigg, C.A., Stride, C.B., Wall, T.D., Holman, D.J., Smith, P.R., 2007. Work character-
istics, musculoskeletal disorders, and the mediating role of psychological strain: a
study of call center employees. J. Appl. Psychol. 92, 1456–1466. https://doi.org/10.
1037/0021-9010.92.5.1456.
Srinivasan, D., Mathiassen, S.E., 2012. Motor variability in occupational health and
performance. Clin. Biomech. 27, 979–993. https://doi.org/10.1016/j.clinbiomech.
2012.08.007.
Straker, L., Abbott, R.A., Heiden, M., Mathiassen, S.E., Toomingas, A., 2013. Sit–stand
desks in call centres: associations of use and ergonomics awareness with sedentary
behavior. Appl. Ergon. 44, 517–522. https://doi.org/10.1016/j.apergo.2012.11.001.
Straker, L., Mathiassen, S.E., 2009. Increased physical work loads in modern work – a
necessity for better health and performance? Ergonomics 52, 1215–1225. https://doi.
org/10.1080/00140130903039101.
Subramanian, S., Arun, B., 2017. Risk factor Analysis in sedentary office workers with low
back pain. J. Chalmeda Anand Rao Inst. Med. Sci. 13.
Thorp, A.A., Healy, G.N., Winkler, E., Clark, B.K., Gardiner, P.A., Owen, N., Dunstan,
D.W., 2012. Prolonged sedentary time and physical activity in workplace and non-
work contexts: a cross-sectional study of office, customer service and call centre
employees. Int. J. Behav. Nutr. Phys. Act. 9, 128. https://doi.org/10.1186/1479-
5868-9-128.
Todd, A., Bennett, A., Christie, C., 2007. Physical implications of prolonged sitting in a
confined posture - a literature review. J. Ergon. Soc. South Afr. 19, 7–21.
Toomingas, A., Forsman, M., Mathiassen, S.E., Heiden, M., Nilsson, T., 2012. Variation
between seated and standing/walking postures among male and female call centre
operators. BMC Public Health 12. https://doi.org/10.1186/1471-2458-12-154.
van Deursen, D.L., Lengsfeld, M., Snijders, C.J., Evers, J.J.M., Goossens, R.H.M., 2000.
Mechanical effects of continuous passive motion on the lumbar spine in seating. J.
Biomech. 33, 695–699. https://doi.org/10.1016/S0021-9290(99)00231-6.
van Dieën, J.H., De Looze, M.P., Hermans, V., 2001. Effects of dynamic office chairs on
trunk kinematics, trunk extensor EMG and spinal shrinkage. Ergonomics 44,
739–750. https://doi.org/10.1080/00140130120297.
van Geffen, P., Reenalda, J., Veltink, P.H., Koopman, B.F.J.M., 2008. Effects of sagittal
postural adjustments on seat reaction load. J. Biomech. 41, 2237–2245. https://doi.
org/10.1016/j.jbiomech.2008.04.012.
Vergara, M., Page, A., 2002. Relationship between comfort and back posture and mobility
in sitting-posture. Appl. Ergon. 33, 1–8.
Vlaeyen, J.W., Linton, S.J., 2000. Fear-avoidance and its consequences in chronic mus-
culoskeletal pain: a state of the art. Pain 85, 317–332.
Vlaeyen, J.W.S., Crombez, G., Linton, S.J., 2016. The Fear-Avoidance Model of Pain:
PAIN 157, 1588–1589. https://doi.org/10.1097/j.pain.0000000000000574.
Von Korff, M., Ormel, J., Keefe, F.J., Dworkin, S.F., 1992. Grading the severity of chronic
pain. Pain 50, 133–149. https://doi.org/10.1016/0304-3959(92)90154-4.
Vos, T., Allen, C., Arora, M., Barber, R.M., Bhutta, Z.A., Brown, A., et al., 2016. Global,
regional, and national incidence, prevalence, and years lived with disability for 310
diseases and injuries, 1990–2015: a systematic analysis for the Global Burden of
Disease Study 2015. The Lancet 388, 1545–1602. https://doi.org/10.1016/S0140-
6736(16)31678-6.
Waongenngarm, P., Rajaratnam, B.S., Janwantanakul, P., 2015. Perceived body dis-
comfort and trunk muscle activity in three prolonged sitting postures. J. Phys. Ther.
Sci. 27, 2183–2187. https://doi.org/10.1589/jpts.27.2183.
Wieser, S., Horisberger, B., Schmidhauser, S., Eisenring, C., Brügger, U., Ruckstuhl, A.,
Dietrich, J., Mannion, A.F., Elfering, A., Tamcan, Ö., Müller, U., 2011. Cost of low
back pain in Switzerland in 2005. Eur. J. Health Econ. 12, 455–467. https://doi.org/
10.1007/s10198-010-0258-y.
Womersley, L., May, S., 2006. Sitting posture of subjects with postural backache. J.
Manip. Physiol. Ther. 29, 213–218. https://doi.org/10.1016/j.jmpt.2006.01.002.
Yamada, M., Kamiya, K., Kudo, M., Nonaka, H., Toyama, J., 2009. Soft authentication and
behavior analysis using a chair with sensors attached: hipprint authentication.
Pattern Anal. Appl. 12, 251–260. https://doi.org/10.1007/s10044-008-0124-z.
Zemp, R., Fliesser, M., Wippert, P.-M., Taylor, W.R., Lorenzetti, S., 2016a. Occupational
sitting behaviour and its relationship with back pain – a pilot study. Appl. Ergon. 56,
84–91. https://doi.org/10.1016/j.apergo.2016.03.007.
Zemp, R., Rhiner, J., Plüss, S., Togni, R., Plock, J.A., Taylor, W.R., 2019. Wheelchair tilt in
space and recline functions – influence on sitting interface pressure and ischial blood
flow in an elderly population. BioMed Res. Int. 2019 In Revision.
Zemp, R., Tanadini, M., Plüss, S., Schnüriger, K., Singh, N.B., Taylor, W.R., Lorenzetti, S.,
2016b. Application of machine learning approaches for classifying sitting posture
based on force and acceleration sensors. BioMed Res. Int. 1–9. 2016. https://doi.org/
10.1155/2016/5978489.
Zemp, R., Taylor, W.R., Lorenzetti, S., 2016c. Seat pan and backrest pressure distribution
while sitting in office chairs. Appl. Ergon. 53, 1–9. https://doi.org/10.1016/j.apergo.
2015.08.004.
Zemp, R., Taylor, W.R., Lorenzetti, S., 2015. Are pressure measurements effective in the
assessment of office chair comfort/discomfort? A review. Appl. Ergon. 48, 273–282.
https://doi.org/10.1016/j.apergo.2014.12.010.
Zemp, R., Taylor, W.R., Lorenzetti, S., 2013. In vivo spinal posture during upright and
reclined sitting in an office chair. BioMed Res. Int. 1–5. 2013. https://doi.org/10.
1155/2013/916045.
C. Bontrup, et al. Applied Ergonomics 81 (2019) 102894
8