SlideShare a Scribd company logo
1 of 53
Download to read offline
WHAT IF...
energy accountability series
UNITED STATES EUROPEAN UNION
THE UNITED STATES WAS FORCED TO
PAY EU ENERGY PRICES?
OUR MISSION
The mission of the U.S. Chamber of Commerce’s Institute for 21st Century Energy is to unify policymakers, regulators,
business leaders, and the American public behind a common sense energy strategy to help keep America secure,
prosperous, and clean. Through policy development, education, and advocacy, the Institute is building support for
meaningful action at the local, state, national, and international levels.
The U.S. Chamber of Commerce is the world’s largest business federation representing the interests of more than
3 million businesses of all sizes, sectors, and regions, as well as state and local chambers and industry associations.
Copyright © 2013 by the United States Chamber of Commerce. All rights reserved. No part of this publication may be reproduced or transmitted
in any form—print, electronic, or otherwise—without the express written permission of the publisher.
This paper marks the third in a series of reports that we will be releasing this fall, each taking a
substantive look at what might have happened in the past – or could happen in the future – if certain
energy-related ideas and policy prescriptions put forth by prominent politicians and their supporters
were actually adopted. We’re calling it the Energy Accountability Series.
Certainly, one doesn’t need to look far these days to find platforms or outlets that claim to be definitive
“fact-checkers” of all manner of utterances candidates make on the campaign trail. On that, the Energy
Accountability Series will not seek to reinvent the wheel. What we are much more interested in – and
what we think will be much more valuable to voters, as well – is taking a step back to better understand
(and quantify where possible) the real-world, economy-wide consequences of living in a world in which
candidates’ rhetoric on critical energy issues were to become reality.
Too often, there is a temptation to dismiss statements made by candidates as things said “off the cuff,”
or in the “heat of the moment,” or offered up merely to “appeal to their base.”This is incredibly cynical,
and it needs to change. A candidate’s views and the things he or she says and does to win the support of
interest groups have a real impact on how policy is shaped, and ultimately implemented.
That is especially true on energy issues today, as groups continue to advance a “Keep It In the Ground”
agenda that, if adopted, would force our country to surrender the enormous domestic benefits and clear,
global competitive advantages that increased energy development here at home have made possible.
Accordingly, candidates and public opinion leaders should be taken at their word, and this series will
evaluate what those words would mean for America.
The Energy Accountability Series will ask the tough questions and provide quantitative, clear-eyed
answers on the full impacts and implications of these policies, and it will do so irrespective of which
candidates, groups or political parties happen to support or oppose them. Our hope is that these reports
help promote and inform a fact-based debate of the critical energy issues facing our country. Armed with
this information, voters will have the opportunity this fall to make the right choices for themselves and
their families.
energy accountability series
About the
Copyright © 2016 by the United States Chamber of Commerce. All rights reserved. No part of this publication may be
reproduced or transmitted in any form—print, electronic, or otherwise—without the express written permission of the publisher.
With the presidential election just around the
corner, voters are trying to better understand
the practical implications of the various policy
ideas and proposals being put forth. Over the
course of the campaign, some interest groups
have sought to persuade candidates to support
implementing European-style energy policies
in the United States. And, at least on some
level, it appears that effort has been successful,
with a number of candidates today making
explicit statements in support of the kind of
government controls over energy production
and consumption that exist today in the
European Union (EU).
For example, U.S. Sen. Bernie Sanders
structured his entire energy and environmental
policy platform around the adoption of a carbon
dioxide reduction plan taken directly from the
EU, promising a 40 percent cut in emissions
below 1990 levels by 2030. Secretary Hillary
Clinton, the Democratic nominee, has vowed
to “stop fossil fuels” from being produced on
federal lands, and her party’s platform supports
a federal renewable electricity mandate of 50
percent by 2027. This goes well beyond anything
proposed by the current administration, and
even exceeds the EU’s renewable energy target
of 27 percent by 2030.
The trend toward European-style policies across
a range of different issues (especially energy)
was best summarized by Sanders during a
debate earlier this year in Las Vegas.“I think,”
he said, that “we should look to countries like
Denmark, like Sweden, and Norway and learn
from what they have accomplished.”
Later, at Sanders’s insistence, environmental
activist Bill McKibben – a staunch opponent
of fossil fuels – was appointed to the platform
committee of the Democratic National
Convention. Among other things, McKibben
has called on the federal government to “raise
the price of fossil fuels” to make the U.S.“look
more like Denmark” and praised Germany for
implementing a solar energy policy that “has
nothing to do with technology or location – it’s
all political will.”
With high taxes, restrictive environmental
policies, and a heavy reliance on imports,
EU businesses and residents pay more than
U.S. consumers for electricity, natural gas,
motor fuel, and just about every other form of
consumable energy. Energy prices play a large
part in the performance and competitiveness of
the overall economy. High energy prices have a
negative impact on the economy – from lower
gross domestic product (GDP) growth to fewer
jobs and decreased household income.
What if the U.S. was Forced to Pay EU Prices
for Its Energy?
One European business leader summed up
European’s dire energy situation this way: “I can
see green taxes, I can see no shale gas, I can
see closure of nuclear, I can see manufacturing
being driven away. I can see the competition
authorities in Brussels blissfully unaware of
the tsunami of imported product heading this
way and standing blindly in the way of sensible
restructuring . . . It’s not looking good for
Europe, we are rabbits caught in the headlights,
and we have got our trousers down.”
The goal of this study, and others to follow it,
is to help public audiences better understand
and visualize how our country, our economy
and their own individual households might be
impacted under a scenario in which candidates’
statements and positions as they relate to
this issue were converted into policy and
implemented on a national basis.
Below are just a few examples of the political
rhetoric we continue to see and hear from those
who seek to make energy harder to find and
more expensive to consume – just like it is in
Europe:
The easiest thing to do is raise the price of fossil fuels.
If that had been done decades ago in the U.S., it would
look more like Denmark ...”
Bill McKibben, founder of 350.org & DNC platform committee member; Feb. 15, 2016
“If the tax on gasoline were higher, people would alter their behavior
to drive less … [A] tax exceeding $2 a gallon makes sense.
Gregory Mankiw, former chairman, Council of Economic Advisers, Jan. 21, 2012
The $10 price per barrel is still just a fraction of the cost carbon
imposes on our country, but it’s a start.”
350.org, Feb. 4, 2016
“The Clean Power Plan is likely to transform the US power industry
just as [renewable energy] targets have radically changed the
European energy landscape.
Gerard Reid, Adjunct Prof. of Business, Imperial College London, April 8, 2015
And think of what’s happening in countries like Spain [and]
Germany … where they’re making real investments in renewable
energy. They’re surging ahead of us … There is no reason we can’t
do the same thing right here in America.”
President-elect Barack Obama, Jan. 19, 2009
I think we should look to countries like Denmark, like Sweden and
Norway, and learn from what they have accomplished.”
U.S. Sen. Bernie Sanders (D-Vt); Oct. 13, 2015
“Somehow we have to figure out how to boost
the price of gasoline to the levels in Europe.
Steven Chu, Former U.S. Energy Secretary, Dec. 12, 2008
“
“
“
“
”
”
”
3
Contents
Executive Summary
EU Policy Review
Energy Price Comparison:
United States vs. EU
Macroeconomic Review
Scenario Analysis:
Energy Price Impact1
Technical Appendix
State-Level Analyses
(CO, IL, IN, MI, FL, OH, WI)
3
5
11
15
21
29
39
1
1
EXECUTIVE
SUMMARY
2
Over the past several years, some interest
groups have argued in favor of implementing
European-style energy policies in the United
States—a notion that dates back to the
beginning of the Obama administration. Over
time, these efforts have led to leading political
candidates today making explicit statements in
support of the kind of government controls over
energy production and consumption that exist
today in the European Union (EU).1
As a result of the policies imposed by European
governments, residents of EU member
countries pay significantly higher prices than
U.S. consumers for every type of energy they
consume. In recognition of this reality, and set
against the backdrop of a political season in
which candidates have looked to the EU for
energy policy inspiration, the question we seek
to answer in this report is: What would happen
to U.S. households, businesses and the broader
economy if Europe’s energy policies and prices
were imposed here?
There are large differences between the EU and
the United States in the way energy is accessed,
delivered, transported, taxed, and regulated. The
Energy Institute’s analysis identifies four key
factors, detailed in the report, that conspire to
make energy more costly to consume in Europe
and much harder to produce relative to the
United States:
•	 Wholesale restrictions in place in EU
countries that inhibit access to low-cost,
existing electricity supply and potentially
abundant upstream oil and natural gas
supplies;
•	 More generous subsidies provided by
EU members for otherwise uneconomic
alternative technologies;
•	 EU policies in place that impose a tax or fee
on carbon emissions; and
•	 Much higher taxes on energy consumption
in the EU
Taken together, these four factors have held the
European economy back and given the United
States (and other low-cost energy countries)
a major advantage in the global marketplace.
In fact, the Energy Institute’s analysis found
European electricity, natural gas, and motor fuel,
energy prices over the past several years have
ranged from between 1.6 to 2.4 times greater
than U.S. prices per unit of energy consumed.
The IMPLAN model was used to help determine
how these policy differences might affect key
performance components of the U.S. economy if
they were implemented here.
European energy policies and prices would impose
a $676 billion drag on the U.S. residential sector and
a $31 billion hit to the industrial sector on an annual
basis, based on 2014 data.
The average American household would be forced to
pay $4,800 more per year (or $400 per month) for
their energy than they do today
The increase in residential energy prices would have
the effect of eliminating the equivalent of 7.7 million
jobs in the United States, owing to depressed demand
for labor. Separately, another 273,000 jobs would be
lost due to the increase in industrial energy prices; and
Lost labor income tied to the increase in residential
energy prices would total $364 billion, in addition
to a $17 billion loss on the industrial side – again, all
on annual basis.
KEY FINDINGS
3
STATE-LEVEL IMPACTS
In addition to modeling the aggregate impacts
of these European policies and prices on the
U.S. economy, the Energy Institute selected
a number of states with significant industrial
and manufacturing activity to illustrate how
energy costs comparable to those in the EU
might look and feel on a more local and regional
level. The six states we modeled that fit this
description are: Colorado, Illinois, Indiana,
Michigan, Ohio and Wisconsin. Additionally, we
conducted impact-modeling on a seventh state,
Florida, to evaluate how energy cost-increases
could affect that state’s large fixed-income
population.
Using IMPLAN’s state-level macroeconomic
mode to estimate the impacts of a residential
price increase to the EU level, we estimate
that each of these states would lose billions
of dollars in state GDP and labor income, and
hemorrhage tens of thousands of jobs. These
state-level impacts are summarized in Table 1.
In addition to the residential sector impacts
described above, the Energy Institute examined
the potential “economic value at risk” for the top
25 energy-intensive industries in these states.
Here, we define economic value at risk as the
total economic contribution that an industry
provides, inclusive of multiplier (i.e., ripple)
effects.
Table 2 depicts the economic value at risk more
broadly if the top 25 energy-intensive industries
were to disappear or be significantly adversely
impacted in the states we examined.
As this analysis shows, Europe provides a
cautionary tale. Regulatory structures --
including the Emissions Trading System, taxes,
user fees, large subsidies, and mandates -- all
conspire to make Europe’s energy prices among
the highest in the world. Exorbitant energy prices
are turning Europe’s energy-intensive industries
into endangered species, and they would do the
same thing here if given the chance.
Table 1: State Level Impact from Residential & Industrial Energy Price Increase (2014)
Table 2: State-level Economic Value at Risk of the Top 25 Energy-Intensive Sectors (2014)
Economic Impact Colorado Florida Illinois Indiana Michigan Ohio Wisconsin
Lost State GDP (billions) $6.8 $28.5 $17.4 $7.8 $11.9 $14.8 $6.3
Lost Labor Income
(billions)
$3.9 $15.9 $9.9 $4.3 $6.8 $8.2 $3.5
Lost Annual Employment
(FTE – 1,000s)
84.2 377.4 201.2 104.1 159.6 187.2 81.5
Annual Energy Cost
Increase (per household)
$4,730 $4,980 $5,230 $5,450 $5,310 $5,000 $4,720
Economic Impact Colorado Florida Illinois Indiana Michigan Ohio Wisconsin
State GDP (billions) $11.7 $31.7 $48.9 $60.3 $52.2 $57.2 $40.6
Labor Income (billions) $6.8 $18.2 $30.6 $26.2 $31.5 $29.9 $25.1
Annual Employment
(FTE – 1,000s)
115.7 338.8 492.9 427.2 521.0 512.8 447.8
4
CITATIONS
1 	 For purposes of this report, our analysis is focused on the aggregate of the 28 countries included in the EU. For
a list of all 28 countries, see: https://www.gov.uk/eu-eea
5
1CHAPTER
EU POLICY REVIEW
6
Electricity, natural gas, and motor fuel prices
are in each case higher – and, in some cases,
significantly higher – in EU countries than they
are in the United States. Upon closer review,
there are four main drivers that largely explain
this phenomenon:
1.	 Wholesale restrictions in the EU
on access to low-cost, existing
electricity supply and potentially
abundant upstream oil and
natural gas supplies
A number of European nations have imposed
country-wide regulations whose explicit intent
is to restrict access to, and consumption of,
otherwise lower-cost energy supplies, driving up
prices currently being paid by consumers.
Germany, for example, announced plans in 2011
to close all of its nuclear generation capacity by
2022. Replacing this generation with renewable
– or even hydrocarbon-derived – energy will
have the effect of driving up the delivered price
of electricity to end-consumers.
Additionally, the EU’s collective policy position of
shunning development of much of its natural gas
and crude supplies has resulted in a significant
and arguably unhealthy reliance on non-EU
imports (Figure 1). The continent is dependent
on others for 70 percent of its natural gas and 88
percent of its crude oil (as compared with four
percent and 27 percent in the U.S., respectively).
Not only does this have obvious price
implications, it also has a deleterious impact on
Europe’s security and geopolitical standing.
2.	 More generous energy subsidies
The EU’s environmental and energy policies
have been highly favorable toward alternative
sources, such as wind and solar. In fact, from
2005 to 2015, the EU invested over $750 billion
in renewable energy, while the U.S. spent $330
billion.1
As an example of this massive build-out of
renewables, Germany – a country with roughly
the same solar potential as Alaska2
– has
become one of the leading solar photovoltaic
markets in the world. In 2015 alone, Germany’s
renewable energy portfolio provided the country
with a third of its energy.3
However, this technology has not come cheaply
(or with full reliability). The subsidies provided
by the government to fuel the expansion
of renewable energy have been paid for by
consumers, mostly in the form of a separate
Figure 1: Natural Gas and Oil Total Net Imports and as a Percent of Consumption 2014
Source: BP Statistical Review of World Energy June 2015 and Eurostat
7
and specific renewables surcharge. In 2014, this
surcharge alone accounted for approximately
21 percent of the average customer’s bill.4
Moreover, dealing with large amounts of
intermittent power can lead to higher prices by
increasing grid balancing costs.
3.	 Policies that impose a tax or fee
on carbon emissions
Restrictive regulations, such as the EU ETS,5
taxes on carbon emissions, and the Large
Combustion Plant Directive,6
have had an
obvious and direct impact on energy prices. As
more restrictive emissions targets are imposed
over time, more fossil-fired generation is being
shut down. One analyst recently noted that
“fossil generators are facing an increasingly
difficult operating environment, with a poor
demand outlook, aging fleet, subsidies for
renewables and policies to reduce emissions all
having their hand in closures.”7
The EU ETS – which created Europe’s carbon
trading market – represents another policy
mechanism that has added to the cost of
energy. The ETS is the world’s largest carbon
cap-and-trade market and has existed since
2005. It covers GHG emissions from power and
heat generation, energy-intensive industrial
and manufacturing,8
and civil aviation sectors
in 31 countries.9,10
In 2014, CO2
prices averaged
€5.88 ($6.47) per metric ton,11
which amounts to
approximately €6.92 ($7.62) per megawatt hour
of electricity produced12
or a 17 percent premium
over the average, wholesale cost of electricity
produced in Europe.13
The EU ETS is a major element in the bloc’s
program to cut GHG emissions 40 percent below
1990 levels by 2030. It penalizes higher carbon-
emitting technologies with a carbon price,
thereby also providing a subsidy to renewables.
While many legislative attempts have been made
in the U.S. to implement a carbon cap-and-trade
at the national level, they have failed and only
a handful of mostly coastal states have moved
ahead with their own versions of cap-and-trade.14
4.	 Higher taxes on energy
consumption
Higher taxes and fees on energy consumption
is one of the main drivers of higher energy
prices in the EU. In fact, according to a 2015
report from the OECD on taxing energy use,
the “highest overall tax rates tend to be seen in
countries which are members of the European
Union.”15
The report goes on to note that the
“energy tax policy is significantly shaped by the
2003 EU Energy Taxation Directive, which sets
minimum tax rates for a wide range of energy
commodities.”16
While the goal of this policy is to “reduce
distortions caused by divergent national tax
rates, remove competitive distortions between
mineral oils and other (unlegislated) energy
products, and create incentives for energy-
efficiency and emission reductions,”17
it creates
higher prices for consumers and businesses.
For example, Figure 2 illustrates the effective
energy18
and carbon-dioxide tax rates across
various countries. These rates are substantially
higher in the EU – approximately 20 times higher
– than in the United States.
8
In 2014, the EIA conducted an analysis that
compared residential electricity prices in the
EU with those in the United States. The results
align with the findings in the charts above.
That is, taxes are much higher in the EU, which
contribute directly to the overall higher cost of
energy.
For example, in 2013, EU countries taxed
residential electricity rates at an average of 31
percent, with a low of five percent (UK) and a
high of 57 percent (Denmark).19
For motor fuel,
at $3.36 per gallon, gasoline taxes in the EU are
almost 7 times higher than the U.S.; at $2.38 per
gallon, diesel taxes are 4 times higher.
Figure 2: Economy-wide Average Effective Tax Rates on Energy (left) and on CO2
from Energy (right)
Source: OECD (2015). Tax rates are as of April 1, 2012. U.S. figures do not include state taxes
9
CITATIONS
1 	 United Nations Environment Programme and Bloomberg New Energy Finance, Global Trends in Renewable
Energy Investment 2016. Available at: http://fs-unep-centre.org/publications/global-trends-renewable-ener-
gy-investment-2016
2 	 Lydersen, K. (2012) From Dusseldorf to Duluth, the promises and pitfalls of solar. Midwest Energy News. Re-
trieved 11 May 2016 from http://midwestenergynews.com/2012/09/27/from-dusseldorf-to-duluth-the-prom-
ises-and-pitfalls-of-solar/
3 	 GmbH, T. (2016). Renewables’ Share Expected to Rise to 33 Percent in 2015. Bdew.de. Retrieved 4 May 2016,
from https://www.bdew.de/internet.nsf/id/20151103-pi-renewables-share-expected-to-rise-to-33-percent-
in-2015-en
4 	 In 2014, the renewable surcharge was EUR 6.24 cents/kWh, or about USD 8 cents/kWh. To put this into
perspective, the U.S. average retail residential electricity rate was 12.5 cents/kWh. Thus, Germany’s surcharge
represents 2/3rd of the U.S. price.
5 	 The EU ETS is the world’s largest cap-and-trade carbon market. The EU ETS requires utilities and industry
to hold allowances to cover their pollution. Allowances can be bought and sold on an open market and the
allowable pollution targets decrease over time, making compliance more difficult and expensive for traditional
fossil-fueled generators. For more info, see: http://ec.europa.eu/clima/policies/ets/index_en.htm
6 	 The LCPD is a directive that is meant to limit the amount of flue gas emissions specifically for Sulphur dioxide,
nitrogen oxides, and dust. For more info, see: http://eur-lex.europa.eu/legal-content/EN/TXT/?uri=URISERV
percent3Al28028
7 	 EU Shutters Most Coal, Natural Gas Power in Six Years. (2015). Bloomberg.com. Retrieved 3 May 2016, from
http://www.bloomberg.com/news/articles/2015-02-11/eu-shutters-most-coal-natural-gas-power-in-six-years
8 	 Energy-intensive industry includes oil refineries, steel works and production of iron, aluminum, metals, cement,
lime, glass, ceramics, pulp, paper, cardboard, acids and bulk organic chemicals.
9 	 The 31 countries include all of the EU 28 countries plus Iceland, Liechtenstein and Norway.
10 	 The EU Emissions Trading System (EU ETS) Fact Sheet. http://ec.europa.eu/clima/publications/docs/fact-
sheet_ets_en.pdf
11 	 European Union: An Emissions Trading Case Study. IETA. Available at: http://www.ieta.org/resources/Re-
sources/Case_Studies_Worlds_Carbon_Markets/euets_case_study_may2015.pdf
12 	 Based on an average historical emission rate from of 1.18 tonnes per MWh in the EU (excludes non-EU coun-
tries included under the EU ETS). $6.92/MWh = 1.18 tonne of CO2/MWh x $5.88/ tonne of CO2.
13 	 Average wholesale electricity prices in the EU were at about €40/MWh. See https://ec.europa.eu/energy/
sites/ener/files/documents/EnergyDailyPricesReport-EUROPA_0.pdf
14 	 Hardball, E. (2015). Gov. Cuomo aims to link U.S. Northeast’s carbon market with Calif.’s. ClimateWire. Re-
trieved 11 May 2016; http://www.eenews.net/stories/1060026140
15 	 OECD (2015), Taxing Energy Use 2015: OECD and Selected Partner Economies, OECD Publishing, Paris.
16	 http://dx.doi.org/10.1787/9789264232334-en
17 	 Ibid.
18 	 OECD (2015), Taxing Energy Use 2015: OECD and Selected Partner Economies, OECD Publishing, Paris.
19	 http://dx.doi.org/10.1787/9789264232334-en
10
11
2CHAPTER
ENERGY PRICE
COMPARISON:
UNITED STATES VS. EU
12
Energy prices in the EU on a per unit basis have
historically been much higher than prices for
the same energy products used in the United
States. In this section, we show how the price
differentials for electricity, natural gas, and motor
fuel have stacked up over time.
DATA SOURCES & ENERGY PRICE
DIFFERENTIALS
For U.S. energy data, we rely on EIA for annual
estimates of prices.1
For the EU, we rely on price
data from the European Commission’s Eurostat2
and the European Environment Agency (EEA).3
We also utilize various conversion factors and the
U.S. Internal Revenue Service (IRS) for historical
exchange rates.4
The differences in energy pricing regimes
between the United States and EU are apparent
both in an industrial context, and a residential
one. In 2014, these sectors accounted for
approximately 64 percent of total U.S. electricity
consumption and 52 percent of total U.S. natural
gas consumption. Additionally, the residential
sector accounted for 85 percent of the total U.S.
petroleum consumption for transportation use
in 2014.5
Given their consumption levels, the residential
and industrial sectors serve as good indicators of
how the larger U.S. economy would be impacted
if EU-style policies were adopted.
ELECTRICITY PRICES
Figure 3 illustrates how historical residential
electricity prices have compared between
the U.S. and EU from 2010 to 2014. Delivered
residential electricity prices in the EU during
this period averaged near $240/MWh, whereas
the U.S. averaged nearly $120/MWh, or less
than half of EU prices.
Additionally, residential electricity price growth
over this time period differs significantly, with the
EU rising 22 percent (or five percent annually),
while prices in the U.S. increased by only eight
percent (or two percent annually). A similar story
can be seen in the industrial sector.6
For delivered residential natural gas prices
(Figure 4), the U.S. experienced a slight decline
of four percent from 2010 to 2014, driven
primarily by the increase in domestic supply of
natural gas from shale.7
The EU, on the other
hand, saw an increase in delivered residential
natural gas prices of 29 percent.8
Figure 3: U.S. and EU Residential Electricity Price Comparison, 2010-2014, (USD/MWh)
13
For delivered industrial natural gas, prices
remained somewhat constant in the U.S. while
they increased by over 26 percent in the EU from
2010 to 2014.
A similar picture emerges for gasoline and diesel
fuel prices. Motor fuel prices in the EU were 2.1 to
2.3 times higher than U.S. prices for gasoline and
1.8 to 1.9 times higher for diesel fuel from 2010
to 2014. By 2014, U.S. gasoline prices averaged
$3.44/gallon whereas EU prices averaged $7.42/
gallon, as shown in Figure 5. Diesel fuel prices
follow a similar pattern as gasoline prices, with
EU prices nearly double those in the United
States.9
The price differences between the U.S. and the
EU are significant across all major fuel types.
In general, in 2014 EU residents paid 77 to 127
percent more for energy compared to U.S.
residents and EU industrial consumers paid 65
to 143 percent more than U.S. industries.
As highlighted previously, EU energy and
environmental policies can explain much of the
price differences.
Figure 4: U.S. and EU Residential Natural Gas Price Comparison, 2010-2014, (USD/mcf)
Figure 5: U.S. and EU Gasoline Price Comparison, 2010-2014, (USD/gallon)
14
CITATIONS
1 	 See http://www.eia.gov/.
2 	 See http://ec.europa.eu/eurostat.
3 	 See http://www.eea.europa.eu/.
4 	 See https://www.irs.gov/Individuals/International-Taxpayers/Yearly-Average-Currency-Exchange-Rates.
5 	 See https://www.eia.gov/totalenergy/data/monthly/pdf/sec3_26.pdf.
6 	 EU average price for 2010-2014 in the Industrial sector is equal to $119/MWh, while U.S. prices averaged ap-
proximately $69/MWh. However, from a price growth perspective, the EU remained relatively flat, whereas the
U.S. experienced a 5 percent increase in price (or about 1.2 percent annually).
7 	 U.S. dry natural gas production increased from 21.3 Tcf in 2010 to over 25.7 Tcf in 2014, representing over a 20
percent increase from 2010 volumes.
8 	 Although we do not display it graphically here, we see similar patterns in gasoline and diesel fuel prices.
9 	 For diesel fuel, the U.S. averaged $3.83/gallon, while the EU was at $6.77/gallon in 2014.
15
3CHAPTER
MACROECONOMIC
REVIEW
16
Affordable energy prices are a major driver and
facilitator of economic growth. Lower energy
prices create benefits in the form of lower
operating costs for businesses and higher
disposable income for consumers, which
when combined have the effect of increasing
employment and overall economic output.
While many other factors contribute to the
overall health, strength, and competitiveness
of a given economy, a number of studies have
detailed the relationship between access to
affordable energy and a growing economy. For
example, a recent U.S. Council of Economic
Advisers report notes that increasing production
of oil and natural gas “has contributed broadly
to employment and gross domestic product
(GDP) growth during the recovery from the Great
Recession.”1
In this section, we provide a brief overview of how
specific macroeconomic indicators have differed
between the U.S. and EU over time.
GROSS DOMESTIC PRODUCT/ECONOMIC
OUTPUT
Europe’s combined gross domestic product
(GDP) is roughly similar in size to that of the
United States. In 2014, the EU’s GDP was $18.5
trillion compared to U.S. GDP of $17.4 trillion.2
Leading up to the recession, the gap between
the EU’s GDP and United States’ GDP was much
greater – exceeding $3.2 trillion in 2007.
This gap has closed significantly in the
intervening years, mainly due to much different
rates of economic growth. From 2008 to 2014,
the U.S. experienced an annual average GDP
growth of 2.8 percent compared to -0.5 percent
in the EU. Figure 6 shows how GDP has changed
over time between the U.S. and EU.
While the U.S. GDP was obviously impacted by
the recession as well, it has since recovered. As
shown in the figure above, U.S. GDP has been
steadily catching up to the EU’s.
On a per capita basis, the U.S. GDP is well ahead
Figure 6: U.S. and EU GDP, 2008-2014, (USD Trillions Nominal)
17
of the EU. Between 2008 and 2014, U.S. GDP
per capita grew 13 percent (from $48,400 to
$54,600), while EU GDP per capita decreased by
0.4 percent (from $37,900 to $36,400). By 2014,
the gap in GDP per capita between the U.S. and
the EU was just over $18,000 (Figure 7).
Ultimately, the EU has struggled to return to
pre-recession economic output levels on both
an absolute GDP basis and a per capita basis,
as indicated by the two figures above. Part of
this struggle occurred when it fell back into a
recession beginning in the third quarter of 2011.
EMPLOYMENT AND HOUSEHOLD INCOME
Employment and household income are two
other measures to gauge the health of a given
economy. These additional macroeconomic
indicators paint a broader picture of an
economy’s overall health. For example, higher
levels of employment tend to provide more
income to consumers and directly affect a
nation’s level of productivity. It is important, then,
to understand how higher energy prices might
affect these indicators.
As it relates to employment, the U.S. has seen
higher employment levels than the EU since the
recession. From 2008 to 2014, the job market in
the U.S. grew 0.7 percent annually3
(from 128.8
million to 134.0 million employees) compared
to -0.3 percent annually4
(from 213.4 million to
209.5 million employees) in the EU.
The EU experienced a steady decline from 2008
until 2013 and then an uptick in 2014 as shown
in Figure 8. Countries like Spain and Greece
have weighed heavily on the EU’s employment
numbers as they have exceptionally high
unemployment rates (26.7 percent and 27.8
percent, respectively) particularly with youth
unemployment (55.5 percent and 57.1 percent,
respectively) in 2014.5
A major driver of the higher rate of economic
growth in the U.S. has been the growth of oil
and gas production. This production growth has
created economic benefits across the entire oil
and gas value chain.
Figure 7: U.S. and EU GDP per Capita, 2008-2014, (USD Nominal)
Various studies have shown the enormous
effect the “shale revolution” has had on the U.S.
economy. The 2015 Economic Report of the U.S.
President estimates that “the oil and natural
gas sectors alone contributed more than 0.2
percentage point to real GDP growth between
2012 and 2014, in contrast to a slight negative
contribution on average from 1995 to 2005.”6
Additionally, the “contribution between 2012
and 2014, which does not count all economic
spillovers, added substantially to the 2.4 percent
average annualized rate of U.S. economic growth
over these three years.”7
Another report, which focused on 2011,
estimated that the total operational and capital
investment impact of the oil and natural gas
industry to the U.S. economy was $1.2 trillion
(or 8 percent of U.S. GDP in 2011).8
Additionally,
McKinsey Global Institute released a report
stating that “shale energy could revitalize the oil
and gas industry, have downstream benefits for
energy-intensive manufacturing, and send ripple
effects across the economy.”9
The report goes on
to estimate that the shale boom “could add 2 to
4 percent ($380 billion to $690 billion) to annual
GDP and create up to 1.7 million permanent jobs
by 2020.”10
The International Energy Agency (IEA) also
chimed in, stating that “the shale gas boom will
boost US manufacturing and jobs until at least
2035…reinforcing America’s economic edge
over Asia and Europe for the next two decades.”11
Furthermore, the IEA“warned that Europe
would need to embrace tough reforms to avoid
falling behind the US over the next 20 years.”12
In July 2014, the IEA stated that “the U.S. shale-
gas boom is placing 30 million jobs at risk in
Europe as companies with greater reliance on
energy contend with higher fuel prices than their
American counterparts.”13
In addition to total jobs and the employment,
disposable household income rates are helpful
indicators of economic performance. Net
disposable household income annual growth
rates for the U.S. and the EU are shown in Figure
9. The U.S. has had somewhat consistent annual
growth in disposable income, averaging 1.1
percent each year, while the EU has averaged
just 0.2 percent annual growth.
Figure 8: U.S. and EU Employment Rate, Ages 20-64, 2008-2014 (percent of age
group population)
18
Lower energy prices have had a clear and
positive impact on economic growth in the
U.S. The linkage between energy prices and
economic output has been studied extensively.
One study states that in the case of an oil price
shock, the “effects are not trivial” and that “oil
shocks have caused and/or contributed to each
one of the US and global recessions in the last
thirty years.”14
Other studies come to similar conclusions –
energy prices do play a role in the economic
prosperity of a nation.15
The EU, for its part, has
been stuck in a high energy price environment
since the recession due to policies and
circumstances that are largely self-imposed,
which in turn have slowed the pace of its
recovery.
Figure 9: U.S. and EU Net Household Disposable Income Annual Growth, 2008-2013
(percent)
Source: OECD. Data for U.S. only available through 2013. See: https://data.oecd.org/hha/household-disposable-
income.htm
19
CITATIONS
1 	 2015 Economic Report of the President, Chapter 6: The Energy Revolution: Economic Benefits and the Founda-
tion for a Low-Carbon Energy Future. U.S. Council of Economic Advisers. Available at: https://www.whitehouse.
gov/sites/default/files/docs/2015_erp_chapter_6.pdf
2 	 The World Bank, http://data.worldbank.org/indicator/NY.GDP.MKTP.CD/countries/EU?display=default.
3 	 See BLS, http://www.bls.gov/lau/. This calculation includes all civilian labor force employment for the 20-64
age group.
4 	 See Eurostat, Employment by sex, age and citizenship data table. http://ec.europa.eu/eurostat/web/lfs/data/
database.
5 	 Unemployment rate by sex and age - monthly average, percent. (n.d.). Retrieved from http://appsso.eurostat.
ec.europa.eu/
6 	 Ibid.
7 	 Ibid.
8 	 PWC, Economic Impacts of the Oil and Natural Gas Industry on the US Economy in 2011. July 2013. Available at:
http://www.api.org/~/media/files/policy/jobs/economic_impacts_ong_2011.pdf
9 	 McKinsey Global Institute, Game Changers: Five Opportunities for US Growth and Renewal, July 2013. Available
at: http://www.mckinsey.com/global-themes/americas/us-game-changers
10 	Ibid.
11 	 Shale gas boom to fuel US lead over Europe and Asia for decades. (2016). Financial Times. Retrieved 5 May
2016, from http://www.ft.com/cms/s/0/287fbf4e-4b9c-11e3-a02f-00144feabdc0.html#axzz47ojq0Vyd
12 	 Ibid.
13 	 Europe Risks Losing 30 Million Jobs to U.S. Shale Boom. (2016). Bloomberg.com. Retrieved 5 May 2016, from
http://www.bloomberg.com/news/articles/2014-07-17/europe-risks-losing-30-million-jobs-to-u-s-shale-boom
14 	 Roubini, N. and Setser, B., The effects of the recent oil price shock on the U.S. and global economy, August
2004. Available at: http://pages.stern.nyu.edu/~nroubini/papers/OilShockRoubiniSetser.pdf
15 	 For example, see: Bordoff, J. and Stock, J., The Implications of Lower Oil Prices for the US Economy Amid the
Shale Boom, December 2014; Centre for Climate Change Economics and Policy, Historical Energy Price Shocks
and their Changing Effects on the Economy, April 2014; Congressional Budget Office, The Economic Effects of
Recent Increases in Energy Prices, July 2006; and Kilian, L., The Economic Effects of Energy Price Shocks, May
2007.
20
21
SCENARIO ANALYSIS:
ENERGY PRICE IMPACT
4CHAPTER
22
The previous sections demonstrate how much
more expensive energy products have been in EU
countries in recent years relative to the United
States, with additional discussion of how higher
prices may have affected economic growth and
contributed to the EU’s relatively slower rebound
following the global recession. In this section, we
seek to quantify the impact of EU-style policies
on the U.S. economy – especially insofar as they
have the effect of increasing U.S. delivered energy
prices to EU levels.
We also take a closer look at how the economies
of seven U.S. states – Colorado, Florida, Illinois,
Indiana, Michigan, Ohio and Wisconsin – might
fare if their businesses and consumers were
forced to operate under an EU energy-pricing
regime.
ANALYTICAL METHODOLOGY
The analysis presented here shows the potential
impacts in a single year – 2014 – if the U.S. were
to be forced to operate under EU-level energy
prices.1
To model the overall macroeconomic
impact of these higher prices, we started by
calculating the percentage differences between
energy prices in the U.S. and EU. For data, we
relied on the following:
•	 EIA for annual estimates of U.S. prices.2
•	 European Commission’s Eurostat3
and the
European Environment Agency (EEA) for EU
price data.4
•	 US Census Annual Survey of Manufacturers
(ASM)5
and the EIA’s Manufacturing Energy
Consumption Survey (MECS)6
for Industrial
energy expenditures and fuel consumption
shares.
•	 U.S. IRS for historical exchange rates.7
•	 Bureau of Labor Statistics (BLS) Consumer
Expenditure Survey for historical U.S.
consumer expenditures.8
Table 3 illustrates how retail energy prices differ
between the U.S. and EU for the residential and
industrial sectors for 2014. Energy prices were
nearly double per unit of consumption in the EU
across the board. For example, the U.S. average
price for retail electricity in 2014 was $125.20/
MWh, whereas the EU’s price was $259.31/
MWh, or 207 percent of the U.S. price.
The percent-difference values we calculate in the
table above represent the starting point for our
total economic impact analysis.
Table 3: Retail Energy Price Differential Impacts, 2014
US Price
(USD/unit)
EU Price
(USD/unit)
%
Difference
Residential
Electricity (MWh) $125.20 $259.31 107%
Natural Gas (mcf) $10.97 $24.94 127%
Motor Fuels (gallons)
Gasoline $3.44 $7.42 116%
Diesel $3.83 $6.77 77%
Wtd. Gas & Diesel 107%
Industrial
Electricity (MWh) $71.00 $116.96 65%
Natural Gas (mcf) $5.55 $13.50 143%
23
ECONOMIC IMPACT MODELING &
ASSUMPTIONS
To conduct this analysis, the IMPLAN model was
used to estimate the overall macroeconomic
effects of higher energy prices. IMPLAN is a
general input-output modeling software and
data system that tracks the movement of
money and resources through an economy,
looking at linkages between industries along the
supply chain to measure the cumulative effect
of spending in terms of job creation, income,
production, and taxes.
As such, IMPLAN helps us understand and
quantify the so-called economic “ripple” (or
multiplier) effect that tracks how each dollar
of input, or direct spending, cycles through
the economy to suppliers and ultimately to
households.
To model the overall macroeconomic impact
of higher energy prices, we start with the
percentage differences calculated in Table 3
above. We assume that the additional energy
costs come in the form of lost consumer income
for the residential sector9
and lost margin for the
industrial sector.
Additionally, we assume that under the higher-
price scenario, consumption stays constant.
Implicitly, we are assuming that Americans
would want to maintain the same standard
of living (to the extent possible) under higher
energy prices. Of course, demand isn’t
completely inelastic, but several studies have
shown that short-term demand is highly inelastic
under price increases.
For example, one study found that “demand
is relatively inelastic to price [and that] in
the past 20 years, this relationship has not
changed significantly.”10
Another study notes
that “electricity price elasticities in general are
expected to be fairly inelastic due to limited
substitution possibilities for electricity.”11
For our residential consumer impact analysis,
we rely on the BLS Consumer Expenditure
Survey for the annual average consumer
expenditures on energy, broken down by income
level. Because we assume that consumption
at every income level stays constant under a
price change, we increase the average energy
expenditure for electricity, natural gas, and
motor fuel for each income level by the price
differentials calculated in Table 3. These
calculations are displayed in Table 4.
Table 4: Average Residential Electricity, Natural Gas, and
Motor Fuel Expenditure by Income Level (2014, $Billions)
Income Bracket
2014 Actual
Expediture
Increased Price
Scenario Difference
Less than $10k $25.5 $53.3 -$27.8
$10k to $15k $20.1 $42.1 -$22.0
$15k to 25k $48.8 $102.0 -$53.3
$25 to $35k $76.2 $159.4 $55.8
$35k to $50k $73.3 $153.4 -$80.1
$50k to $75k $102.4 $214.2 $111.8
$75k to $100k $71.7 $150.1 -$78.4
$100k to $150k $88.9 $180.1 $97.2
$150k and more $76.0 $159.4 $83.4
Total $582.8 $1,219.9 $609.7
24
Table 5: Average Industrial Electricity and Natural Gas Expenditure, Top 25
(2014, $Billions)
Industry NAICS
2014 Energy
Spending
(Billion $)
Increased
Price
Scenario
(Billion $) Difference
1 Petroleum refineries 32411 $10.2 $20.3 $10.1
2 Other Basic Organic Chemical Manufacturing 32519 6.1 8.9 2.8
3 Iron and steel mills and ferroalloy
manufacturing
3311 5.6 8.5 2.9
4 Paper Mills 32212 3.3 5.4 2.1
5 Plastics material and resin manufacturing 325211 3.2 4.5 1.3
6 Paperboard Mills 32213 2.6 4.3 1.7
7 Petrochemical Manufacturing 32511 2.5 4.2 1.6
8 Motor Vehicle Parts Manufacturing 3363 2.1 3..6 1.5
9 Other plastics product manufacturing 32619 1.9 3.2 1.3
10 Semiconductor and related device
manufacturing
334413 1.6 2.7 1.1
11 Industrial gas manufacturing 32512 1.5 2.9 1.3
12 Cement manufacturing 32731 1.5 2.0 0.6
13 Printing 32311 1.3 2.3 1.0
14 Alumine refining and primary aluminum
production
331313 1.1 1.9 0.8
15 Lime and gypsum product manufacturing 3274 0.9 1.6 0.7
16 Plastics packaging materials and unlaminated
film and sheet manufacturing
32611 0.9 1.5 0.6
17 Ferrous metal foundries 33151 0.9 1.4 0.5
18 Paperboard container manufacturing 32221 0.9 1.4 0.6
19 Poultry processing 311615 0.8 1.5 0.6
20 Wet corn milling 311221 0.8 1.3 0.5
21 Sawmills and wood preservation 3211 0.7 1.2 0.4
22 Pharmaceuticals preparation manufacturing 325412 0.7 1.2 0.5
23 Fertilizer manufacturing 32531 0.7 1.4 0.7
24 Fruit and vegetables canning, pickling, and
drying
31142 0.7 1.3 0.7
25 Other general purpose machinery
manufacturing
3339 0.7 1.1 0.5
Total $53.0 $89.5 $36.5
25
Overall, residential energy expenditures
more than double from $583 billion to
$1,220 billion under the EU price scenario.
This $610 billion increase in costs would directly
reduce the amount of money each household
has available to spend on goods and services.
This indirect impact on the economy is modeled
in IMPLAN.
For our industrial impact analysis, we ranked
the top 25 industries based on total electricity
and fuel consumption using the US Census’s
Annual Survey of Manufacturers (ASM). We also
used EIA’s Manufacturing Energy Consumption
Survey (MECS) data to calculate the percentage
of fuel that was spent on natural gas.
As with our Residential analysis, we assume that
energy consumption stays constant while prices
change. As Table 5 shows, the total cost impact
to these industries is $36.5 billion.
RESULTS
We first ran IMPLAN to calculate the
macroeconomic impacts of lower residential
household incomes caused by higher energy
prices. We reduced the household income level
for each income bracket as outlined above in
Table 4. IMPLAN calculated the indirect and
induced economic impacts, which resulted in
$644 billion in lost GDP opportunities; more
than $364 billion in lost labor income; and
nearly 7.4 million jobs lost as well, as shown in
Table 6.
Our modeling indicates that higher energy prices
(assuming consumption remains constant)
lowers overall economic output, reduces
labor income, and creates a significant loss in
employment. These impacts are felt across a
number of industrial sectors. In Figure 10, we
show the top 10 most impacted North American
Industry Classification System (NAICS) sectors
and the lost GDP opportunity each sector would
have experienced under the higher energy price
scenario in the residential sector.
For example, the Health Care and Social
Assistance sector would have lost approximately
$82 billion, while the Real Estate and Rental and
Leasing sector would have lost $62 billion.
For the industrial sector, we found that the
overall impact of higher energy prices equates to
$31.2 billion in lost GDP. This economic hit also
equates to over $16 billion in lost labor income
and just over 273,000 jobs, as shown in Table 7.
We note that these figures are somewhat
conservative given that the impact modeled
was only on the top 25 industrial sectors.
Furthermore, because we assume for the
purposes of this study that an increase in price
does not retard consumption, we zero-out any
induced and indirect losses associated with
Table 6: Aggregate Residential Economic
Impacts due to Increased Energy Prices,
2014
Economic Impact
Aggregate Economic
Lost Opportunity
GDP $644.3 billion
Labor Income $364.1 billion
Annual Employment 7.4 million jobs
Economic Impact
Aggregate Economic
Lost Opportunity
GDP $31.2 billion
Labor Income $16.7 billion
Annual Employment 273,100 jobs
Table 7: Aggregate Industrial Economic
Impacts due to Increased Energy Prices,
2014
26
Figure 10: GDP Impacts of the Top 10 NAICS Industry Sectors from
Residential Price Increases, 2014, ($ Billions)
Figure 11: GDP Impacts of the Top 10 NAICS Industry Sectors resulting from an Energy
Price Increase to Energy-Intensive Industries, 2014, ($ Billions)
$82
$62
$58
$57$48
$36
$35
$33
$29
$67
Health Care and Social Assistance
Real Estate and Rental and Leasing
Finance and Insurance
Manufacturing
Retail Trade
Wholesale Trade
Information
Professional, Scientific, and Technical Services
Accommodation and Food Services
No NAICS Code Designation*
All other Sectors Total GDP Impact: $139 billion
*Includes IMPLAN sectors for which there is no matching NAICS code. The majority of these impacts are in Owner-occupied
Dwellings ($62 billion) and Other Local Government Enterprises ($4 billion).
$13.1
$2.5
$1.6
$1.5
$1.5
$1.4
$1.3
$1.1
$1.0
$1.3
Manufacturing
Wholesale Trade
Finance and Insurance
Real Estate and Rental and Leasing
Professional, Scientific, and Technical Services
Transportation and Warehousing
Health Care and Social Assistance
Retail Trade
Management of Companies and Enterprises
No NAICS Code Designation*
All other Sectors Total GDP Impact: $5.0 billion
*Includes IMPLAN sectors for which there is no matching NAICS code. The majority of these impacts are in Owner-occupied Dwellings
($1.1 billion) and Other Local Government Enterprises ($0.2 billion).
27
the oil, natural gas, and electric generation
industries.
For example, the model outputs show that
higher energy costs in the industrial sector
translate to a reduction of purchases from the
natural gas distribution sector. However, under
the assumption that consumption does not
change, these indirect and induced effects do
not, in our study, occur. We adjust the outputs
to reflect this.
As with the residential sector, the impacts
of higher prices on U.S. industries would be
felt across a number of sectors. In the figure
below, we show the top 10 most impacted
NAICS sectors and the lost GDP opportunity
each sector would experience under the higher
energy price scenario.
Not surprisingly, several well-known energy-
intensive industries are represented on the list
of the most impacted sectors below (mostly
those in the manufacturing sector). We
calculate that the manufacturing sector would
stand to lose approximately $13.1 billion on an
annual basis if forced to operate under an EU-
level energy pricing regime.
28
CITATIONS
1 	 2014 is the year in which the most recent and complete data is available for all energy consumption and prices.
2 	 See http://www.eia.gov/. Data tables used include: “Average price (cents/kilowatt hour by State by Provider,
1990-2014”, Natural gas average residential price delivered to residential consumers, Natural gas average
industrial price , Retail gasoline prices all grades all formulations, Retail No 2 Diesel prices.
3 	 See http://ec.europa.eu/eurostat. Note that for the EU, we use the EU 28 countries in our analysis. Tables
used include: “Electricity prices by type of user” and “Natural gas prices by type of user.” User types pulled are
“Medium size households” and “Medium size industries.”
4 	 See http://www.eea.europa.eu/data-and-maps/daviz/nominal-and-real-fuel-prices-2#tab-chart_1.
5 	 http://factfinder.census.gov/bkmk/table/1.0/en/ASM/2014/31GS101
6 	 https://www.eia.gov/consumption/manufacturing/
7 	 See https://www.irs.gov/Individuals/International-Taxpayers/Yearly-Average-Currency-Exchange-Rates.
8 	 See tables for 2014 “Income Before Taxes” and “Higher Income Before Taxes” at: http://www.bls.gov/cex/csx-
combined.htm.
9 	 The modeling approach assumes that all increased costs associated with higher prices are passed along to
the final consumer. That is, the final consumer bears all additional costs, and no costs are absorbed within the
electricity, natural gas, and refined fuels value chains. This is a reasonable assumption in that we see final con-
sumers in countries like Germany paying for the increases in taxes, fees, and wholesale fuel costs. In the U.S.,
energy service providers typically have “pass-through” clauses that allows them to pass through the wholesale
fuel costs to the final consumer.
10 	 Bernstein, M. and Griffin, J., Regional Differences in the Price-Elasticity of Demand for Energy, February 2006.
11 	 Madlener, R. et al., Econometric Estimation of Energy Demand Elasticities, Volume 3, Issue, E.ON Energy Re-
search Center Series.
29
5CHAPTER
STATE-LEVELANALYSES
(CO, IL, IN, MI, FL, OH, WI )
30
The vast majority of the electricity produced
in Colorado (more than 80 percent)1
is derived
from coal and natural gas. These lower-than-
average generation costs translate into lower-
than-average power costs for consumers and
businesses in the state, which in turn have
contributed to better-than-average economic
performance in recent years. In 2014, Colorado
generated $306 billion in GDP2
, had nearly 2.7
million people active in the workforce and had an
unemployment rate of 5.0 percent, which is well
below the national average of 6.2 percent.3
All told, our analysis indicates that Colorado
would see a $6.8 billion drop in its state
annual economic output figure under a
scenario in which Colorado residents and
businesses were forced to live under an EU
energy price regime. More than 84,000 jobs
that would otherwise exist under the energy
price regime currently in place in the state would
be lost. And all those lost jobs would deprive
Colorado families of nearly $4 billion in annual
wages, even while forcing those same families
(and all the rest as well) to pay nearly $4,730
more for their energy per year than what they
already pay. Table 8 summarizes these impacts.
In addition to the impacts described above, we
examined the level of potential economic value
at risk for the top 25 energy-intensive industries
in Colorado. Based on our models, we find that
more than 115,000 Colorado jobs would be at
risk of leaving the state or being discontinued
under an EU energy pricing system, taking with
them nearly $12 billion in annual state GDP.
One specific example of an industry sector in
Colorado that could be placed at risk if energy
prices were to rise dramatically is the state’s
brewing industry, which directly contribute $1.4
billion in annual state GDP (as of 2014). Rather
than continue production in Colorado, brewers
could move operations to a region with lower
energy costs.
Colorado
Economic Impact
Higher Residential
Energy Prices
Higher Industrial
Energy Prices
Total Impact
Lost State GDP $6.7 billion $125 million $6.8 billion
Lost Labor Income $3.8 billion $74 million $3.9 billion
Lost Annual Employment 82,900 jobs 1,300 jobs 84,200 jobs
Annual Energy Cost Increase $4,730 per household
Table 8: Impacts of EU Energy Prices on Colorado Economy (2014)
Table 9: Colorado’s Industrial Value at Risk Under EU Price Regime (2014)
Economic Impact
Industrial Value at
Risk (Direct Impact)
Industrial Value at Risk
(Additional Impact)
Industrial Value at Risk
(Economy-Wide Impact)
State GDP $4.7 billion $7.1 billion $11.7 billion
Labor Income $2.5 billion $4.3 billion $6.8 billion
Annual Employment 40,600 jobs 75,100 jobs 115,700 jobs
31
In Illinois, an even greater percentage of the
state’s electricity (more than 80 percent)4
comes from low-cost sources such as coal
and natural gas than in Colorado. In large part
because of that, Illinois consumers pay less for
their electricity than the average U.S. ratepayer
(roughly 1.2 cents less per kilowatt-hour).5
In
2014, Illinois generated $742 billion in GDP,6
had
nearly 6.1 million people in the workforce and
had an unemployment rate of 7.1 percent.7
Because Illinois is a bigger state than Colorado,
with much more significant industrial activity
and greater demand for energy, the impacts that
Illinois’s economy would be forced to endure as
a consequence of imposing EU-inspired energy
pricing are much larger than those we witnessed
in Colorado.
For instance, our analysis indicates that
imposing EU-level energy prices on Illinois would
cost the state $17.4 billion in lost state GDP
and nearly $10 billion in lost labor income.
All told, we find that more than 200,000 jobs
would be lost directly as a result of higher
residential and industrial electricity costs. And
the per-household cost for Illinois consumers in
the form of higher energy bills would amount to
more than $5,200 per year. These impacts are
summarized in Table 10.
As we did with the other states, we also
examined what the potential economic value at
risk is for the top 25 energy-intensive industries
in Illinois – industries that would be placed at
immediate risk of idling, shuttering or moving if
they were forced to pay EU-level prices for their
energy inputs.
Under such a scenario, we find that nearly
500,000 jobs in Illinois that exist today
would be placed at risk of being lost; nearly
$50 billion in state GDP would be at risk; and
more than $30 billion in annual labor income
would be placed in a similarly precarious
position.
Economic Impact
Higher Residential
Energy Prices
Higher Industrial
Energy Prices
Total Impact
Lost State GDP $16.6 billion $789 million $17.4 billion
Lost Labor Income $9.4 billion $492 million $9.9 billion
Lost Annual Employment 193,600 jobs 7,600 jobs 201,200 jobs
Annual Energy Cost Increase $5,230 per household
Table 10: Impacts of EU Energy Prices on Illinois Economy (2014)
Economic Impact
Industrial Value at
Risk (Direct Impact)
Industrial Value at Risk
(Additional Impact)
Industrial Value at Risk
(Economy-Wide Impact)
State GDP $19.0 billion $30.0 billion $48.9 billion
Labor Income $12.5 billion $18.1 billion $30.6 billion
Annual Employment 173,700 jobs 319,200 jobs 492,900 jobs
Table 11: Illinois’s Industrial Value at Risk Under EU Price Regime (2014)
Illinois
32
In Indiana, most of the power produced (over
95 percent)8
comes from low-cost sources such
as coal and natural gas; little wonder, then, that
Indiana consumers pay less for their electricity
than all but 10 states in the country.9
In 2014,
Indiana generated $324 billion in GDP10
, had
nearly three million people in the workforce and
had an unemployment rate of 6.0 percent, which
is just below the national average of 6.2 percent.11
If residents of the Hoosier State were to wake up
tomorrow and find themselves forced to pay EU-
inspired prices for their energy, the consequences
would be severe.
For starters, our analysis finds that more than
104,000 jobs would be wiped out, with the vast
majority of those being discontinued as a result
of higher residential sector energy costs. Those
lost jobs would have the effect of eliminating
more than $4.3 billion in annual labor income,
contributing in part to the loss of $7.8 billion in
annual state GDP. These impacts, which also
include an extra $5,450 that Indiana households
will need to pay each year in higher energy costs,
are captured in Table 12.
We also examined the potential economic value
at risk for the top 25 energy-intensive industries
in Indiana, as we did for other states. Our analysis
finds that nearly 430,000 jobs would be placed
at risk for elimination or departure across the
entire spectrum of the state’s economy under a
scenario in which Indiana was forced to pay EU
prices for its energy. Those lost jobs translate
into more than $26 billion in lost labor
income, and a more than $60 billion hit to
the state’s annual economic output.
One sector worth noting in Indiana is the
pharmaceutical manufacturing industry, which
contributes $18.7 billion in direct GDP to the state.
If energy prices were to rise to European levels,
this sector could be at risk. Because of the ripple
effect, the total economic value at risk increases
up to $23.4 billion.  Table 13 shows the economic
value at risk for all of Indiana’s top 25 energy-
intensive industry sectors.
Indiana
Economic Impact
Higher Residential
Energy Prices
Higher Industrial
Energy Prices
Total Impact
Lost State GDP $6.9 billion $879 million $7.8 billion
Lost Labor Income $3.8 billion $491 million $4.3 billion
Lost Annual Employment 95,800 jobs 8,300 jobs 104,100 jobs
Annual Energy Cost Increase $5,450 per household
Table 12: Impacts of EU Energy Prices on Indiana Economy (2014)
Table 13: Indiana’s Industrial Value at Risk Under EU Price Regime (2014)
Economic Impact
Industrial Value at
Risk (Direct Impact)
Industrial Value at Risk
(Additional Impact)
Industrial Value at Risk
(Economy-Wide Impact)
State GDP $36.3 billion $23.9 billion $60.3 billion
Labor Income $12.0 billion $14.2 billion $26.2 billion
Annual Employment 134,600 jobs 292,600 jobs 427,200 jobs
33
In Michigan, over 90 percent of the power
produced12
comes from low-cost sources such as
coal and natural gas. In 2014, Michigan generated
$447 billion in GDP13
, had nearly 4.4 million people
in the workforce and had an unemployment rate
of 7.3 percent, which is above the national average
of 6.2 percent.14
All told, our analysis indicates that Michigan would
see a nearly $12 billion drop in its state annual
economic output under a scenario in which its
residents and businesses were forced to live under
an EU energy price regime. Nearly 160,000 jobs
that would otherwise exist at current price levels
in the state would be lost. And all those lost jobs
would deprive Michigan families of nearly $7
billion in annual wages, making it even more
difficult for each Michigan household to pay the
extra $5,310 per year to cover higher energy
bills. These impacts are summarized in Table 14.
As it relates to the potential economic value at
risk is for the top 25 energy-intensive industries
in Michigan, the Energy Institute’s analysis finds
that more than 520,000 jobs held by Michigan
residents today would be at risk of being moved
or eliminated under a higher-cost EU energy
price regime. Our modeling found that more
than $52 billion in state GDP would similarly
be placed at risk, along with more than $31
billion in labor income – wages that would be
at risk of moving to other lower-cost regions, or
disappearing entirely.
One segment of Michigan’s economy worth
highlighting is its automotive vehicle and parts
manufacturing industries, which contributes $7.7
billion in direct GDP to the state. If energy prices
were to rise to European levels, this sector could
be at risk (i.e., the industry may stop or move
production elsewhere). Because of the ripple
effect, the total economic value at risk increases
up to $17.5 billion.  Table 15 shows the economic
value at risk for Michigan’s top 25 energy-
intensive industry sectors.
Michigan
Economic Impact
Higher Residential
Energy Prices
Higher Industrial
Energy Prices
Total Impact
Lost State GDP $11.0 billion $893 million $11.9 billion
Lost Labor Income $6.3 billion $542 million $6.8 billion
Lost Annual Employment 150,600 jobs 9,000 jobs 159,600 jobs
Annual Energy Cost Increase $5,310 per household
Table 14: Impacts of EU Energy Prices on Michigan Economy (2014)
Table 15: Michigan’s Industrial Value at Risk Under EU Price Regime (2014)
Economic Impact
Industrial Value at
Risk (Direct Impact)
Industrial Value at Risk
(Additional Impact)
Industrial Value at Risk
(Economy-Wide Impact)
State GDP $22.4 billion $29.8 billion $52.2 billion
Labor Income $12.9 billion $18.7 billion $31.5 billion
Annual Employment 175,600 jobs 345,400 jobs 521,000 jobs
34
In Florida, most of the power produced (over
95 percent)15
comes from low-cost sources
such as coal and natural gas. In 2014, Florida
generated $836 billion in GDP16
, had more than
nine million people in the workforce and had an
unemployment rate of 6.3 percent, which right
near the national average of 6.2 percent.17
When we ran the numbers for Florida, we found
that more than 377,000 jobs that presently
exist in the Sunshine State would be lost if EU
energy prices were imposed on its economy.
Nearly $30 billion in annual state economic
output would also be lost, and workers in the
state would collect about $16 billion less in
wages than they might have otherwise done.
Especially concerning given the state’s high
percentage of fixed-income residents, the
average Florida household would be forced to pay
nearly $5,000 more per year for their energy
than what it currently pays. These impacts are
summarized in Table 16.
Similar to the negative impacts that would befall
the Florida economy as a direct result of being
forced to pay higher, EU-style residential and
consumer energy prices, the potential economic
value at risk for the top 25 energy-intensive
industries in Florida is similarly enormous.
For example, our analysis found that nearly
340,000 Florida jobs would be put at risk under
this scenario, potentially resulting in the loss of
more than $18 billion in wages, and costing the
economy more than $31 billion in state GDP.
One sector worth highlighting is Florida’s
semiconductor manufacturing industry,
which contributes $1.7 billion in direct GDP
to the state. If energy prices were to rise to
European levels, this sector could be at risk for
closure. Accounting for the ripple effect, the
total economic value at risk increases to $4.2
billion. Table 17 summarizes these impacts.
Florida
Economic Impact
Higher Residential
Energy Prices
Higher Industrial
Energy Prices
Total Impact
Lost State GDP $28.0 billion $455 million $28.5 billion
Lost Labor Income $15.6 billion $272 million $15.9 billion
Lost Annual Employment 372,400 jobs 5,000 jobs 377,400 jobs
Annual Energy Cost Increase $4,980 per household
Table 16: Impacts of EU Energy Prices on Florida Economy (2014)
Table 17: Florida’s Industrial Value at Risk Under EU Price Regime (2014)
Economic Impact
Industrial Value at
Risk (Direct Impact)
Industrial Value at Risk
(Additional Impact)
Industrial Value at Risk
(Economy-Wide Impact)
State GDP $11.8 billion $19.9 billion $31.7 billion
Labor Income $6.4 billion $11.8 billion $18.2 billion
Annual Employment 105,100 jobs 233,700 jobs 338,800 jobs
35
Almost all of the power produced in Ohio (96
percent)18
comes from conventional and low-
cost sources – coal, natural gas, and nuclear.
Ohio is also a major manufacturing state – the
manufacturing sector alone represents 17 percent
of Ohio’s GDP, generates more than 660,000
jobs, and chips in $36 billion in labor income.19
Ohio generated $576 billion in GDP in 201420
,
had nearly 5.4 million people employed, and had
an unemployment rate of 5.7 percent, below the
national average of 6.2 percent.21
Ohio’s economy is on track to continue its growth,
with significant growth coming from oil and natural
gas development, including from unconventional
sources.22
Under European-style energy policies
that make fossil fuels more expensive and/
or harder to produce, Ohio households and
businesses would suffer major economic impacts.
Those impacts start with jobs: under this new
pricing regime, Ohio would lose more than
187,000 jobs, and $8.2 billion in wages being
paid out to Ohio workers today would also be
eliminated. All told, the state’s annual economic
output would decline by a staggering $14.8
billion. Our analysis of energy price increase
impacts to Ohio (including the extra $5,000 that
Ohio households would have to pay for their energy,
over and above what they already pay today) is
represented in Table 18.
As with the other states we analyzed, we examined
what the potential economic value at risk would be
for the top 25 energy-intensive industries in Ohio.
Similar in many ways to the industrial profile on
display in Michigan, Ohio’s economy would stand
to lose more than 512,000 jobs if EU energy prices
became the norm there. Those lost jobs put nearly
$30 billion in wages at risk, and have the potential
to deprive Ohioans of more than $57 billion in
annual state GDP.
One segment worth noting in Ohio is its iron and
steel manufacturing sector, which contributes
$2.2 billion in direct GDP to the state. If energy
prices were to rise to European levels, this sector
could be at risk (i.e., the industry may stop or move
production elsewhere). Because of the ripple effect,
the total economic value at risk increases to $5.8
billion. Table 19 shows the economic value at risk
for Ohio’s top 25 energy-intensive industry sectors.
Ohio
Economic Impact
Higher Residential
Energy Prices
Higher Industrial
Energy Prices
Total Impact
Lost State GDP $13.3 billion $1.5 billion $14.8 billion
Lost Labor Income $7.4 billion $807 million $8.2 billion
Lost Annual Employment 173,700 jobs 13,500 jobs 187,200 jobs
Annual Energy Cost Increase $5,000 per household
Table 18: Impacts of EU Energy Prices on Ohio Economy (2014)
Table 19: Ohio’s Industrial Value at Risk Under EU Price Regime (2014)
Economic Impact
Industrial Value at
Risk (Direct Impact)
Industrial Value at Risk
(Additional Impact)
Industrial Value at Risk
(Economy-Wide Impact)
State GDP $27.7 billion $29.5 billion $57.2 billion
Labor Income $12.1 billion $17.8 billion $29.9 billion
Annual Employment 169,400 jobs 343,400 jobs 512,800 jobs
36
Wisconsin’s economy as recovered more quickly
than that of other states coming out of the
recession of 2009. In 2014, the state generated
$290 billion in GDP23
, had more than 2.9 million
people employed, and had an unemployment rate
of 5.5 percent, below the national average of 6.2
percent.24
A large part of Wisconsin’s economic success
is related to its lower energy costs. Nearly 90
percent25
of the electric power in Wisconsin comes
from conventional and low-cost sources – coal,
natural gas, and nuclear. The state’s manufacturing
sector is a large consumer of electricity, and
the sector represented nearly 19 percent of the
state’s GDP in 2014 and accounted for more
than 16 percent of the state’s workforce in 2015.
Average annual compensation in Wisconsin’s
manufacturing sector was more than $67,000 per
employee in 2015.26
Wisconsin’s economic outlook in more recent
years, however, has slightly dimmed. Ranked as
38th
in job creation, the state has been lagging
other states.27
Wisconsin’s economy could be
under even greater pressure if European-style
energy policies were to be imposed there. Our
analysis finds that more than 81,000 jobs would
be lost under such a scenario, along with $3.5
billion in lost annual wages and a hit to the
state GDP approaching $6.3 billion per year.
Critically, Wisconsin households would have
to pay $4,720 more per year for their energy
than they already do. Table 20 summarizes these
impacts.
As with the other states, we examined what the
potential economic value at risk is for the top 25
energy-intensive industries in Wisconsin. Here
again, our models point to hundreds of thousands
of jobs being placed at risk if EU energy prices
were to be imposed on the broader economy. We
found that nearly 450,000 jobs that currently exist
today would be put at risk for elimination; $25
billion in labor income each year could potentially
be lost; and greater than $40 billion in annual state
GDP could potentially be wiped out.
In Wisconsin, the state’s cheese manufacturing
sub-sector is a key sector worth noting, as
it contributes over $1.5 billion in direct GDP
and nearly $9.7 billion in GDP to the state
via its economic ripple effect. In fact, the
cheese manufacturing sub-sector represents
approximately one-quarter of the GDP value at risk
of Wisconsin’s top 25 energy-intensive industry
sectors (Table 21).
Wisconsin
Economic Impact
Higher Residential
Energy Prices
Higher Industrial
Energy Prices
Total Impact
Lost State GDP $5.5 billion $805 million $6.3 billion
Lost Labor Income $3.0 billion $496 million $3.5 billion
Lost Annual Employment 72,900 jobs 8,600 jobs 81,500 jobs
Annual Energy Cost Increase $4,720 per household
Table 20: Impacts of EU Energy Prices on Wisconsin Economy (2014)
37
Table 21: Wisconsin’s Industrial Value at Risk Under EU Price Regime (2014)
Economic Impact
Industrial
Value at Risk
(Direct Impact)
Industrial Value at
Risk (Additional
Impact)
Industrial
Value at Risk
(Economy-Wide
Impact)
Cheese
Manufacturing
Share of the Top 25
State GDP $15.8 billion $24.9 billion $40.6 billion 24 percent
Labor Income $10.4 billion $14.6 billion $25.1 billion 21 percent
Annual Employment 161,400 286,500 jobs 447,800 jobs 21 percent
38
CITATIONS
1 	 EIA-923 Report.
2 	 BEA, GDP by State. Available at: http://www.bea.gov/regional/
3 	 BLS. http://www.bls.gov/news.release/archives/srgune_03042015.pdf
4 	 EIA-923 Report.
5 	 Nebraska state energy office, data from 2015. Comparison chart available here: http://www.neo.ne.gov/stat-
shtml/204.htm
6 	 BEA, GDP by State. Available at: http://www.bea.gov/regional/
7 	 BLS. http://www.bls.gov/news.release/archives/srgune_03042015.pdf
8 	 EIA-923 Report.
9 	 Nebraska state energy office, data from 2015. Comparison chart available here: http://www.neo.ne.gov/stat-
shtml/204.htm
10 	 BEA, GDP by State. Available at: http://www.bea.gov/regional/
11 	 BLS. http://www.bls.gov/news.release/archives/srgune_03042015.pdf
12 	 EIA-923 Report.
13 	 BEA, GDP by State. Available at: http://www.bea.gov/regional/
14 	 BLS. http://www.bls.gov/news.release/archives/srgune_03042015.pdf
15 	 EIA-923 Report.
16 	 BEA, GDP by State. Available at: http://www.bea.gov/regional/
17 	 BLS. http://www.bls.gov/news.release/archives/srgune_03042015.pdf
18 	 EIA-923 Report.
19 	 The Ohio Manufacturers’Association, 2014 Manufacturing Counts. Available at: http://www.ohiomfg.com/
ManufacturingCounts2014.pdf
20 	BEA, GDP by State. Available at: http://www.bea.gov/regional/
21 	 BLS. http://www.bls.gov/news.release/archives/srgune_03042015.pdf
22 	 EIA, Marcellus, Utica Provide 85% of U.S. Shale Gas Production Growth Since Start of 2012. Available at:
http://www.eia.gov/todayinenergy/detail.cfm?id=22252
23 	BEA, GDP by State. Available at: http://www.bea.gov/regional/
24 	 BLS. http://www.bls.gov/news.release/archives/srgune_03042015.pdf
25 	 EIA-923 Report.
26 	National Association of Manufacturers, Wisconsin Manufacturing Facts, available at: http://www.nam.
org/Data-and-Reports/State-Manufacturing-Data/State-Manufacturing-Data/March-2016/Manufactur-
ing-Facts--Wisconsin/
27 	 Wisconsin job creation rank falls to 38th in U.S.. (2016). Jsonline.com. Retrieved 19 May 2016, from http://
www.jsonline.com/business/wisconsin-job-creation-rank-falls-to-38th-in-us-b99464770z1-296876421.html
39
TECHNICAL
APPENDIX
40
This technical appendix describes the economic impact modeling data, assumptions, and methodology
for both our Residential and Industrial sector analysis.
Gasoline prices on the cover were calculated by comparing the U.S. average price for regular unleaded
gasoline on 9-28-16 ($2.21 per gallon) with an average of price for Super 95 unleaded gasoline in each of
the 28 European Union countries in mid-September (1.24 €/liter = $5.24/gallon). Assumes a 20-gallon
gas tank.
RESIDENTIAL MODELING ASSUMPTIONS & DATA
To model the overall macroeconomic impact of higher energy prices, we use annual data for the year
2014. We model 2014 because it is the year in which all data is available. We rely on the following data for
the analysis:
•	 US Energy Prices — Energy Information Administration (EIA).1
Data tables include:
•	 Average Electricity Price by State by Provider2
— We use “Residential” and
“Industrial” (for industrial analysis) columns under the “Total Electric Industry” Industry
Sector Category for prices.
•	 Natural gas price delivered to residential consumers3
•	 Natural gas industrial price4
(for industrial analysis)
•	 All grades all formulations retail gasoline prices5
•	 No 2 Diesel prices6
•	 European Energy Prices
•	 European Commission’s Eurostat.7
We use data for the EU 28 countries throughout the
analysis because it is the most consistent aggregate. Data tables include:
•	 Electricity prices by type of user8
- the data is broken down by “Medium size
household” and “Medium size industrial” (for industrial analysis)
•	 Natural gas prices by type er9
- the data is broken down by “Medium size household”
and “Medium size industrial” (for industrial analysis)
•	 European Environment Agency (EEA).10
•	 This data provides motor fuel prices. We use the “All petrol, unleaded equivalent
(nominal)” column for gasoline prices. We use the “Diesel (nominal)” column for
diesel prices.
•	 Historical Exchange Rates: U.S. Internal Revenue Service (IRS).11
•	 US Residential Energy Spending: Bureau of Labor Statistics (BLS) Consumer Expenditure
Survey for year 2014.12
Data tables include:
41
•	 “Income before taxes”13
and “Higher income before taxes”.14
From these two data sets, we rely
on the following:
•	 Average (mean) natural gas expenditures by income level
•	 Average (mean) electricity expenditures by income level
•	 Average (mean) gasoline and motor oil expenditures by income level
CALCULATIONS & ASSUMPTIONS
To run our IMPLAN model, we assume that the additional energy costs come in the form of lost consumer
income. Our approach took the following steps:
1.	 Calculate the price difference between EU and U.S. prices for electricity, natural gas, and motor fuels.
a.	 Because the BLS data aggregates “Gasoline and motor oil” as an expenditure line item, we
use a weighted average of the Gasoline and Diesel percent difference. The weighted average
is based on EIA data for “product supplied for finished gasoline” and “No 2 diesel fuel sales/
deliveries to On-highway customers” consumption figures.15
b.	 TA-Table 1 shows the difference in prices:
TA-Table 1: Residential Energy Price Differential Impacts, 2014
2.	 We apply the values in the table above to the average annual expenditre by energy type for each
income level in the BLS survey data described above. For example, consumers in the <$5,000
income bracket spent an average of $201 on natural gas in 2014. For this analysis, we multiply
this expenditure amount by the 227 percent difference from the table above to calculate a new
expenditure value of $457 for this income bracket.
a.	 We assume that under the higher price scenario, consumption would stay constant.
Implicitly, we are assuming that Americans would continue to have the same lifestyle (i.e.,
large homes, road miles traveled, etc.) under higher energy prices. Of course, demand isn’t
completely inelastic, but for simplicity and the purposes of this analysis, we assume it is.
3.	 After running the calculation above for each of the BLS income levels, we then group the income
levels to match the income level breakdown in PLEXOS.16
TA-Table 2 shows the final results of this
calculation.
US Price
(USD/unit)
EU Price
(USD/unit)
% Difference
Industrial
Electricity (MWh) $71.00 $116.96 165%
Natural Gas (mcf) $5.55 $13.50 243%
42
TA-Table 2: Average Residential Electricity, Natural Gas, and Motor Fuel
Expenditure by Income Level, 2014, ($ Billions)
4.	 Finally, once we calculate how much additional consumer expenditures would have been under
energy prices that mirror those of the EU, we are able to run IMPLAN. The values in the table above
are input into the U.S. national IMPLAN model for the year 2014 as a change in Household Income.
INDUSTRIAL MODELING ASSUMPTIONS & DATA
We relied on the following data to model the Industrial sector:
•	 US Energy Prices — Energy Information Administration (EIA) as described in Residential
section.17
•	 European Energy Prices — European Commission’s Eurostat as described in Residential
section.18
•	 Historical Exchange Rates: U.S. Internal Revenue Service (IRS).19
•	 US Industrial Energy Spending:
•	 Used the US Census Annual Survey of Manufacturers (ASM)20
data from 2014 to identify
electricity spending and fuel spending for each of the manufacturing industry codes in
IMPLAN.
•	 Matching was done by industry name; which corresponds to NAICS codes at the 4-,
5- and 6-digit levels.
•	 Used the EIA’s Manufacturing Energy Consumption Survey (MECS) to determine the
percentage of total fuel spending that natural gas represents.21
•	 Data is from 2010 (most recent year available)
Income Bracket
2014 Actual
Expenditure
Increased Price
Scenario
Difference
Less than $10k $25.5 $53.3 -$27.8
10k to 15k $20.1 $42.1 -$22.0
15k to $25k $48.8 $102.0 -$53.3
$25 to $35k $76.2 $159.4 -$55.8
$35k to $50k $73.3 $153.4 -$80.1
$50k to $75k $102.4 $214.2 -$111.8
$75k to $100k $71.7 $150.1 -$78.4
$100k to $150k $88.9 $186.1 -$97.2
$150k and more $76.0 $159.4 -$83.4
Total $582.8 $1,219.9 -$609.7
43
•	 MECS data is aggregated for some industries. Where data were not available for
detailed industries (5-digit or 6-digit NAICS), more aggregated data were used. For
example, MECS data were not available for Plastics Packaging Materials (NAICS
32611), so we used data for Plastics and Rubber Products (NAICS 326).
CALCULATIONS & ASSUMPTIONS
To calculate the impact of higher energy prices in the industrial sector, we took the following steps:
1.	 We ranked the top 25 industries based on total electricity and fuel spend from the ASM.
2.	 We increased the electricity and natural gas spend for the 25 industries by the percentage increase
calculated for the Industrial sector.
a.	 We use the EIA data described above for prices (see Residential Data section above). We run
the same calculation to compare US and EU prices. The results of this calculation are shown in
TA-Table 3.
TA-Table 3: Industrial Energy Price Differential Impacts, 2014
3.	 For each industry we reduced the Proprietor Income in IMPLAN to reflect the increase in energy
expenses.
US Price
(USD/unit)
EU Price
(USD/unit)
% Difference
Residential
Electricity (MWh) $125.2 $259.31 207%
Natural Gas (mcf) $10.97 $24.94 227%
Motor Fuels (gallons)
Gasoline $3.44 $7.42 216%
Diesel $3.83 $6.77 177%
Wtd. Gas & Diesel 207%
44
Notes
1 	 See http://www.eia.gov/
2 	 https://www.eia.gov/electricity/data/state/avgprice_annual.xls
3 	 https://www.eia.gov/dnav/ng/ng_pri_sum_a_EPG0_PRS_DMcf_a.htm
4 	 https://www.eia.gov/dnav/ng/ng_pri_sum_a_EPG0_PIN_DMcf_a.htm
5 	 https://www.eia.gov/dnav/pet/pet_pri_gnd_a_epm0_pte_dpgal_a.htm
6 	 https://www.eia.gov/dnav/pet/pet_pri_gnd_a_epd2d_pte_dpgal_a.htm
7 	 http://ec.europa.eu/eurostat
8 	 See http://ec.europa.eu/eurostat/tgm/table.do?tab=table&init=1&plugin=1&language=en&pcode=ten00117
and http://ec.europa.eu/eurostat/tgm/table.do?tab=table&init=1&plugin=1&language=en&pcode=ten00117
9 	 See http://ec.europa.eu/eurostat/tgm/table.do?tab=table&init=1&plugin=1&language=en&p-
code=ten00118 and http://ec.europa.eu/eurostat/tgm/table.do?tab=table&init=1&plugin=1&lan-
guage=en&pcode=ten00118
10 	 http://www.eea.europa.eu/data-and-maps/daviz/nominal-and-real-fuel-prices-2#tab-chart_1
11 	 https://www.irs.gov/Individuals/International-Taxpayers/Yearly-Average-Currency-Exchange-Rates
12 	 http://www.bls.gov/cex/csxcombined.htm
13 	 http://www.bls.gov/cex/2014/combined/income.xlsx
14 	 http://www.bls.gov/cex/2014/combined/higherincome.xlsx
15 	 See https://www.eia.gov/dnav/pet/pet_cons_psup_a_EPM0F_VPP_mbbl_a.htm and https://www.eia.gov/
dnav/pet/PET_CONS_821USE_A_EPD2D_VHN_MGAL_A.htm
16 	 For example, the BLS survey data has income levels broken down (for the most part) by $5,000 increments
(e.g., $15,000-$19,999). Some of the increments fit within the income levels described in Table 2, but others
do not. As an example, the BLS survey has expenditure data for the $15,000-$19,999 and $20,000-$29,999
ranges. To get the total expenditure into the IMPLAN bucket of $15-$25k, we take all of the expenditures from
the $15,000-$19,999 range plus half of the expenditures in the $20,000-$29,999 range.
17 	 See http://www.eia.gov/
18 	 http://ec.europa.eu/eurostat
19 	 https://www.irs.gov/Individuals/International-Taxpayers/Yearly-Average-Currency-Exchange-Rates
20 	 http://factfinder.census.gov/bkmk/table/1.0/en/ASM/2014/31GS101
21 	 https://www.eia.gov/consumption/manufacturing/data/2010/xls/Table3_3.xls
Institute for 21st Century Energy
U.S. Chamber of Commerce
1615 H Street, NW
Washington, DC 20062
Phone: (202) 463-5558 Fax: (202) 887-3457
energyinstitute@uschamber.com
www.energyxxi.org
AN AFFILIATE OF THE U.S.
CHAMBER OF COMMERCE

More Related Content

What's hot

1.8.2022 accelerating-climate-action-us
1.8.2022 accelerating-climate-action-us1.8.2022 accelerating-climate-action-us
1.8.2022 accelerating-climate-action-usR. Jay Olson
 
Sustainable Fitness CT Green Guide Spring 2016
Sustainable Fitness CT Green Guide Spring 2016Sustainable Fitness CT Green Guide Spring 2016
Sustainable Fitness CT Green Guide Spring 2016Tony Pontecorvo
 
The Art of the Possible: Building an Energy-Efficient America
The Art of the Possible:Building an Energy-Efficient AmericaThe Art of the Possible:Building an Energy-Efficient America
The Art of the Possible: Building an Energy-Efficient AmericaAlliance To Save Energy
 
12.21.2021 us-action-climate-change
12.21.2021  us-action-climate-change12.21.2021  us-action-climate-change
12.21.2021 us-action-climate-changeR. Jay Olson
 
Looking Ahead: 2010 and Beyond – The Decade of Energy Efficiency
Looking Ahead: 2010 and Beyond – The Decade of Energy EfficiencyLooking Ahead: 2010 and Beyond – The Decade of Energy Efficiency
Looking Ahead: 2010 and Beyond – The Decade of Energy EfficiencyAlliance To Save Energy
 
Study – change of government – british colombia - Election 2017
Study – change of government – british colombia - Election 2017Study – change of government – british colombia - Election 2017
Study – change of government – british colombia - Election 2017paul young cpa, cga
 
Analysis of global nuclear industry with emphasis on dte energy
Analysis of global nuclear industry with emphasis on dte energyAnalysis of global nuclear industry with emphasis on dte energy
Analysis of global nuclear industry with emphasis on dte energyRadhika Chittoor
 
Fuelling the energy debate
Fuelling the energy debateFuelling the energy debate
Fuelling the energy debateDiana Kool
 
Energy Sources and the Production of Electricity in the United States
Energy Sources and the Production of Electricity in the United StatesEnergy Sources and the Production of Electricity in the United States
Energy Sources and the Production of Electricity in the United StatesDavid Manukjan
 
Harvard University Study: America's Unconventional Energy Opportunity
Harvard University Study: America's Unconventional Energy OpportunityHarvard University Study: America's Unconventional Energy Opportunity
Harvard University Study: America's Unconventional Energy OpportunityMarcellus Drilling News
 
Selling Solar Abridged Boyce
Selling Solar Abridged BoyceSelling Solar Abridged Boyce
Selling Solar Abridged Boycejboyce71
 
11_TCB_Newsletter1_DD
11_TCB_Newsletter1_DD11_TCB_Newsletter1_DD
11_TCB_Newsletter1_DDJames Mister
 
Understanding Renewable Energy Businesses: Aligning Renewable Energy Firms an...
Understanding Renewable Energy Businesses: Aligning Renewable Energy Firms an...Understanding Renewable Energy Businesses: Aligning Renewable Energy Firms an...
Understanding Renewable Energy Businesses: Aligning Renewable Energy Firms an...The Solar Foundation
 
Senate Finance Committee Tax Reform Comments 4-15-15
Senate Finance Committee Tax Reform Comments 4-15-15Senate Finance Committee Tax Reform Comments 4-15-15
Senate Finance Committee Tax Reform Comments 4-15-15Scott Clausen
 
The U S Energy Outlook Will It Go From Bad To Worse
The U S Energy Outlook Will It Go From Bad To WorseThe U S Energy Outlook Will It Go From Bad To Worse
The U S Energy Outlook Will It Go From Bad To WorsePARIS
 
Economist Intelligence Unit: Energy in 2018
Economist Intelligence Unit: Energy in 2018Economist Intelligence Unit: Energy in 2018
Economist Intelligence Unit: Energy in 2018Energy for One World
 
Sierra Club Petition to Federal Trade Commission re Atlantic Coast Pipeline P...
Sierra Club Petition to Federal Trade Commission re Atlantic Coast Pipeline P...Sierra Club Petition to Federal Trade Commission re Atlantic Coast Pipeline P...
Sierra Club Petition to Federal Trade Commission re Atlantic Coast Pipeline P...Marcellus Drilling News
 

What's hot (20)

1.8.2022 accelerating-climate-action-us
1.8.2022 accelerating-climate-action-us1.8.2022 accelerating-climate-action-us
1.8.2022 accelerating-climate-action-us
 
Sustainable Fitness CT Green Guide Spring 2016
Sustainable Fitness CT Green Guide Spring 2016Sustainable Fitness CT Green Guide Spring 2016
Sustainable Fitness CT Green Guide Spring 2016
 
The Art of the Possible: Building an Energy-Efficient America
The Art of the Possible:Building an Energy-Efficient AmericaThe Art of the Possible:Building an Energy-Efficient America
The Art of the Possible: Building an Energy-Efficient America
 
12.21.2021 us-action-climate-change
12.21.2021  us-action-climate-change12.21.2021  us-action-climate-change
12.21.2021 us-action-climate-change
 
API 2016 State of American Energy
API 2016 State of American EnergyAPI 2016 State of American Energy
API 2016 State of American Energy
 
Looking Ahead: 2010 and Beyond – The Decade of Energy Efficiency
Looking Ahead: 2010 and Beyond – The Decade of Energy EfficiencyLooking Ahead: 2010 and Beyond – The Decade of Energy Efficiency
Looking Ahead: 2010 and Beyond – The Decade of Energy Efficiency
 
Study – change of government – british colombia - Election 2017
Study – change of government – british colombia - Election 2017Study – change of government – british colombia - Election 2017
Study – change of government – british colombia - Election 2017
 
Analysis of global nuclear industry with emphasis on dte energy
Analysis of global nuclear industry with emphasis on dte energyAnalysis of global nuclear industry with emphasis on dte energy
Analysis of global nuclear industry with emphasis on dte energy
 
Fuelling the energy debate
Fuelling the energy debateFuelling the energy debate
Fuelling the energy debate
 
Energy Sources and the Production of Electricity in the United States
Energy Sources and the Production of Electricity in the United StatesEnergy Sources and the Production of Electricity in the United States
Energy Sources and the Production of Electricity in the United States
 
Harvard University Study: America's Unconventional Energy Opportunity
Harvard University Study: America's Unconventional Energy OpportunityHarvard University Study: America's Unconventional Energy Opportunity
Harvard University Study: America's Unconventional Energy Opportunity
 
Selling Solar Abridged Boyce
Selling Solar Abridged BoyceSelling Solar Abridged Boyce
Selling Solar Abridged Boyce
 
11_TCB_Newsletter1_DD
11_TCB_Newsletter1_DD11_TCB_Newsletter1_DD
11_TCB_Newsletter1_DD
 
Understanding Renewable Energy Businesses: Aligning Renewable Energy Firms an...
Understanding Renewable Energy Businesses: Aligning Renewable Energy Firms an...Understanding Renewable Energy Businesses: Aligning Renewable Energy Firms an...
Understanding Renewable Energy Businesses: Aligning Renewable Energy Firms an...
 
Senate Finance Committee Tax Reform Comments 4-15-15
Senate Finance Committee Tax Reform Comments 4-15-15Senate Finance Committee Tax Reform Comments 4-15-15
Senate Finance Committee Tax Reform Comments 4-15-15
 
The U S Energy Outlook Will It Go From Bad To Worse
The U S Energy Outlook Will It Go From Bad To WorseThe U S Energy Outlook Will It Go From Bad To Worse
The U S Energy Outlook Will It Go From Bad To Worse
 
Economist Intelligence Unit: Energy in 2018
Economist Intelligence Unit: Energy in 2018Economist Intelligence Unit: Energy in 2018
Economist Intelligence Unit: Energy in 2018
 
Sierra Club Petition to Federal Trade Commission re Atlantic Coast Pipeline P...
Sierra Club Petition to Federal Trade Commission re Atlantic Coast Pipeline P...Sierra Club Petition to Federal Trade Commission re Atlantic Coast Pipeline P...
Sierra Club Petition to Federal Trade Commission re Atlantic Coast Pipeline P...
 
Wind letter-final2-11-15-11
Wind letter-final2-11-15-11Wind letter-final2-11-15-11
Wind letter-final2-11-15-11
 
Clean Energy and the Green Economy
Clean Energy and the Green EconomyClean Energy and the Green Economy
Clean Energy and the Green Economy
 

Viewers also liked

Pipeline Safety Alert: PHMSA Releases Emergency Order Interim Final Rule
Pipeline Safety Alert: PHMSA Releases Emergency Order Interim Final RulePipeline Safety Alert: PHMSA Releases Emergency Order Interim Final Rule
Pipeline Safety Alert: PHMSA Releases Emergency Order Interim Final RuleMarcellus Drilling News
 
Deutsche Bank Research - MLPs and Natural Gas
Deutsche Bank Research - MLPs and Natural GasDeutsche Bank Research - MLPs and Natural Gas
Deutsche Bank Research - MLPs and Natural GasMarcellus Drilling News
 
Pennsylvania Superior Court Decision: Doman v Atlas Energy
Pennsylvania Superior Court Decision: Doman v Atlas EnergyPennsylvania Superior Court Decision: Doman v Atlas Energy
Pennsylvania Superior Court Decision: Doman v Atlas EnergyMarcellus Drilling News
 
PA DEP Permit for Unconventional NatGas Well Site Operations and Remote Piggi...
PA DEP Permit for Unconventional NatGas Well Site Operations and Remote Piggi...PA DEP Permit for Unconventional NatGas Well Site Operations and Remote Piggi...
PA DEP Permit for Unconventional NatGas Well Site Operations and Remote Piggi...Marcellus Drilling News
 
Sixth Circuit Court of Appeals Decision in Harper v Muskingum Watershed Conse...
Sixth Circuit Court of Appeals Decision in Harper v Muskingum Watershed Conse...Sixth Circuit Court of Appeals Decision in Harper v Muskingum Watershed Conse...
Sixth Circuit Court of Appeals Decision in Harper v Muskingum Watershed Conse...Marcellus Drilling News
 
FERC Order Denying Rehearing Requested by NY AG Schneiderman re Constitution ...
FERC Order Denying Rehearing Requested by NY AG Schneiderman re Constitution ...FERC Order Denying Rehearing Requested by NY AG Schneiderman re Constitution ...
FERC Order Denying Rehearing Requested by NY AG Schneiderman re Constitution ...Marcellus Drilling News
 
U.S. EIA's Drilling Productivity Report - December 2015
U.S. EIA's Drilling Productivity Report - December 2015U.S. EIA's Drilling Productivity Report - December 2015
U.S. EIA's Drilling Productivity Report - December 2015Marcellus Drilling News
 
EPA: Control Techniques Guidelines for the Oil and Natural Gas Industry
EPA: Control Techniques Guidelines for the Oil and Natural Gas IndustryEPA: Control Techniques Guidelines for the Oil and Natural Gas Industry
EPA: Control Techniques Guidelines for the Oil and Natural Gas IndustryMarcellus Drilling News
 
NJDRC Response to PennEast's Critical Comments
NJDRC Response to PennEast's Critical CommentsNJDRC Response to PennEast's Critical Comments
NJDRC Response to PennEast's Critical CommentsMarcellus Drilling News
 
EIA Natural Gas Monthly Report - October 2016
EIA Natural Gas Monthly Report - October 2016EIA Natural Gas Monthly Report - October 2016
EIA Natural Gas Monthly Report - October 2016Marcellus Drilling News
 
NGSA's Outlook for Natural Gas Supply and Demand for 2016-2017 Winter
NGSA's Outlook for Natural Gas Supply and Demand for 2016-2017 WinterNGSA's Outlook for Natural Gas Supply and Demand for 2016-2017 Winter
NGSA's Outlook for Natural Gas Supply and Demand for 2016-2017 WinterMarcellus Drilling News
 
MSC Lawsuit Filed in PA Commonwealth Court Against Chapter 78a Drilling Regul...
MSC Lawsuit Filed in PA Commonwealth Court Against Chapter 78a Drilling Regul...MSC Lawsuit Filed in PA Commonwealth Court Against Chapter 78a Drilling Regul...
MSC Lawsuit Filed in PA Commonwealth Court Against Chapter 78a Drilling Regul...Marcellus Drilling News
 
Ohio Supreme Court Decision: Lutz v. Chesapeake Appalachia
Ohio Supreme Court Decision: Lutz v. Chesapeake AppalachiaOhio Supreme Court Decision: Lutz v. Chesapeake Appalachia
Ohio Supreme Court Decision: Lutz v. Chesapeake AppalachiaMarcellus Drilling News
 
US EIA's December 2016 Short-Term Energy Outlook
US EIA's December 2016 Short-Term Energy OutlookUS EIA's December 2016 Short-Term Energy Outlook
US EIA's December 2016 Short-Term Energy OutlookMarcellus Drilling News
 
What If...Hydraulic Fracturing Was Banned?
What If...Hydraulic Fracturing Was Banned?What If...Hydraulic Fracturing Was Banned?
What If...Hydraulic Fracturing Was Banned?Marcellus Drilling News
 
PennEast Pipeline Response to NJDRC Comments Against Pipeline Project
PennEast Pipeline Response to NJDRC Comments Against Pipeline ProjectPennEast Pipeline Response to NJDRC Comments Against Pipeline Project
PennEast Pipeline Response to NJDRC Comments Against Pipeline ProjectMarcellus Drilling News
 
PPA Commonwealth Court Case Ruling New Chapter 78a Drilling Rules are Cleared...
PPA Commonwealth Court Case Ruling New Chapter 78a Drilling Rules are Cleared...PPA Commonwealth Court Case Ruling New Chapter 78a Drilling Rules are Cleared...
PPA Commonwealth Court Case Ruling New Chapter 78a Drilling Rules are Cleared...Marcellus Drilling News
 
Decision by NH PUC to Deny Request by Eversource Energy to Strike a Long-Term...
Decision by NH PUC to Deny Request by Eversource Energy to Strike a Long-Term...Decision by NH PUC to Deny Request by Eversource Energy to Strike a Long-Term...
Decision by NH PUC to Deny Request by Eversource Energy to Strike a Long-Term...Marcellus Drilling News
 
Maryland Register - Nov 14, 2016 - New Fracking Rules
Maryland Register - Nov 14, 2016 - New Fracking RulesMaryland Register - Nov 14, 2016 - New Fracking Rules
Maryland Register - Nov 14, 2016 - New Fracking RulesMarcellus Drilling News
 

Viewers also liked (20)

Pipeline Safety Alert: PHMSA Releases Emergency Order Interim Final Rule
Pipeline Safety Alert: PHMSA Releases Emergency Order Interim Final RulePipeline Safety Alert: PHMSA Releases Emergency Order Interim Final Rule
Pipeline Safety Alert: PHMSA Releases Emergency Order Interim Final Rule
 
Deutsche Bank Research - MLPs and Natural Gas
Deutsche Bank Research - MLPs and Natural GasDeutsche Bank Research - MLPs and Natural Gas
Deutsche Bank Research - MLPs and Natural Gas
 
EIA Natural Gas Annual 2015 Report
EIA Natural Gas Annual 2015 ReportEIA Natural Gas Annual 2015 Report
EIA Natural Gas Annual 2015 Report
 
Pennsylvania Superior Court Decision: Doman v Atlas Energy
Pennsylvania Superior Court Decision: Doman v Atlas EnergyPennsylvania Superior Court Decision: Doman v Atlas Energy
Pennsylvania Superior Court Decision: Doman v Atlas Energy
 
PA DEP Permit for Unconventional NatGas Well Site Operations and Remote Piggi...
PA DEP Permit for Unconventional NatGas Well Site Operations and Remote Piggi...PA DEP Permit for Unconventional NatGas Well Site Operations and Remote Piggi...
PA DEP Permit for Unconventional NatGas Well Site Operations and Remote Piggi...
 
Sixth Circuit Court of Appeals Decision in Harper v Muskingum Watershed Conse...
Sixth Circuit Court of Appeals Decision in Harper v Muskingum Watershed Conse...Sixth Circuit Court of Appeals Decision in Harper v Muskingum Watershed Conse...
Sixth Circuit Court of Appeals Decision in Harper v Muskingum Watershed Conse...
 
FERC Order Denying Rehearing Requested by NY AG Schneiderman re Constitution ...
FERC Order Denying Rehearing Requested by NY AG Schneiderman re Constitution ...FERC Order Denying Rehearing Requested by NY AG Schneiderman re Constitution ...
FERC Order Denying Rehearing Requested by NY AG Schneiderman re Constitution ...
 
U.S. EIA's Drilling Productivity Report - December 2015
U.S. EIA's Drilling Productivity Report - December 2015U.S. EIA's Drilling Productivity Report - December 2015
U.S. EIA's Drilling Productivity Report - December 2015
 
EPA: Control Techniques Guidelines for the Oil and Natural Gas Industry
EPA: Control Techniques Guidelines for the Oil and Natural Gas IndustryEPA: Control Techniques Guidelines for the Oil and Natural Gas Industry
EPA: Control Techniques Guidelines for the Oil and Natural Gas Industry
 
NJDRC Response to PennEast's Critical Comments
NJDRC Response to PennEast's Critical CommentsNJDRC Response to PennEast's Critical Comments
NJDRC Response to PennEast's Critical Comments
 
EIA Natural Gas Monthly Report - October 2016
EIA Natural Gas Monthly Report - October 2016EIA Natural Gas Monthly Report - October 2016
EIA Natural Gas Monthly Report - October 2016
 
NGSA's Outlook for Natural Gas Supply and Demand for 2016-2017 Winter
NGSA's Outlook for Natural Gas Supply and Demand for 2016-2017 WinterNGSA's Outlook for Natural Gas Supply and Demand for 2016-2017 Winter
NGSA's Outlook for Natural Gas Supply and Demand for 2016-2017 Winter
 
MSC Lawsuit Filed in PA Commonwealth Court Against Chapter 78a Drilling Regul...
MSC Lawsuit Filed in PA Commonwealth Court Against Chapter 78a Drilling Regul...MSC Lawsuit Filed in PA Commonwealth Court Against Chapter 78a Drilling Regul...
MSC Lawsuit Filed in PA Commonwealth Court Against Chapter 78a Drilling Regul...
 
Ohio Supreme Court Decision: Lutz v. Chesapeake Appalachia
Ohio Supreme Court Decision: Lutz v. Chesapeake AppalachiaOhio Supreme Court Decision: Lutz v. Chesapeake Appalachia
Ohio Supreme Court Decision: Lutz v. Chesapeake Appalachia
 
US EIA's December 2016 Short-Term Energy Outlook
US EIA's December 2016 Short-Term Energy OutlookUS EIA's December 2016 Short-Term Energy Outlook
US EIA's December 2016 Short-Term Energy Outlook
 
What If...Hydraulic Fracturing Was Banned?
What If...Hydraulic Fracturing Was Banned?What If...Hydraulic Fracturing Was Banned?
What If...Hydraulic Fracturing Was Banned?
 
PennEast Pipeline Response to NJDRC Comments Against Pipeline Project
PennEast Pipeline Response to NJDRC Comments Against Pipeline ProjectPennEast Pipeline Response to NJDRC Comments Against Pipeline Project
PennEast Pipeline Response to NJDRC Comments Against Pipeline Project
 
PPA Commonwealth Court Case Ruling New Chapter 78a Drilling Rules are Cleared...
PPA Commonwealth Court Case Ruling New Chapter 78a Drilling Rules are Cleared...PPA Commonwealth Court Case Ruling New Chapter 78a Drilling Rules are Cleared...
PPA Commonwealth Court Case Ruling New Chapter 78a Drilling Rules are Cleared...
 
Decision by NH PUC to Deny Request by Eversource Energy to Strike a Long-Term...
Decision by NH PUC to Deny Request by Eversource Energy to Strike a Long-Term...Decision by NH PUC to Deny Request by Eversource Energy to Strike a Long-Term...
Decision by NH PUC to Deny Request by Eversource Energy to Strike a Long-Term...
 
Maryland Register - Nov 14, 2016 - New Fracking Rules
Maryland Register - Nov 14, 2016 - New Fracking RulesMaryland Register - Nov 14, 2016 - New Fracking Rules
Maryland Register - Nov 14, 2016 - New Fracking Rules
 

Similar to What If...The United States was Forced to Pay EU Energy Prices?

150 word to each part response follow up . Due 9pm 12 1816 Part1.docx
150 word to each part response follow up . Due 9pm 12 1816 Part1.docx150 word to each part response follow up . Due 9pm 12 1816 Part1.docx
150 word to each part response follow up . Due 9pm 12 1816 Part1.docxLyndonPelletier761
 
Corporate Greening 2.0
Corporate Greening 2.0Corporate Greening 2.0
Corporate Greening 2.0Bruce Harrison
 
Sustainable Investment Spotlight_ESG Trumponomics
Sustainable Investment Spotlight_ESG TrumponomicsSustainable Investment Spotlight_ESG Trumponomics
Sustainable Investment Spotlight_ESG TrumponomicsGuillaume KREPPER
 
Energy and Environmental Law and Policy in the Obama Administration
Energy and Environmental Law and Policy in the Obama AdministrationEnergy and Environmental Law and Policy in the Obama Administration
Energy and Environmental Law and Policy in the Obama Administrationjoeleisen
 
This assignment will serve as this weeks discussion, which is wor
This assignment will serve as this weeks discussion, which is worThis assignment will serve as this weeks discussion, which is wor
This assignment will serve as this weeks discussion, which is worGrazynaBroyles24
 
Government-Led Investments and the Future Economy
Government-Led Investments and the Future EconomyGovernment-Led Investments and the Future Economy
Government-Led Investments and the Future Economyourfuture
 
9th Inter-Parliamentary Meeting on Renewable Energy and Energy Efficiency
9th Inter-Parliamentary Meeting on Renewable Energy and Energy Efficiency9th Inter-Parliamentary Meeting on Renewable Energy and Energy Efficiency
9th Inter-Parliamentary Meeting on Renewable Energy and Energy EfficiencyAlliance To Save Energy
 
ECO105Y Micro Op-Ed Exemplars 2016-20.docx
ECO105Y            Micro Op-Ed Exemplars               2016-20.docxECO105Y            Micro Op-Ed Exemplars               2016-20.docx
ECO105Y Micro Op-Ed Exemplars 2016-20.docxmadlynplamondon
 
America’s energy policy
America’s energy policyAmerica’s energy policy
America’s energy policyprofessorgoff
 
The Century of Energy Efficiency: Taking it to the Cities
The Century of Energy Efficiency: Taking it to the CitiesThe Century of Energy Efficiency: Taking it to the Cities
The Century of Energy Efficiency: Taking it to the CitiesAlliance To Save Energy
 
American Support for Climate Solutions - ecoAmerica & Lake Research Partners,...
American Support for Climate Solutions - ecoAmerica & Lake Research Partners,...American Support for Climate Solutions - ecoAmerica & Lake Research Partners,...
American Support for Climate Solutions - ecoAmerica & Lake Research Partners,...Natalie Kobayashi
 
Great Energy Efficiency Day Welcome: Kateri Callahan, Alliance to Save Energy
Great Energy Efficiency Day Welcome: Kateri Callahan, Alliance to Save EnergyGreat Energy Efficiency Day Welcome: Kateri Callahan, Alliance to Save Energy
Great Energy Efficiency Day Welcome: Kateri Callahan, Alliance to Save EnergyAlliance To Save Energy
 

Similar to What If...The United States was Forced to Pay EU Energy Prices? (15)

150 word to each part response follow up . Due 9pm 12 1816 Part1.docx
150 word to each part response follow up . Due 9pm 12 1816 Part1.docx150 word to each part response follow up . Due 9pm 12 1816 Part1.docx
150 word to each part response follow up . Due 9pm 12 1816 Part1.docx
 
Corporate Greening 2.0
Corporate Greening 2.0Corporate Greening 2.0
Corporate Greening 2.0
 
Sustainable Investment Spotlight_ESG Trumponomics
Sustainable Investment Spotlight_ESG TrumponomicsSustainable Investment Spotlight_ESG Trumponomics
Sustainable Investment Spotlight_ESG Trumponomics
 
Energy and Environmental Law and Policy in the Obama Administration
Energy and Environmental Law and Policy in the Obama AdministrationEnergy and Environmental Law and Policy in the Obama Administration
Energy and Environmental Law and Policy in the Obama Administration
 
CCF-Symposium2016-SustEnergy-SessionRprt-FINAL
CCF-Symposium2016-SustEnergy-SessionRprt-FINALCCF-Symposium2016-SustEnergy-SessionRprt-FINAL
CCF-Symposium2016-SustEnergy-SessionRprt-FINAL
 
This assignment will serve as this weeks discussion, which is wor
This assignment will serve as this weeks discussion, which is worThis assignment will serve as this weeks discussion, which is wor
This assignment will serve as this weeks discussion, which is wor
 
Government-Led Investments and the Future Economy
Government-Led Investments and the Future EconomyGovernment-Led Investments and the Future Economy
Government-Led Investments and the Future Economy
 
9th Inter-Parliamentary Meeting on Renewable Energy and Energy Efficiency
9th Inter-Parliamentary Meeting on Renewable Energy and Energy Efficiency9th Inter-Parliamentary Meeting on Renewable Energy and Energy Efficiency
9th Inter-Parliamentary Meeting on Renewable Energy and Energy Efficiency
 
ECO105Y Micro Op-Ed Exemplars 2016-20.docx
ECO105Y            Micro Op-Ed Exemplars               2016-20.docxECO105Y            Micro Op-Ed Exemplars               2016-20.docx
ECO105Y Micro Op-Ed Exemplars 2016-20.docx
 
Essay
EssayEssay
Essay
 
America’s energy policy
America’s energy policyAmerica’s energy policy
America’s energy policy
 
The Century of Energy Efficiency: Taking it to the Cities
The Century of Energy Efficiency: Taking it to the CitiesThe Century of Energy Efficiency: Taking it to the Cities
The Century of Energy Efficiency: Taking it to the Cities
 
February 2023
February 2023February 2023
February 2023
 
American Support for Climate Solutions - ecoAmerica & Lake Research Partners,...
American Support for Climate Solutions - ecoAmerica & Lake Research Partners,...American Support for Climate Solutions - ecoAmerica & Lake Research Partners,...
American Support for Climate Solutions - ecoAmerica & Lake Research Partners,...
 
Great Energy Efficiency Day Welcome: Kateri Callahan, Alliance to Save Energy
Great Energy Efficiency Day Welcome: Kateri Callahan, Alliance to Save EnergyGreat Energy Efficiency Day Welcome: Kateri Callahan, Alliance to Save Energy
Great Energy Efficiency Day Welcome: Kateri Callahan, Alliance to Save Energy
 

More from Marcellus Drilling News

Five facts about shale: it’s coming back, and coming back strong
Five facts about shale: it’s coming back, and coming back strongFive facts about shale: it’s coming back, and coming back strong
Five facts about shale: it’s coming back, and coming back strongMarcellus Drilling News
 
Quarterly legislative action update: Marcellus and Utica shale region (4Q16)
Quarterly legislative action update: Marcellus and Utica shale region (4Q16)Quarterly legislative action update: Marcellus and Utica shale region (4Q16)
Quarterly legislative action update: Marcellus and Utica shale region (4Q16)Marcellus Drilling News
 
Access Northeast Pipeline Project - Dec 2016 Update
Access Northeast Pipeline Project - Dec 2016 UpdateAccess Northeast Pipeline Project - Dec 2016 Update
Access Northeast Pipeline Project - Dec 2016 UpdateMarcellus Drilling News
 
Rover Pipeline Letter to FERC Requesting Final Certificate
Rover Pipeline Letter to FERC Requesting Final CertificateRover Pipeline Letter to FERC Requesting Final Certificate
Rover Pipeline Letter to FERC Requesting Final CertificateMarcellus Drilling News
 
DOE Order Granting Elba Island LNG Right to Export to Non-FTA Countries
DOE Order Granting Elba Island LNG Right to Export to Non-FTA CountriesDOE Order Granting Elba Island LNG Right to Export to Non-FTA Countries
DOE Order Granting Elba Island LNG Right to Export to Non-FTA CountriesMarcellus Drilling News
 
LSE Study: Fracking is Revitalizing U.S. Manufacturing
LSE Study: Fracking is Revitalizing U.S. ManufacturingLSE Study: Fracking is Revitalizing U.S. Manufacturing
LSE Study: Fracking is Revitalizing U.S. ManufacturingMarcellus Drilling News
 
Letter From 24 States Asking Trump & Congress to Withdraw the Unlawful Clean ...
Letter From 24 States Asking Trump & Congress to Withdraw the Unlawful Clean ...Letter From 24 States Asking Trump & Congress to Withdraw the Unlawful Clean ...
Letter From 24 States Asking Trump & Congress to Withdraw the Unlawful Clean ...Marcellus Drilling News
 
Report: New U.S. Power Costs: by County, with Environmental Externalities
Report: New U.S. Power Costs: by County, with Environmental ExternalitiesReport: New U.S. Power Costs: by County, with Environmental Externalities
Report: New U.S. Power Costs: by County, with Environmental ExternalitiesMarcellus Drilling News
 
U.S. Crude Oil and Natural Gas Proved Reserves, Year-end 2015
U.S. Crude Oil and Natural Gas Proved Reserves, Year-end 2015U.S. Crude Oil and Natural Gas Proved Reserves, Year-end 2015
U.S. Crude Oil and Natural Gas Proved Reserves, Year-end 2015Marcellus Drilling News
 
Velocys Plan to "Build the Business" - Gas-to-Liquids Plants
Velocys Plan to "Build the Business" - Gas-to-Liquids PlantsVelocys Plan to "Build the Business" - Gas-to-Liquids Plants
Velocys Plan to "Build the Business" - Gas-to-Liquids PlantsMarcellus Drilling News
 
PA DEP Revised Permit for Natural Gas Compression Stations, Processing Plants...
PA DEP Revised Permit for Natural Gas Compression Stations, Processing Plants...PA DEP Revised Permit for Natural Gas Compression Stations, Processing Plants...
PA DEP Revised Permit for Natural Gas Compression Stations, Processing Plants...Marcellus Drilling News
 
PA DEP: Methane Reduction Strategies for Natural Gas Operations
PA DEP: Methane Reduction Strategies for Natural Gas OperationsPA DEP: Methane Reduction Strategies for Natural Gas Operations
PA DEP: Methane Reduction Strategies for Natural Gas OperationsMarcellus Drilling News
 
Northeast Gas Association's 2016 Statistical Guide
Northeast Gas Association's 2016 Statistical GuideNortheast Gas Association's 2016 Statistical Guide
Northeast Gas Association's 2016 Statistical GuideMarcellus Drilling News
 
PA PUC Responses to Auditor General's Act 13 Impact Fee Audit
PA PUC Responses to Auditor General's Act 13 Impact Fee AuditPA PUC Responses to Auditor General's Act 13 Impact Fee Audit
PA PUC Responses to Auditor General's Act 13 Impact Fee AuditMarcellus Drilling News
 
Pennsylvania Public Utility Commission Act 13/Impact Fees Audit by PA Auditor...
Pennsylvania Public Utility Commission Act 13/Impact Fees Audit by PA Auditor...Pennsylvania Public Utility Commission Act 13/Impact Fees Audit by PA Auditor...
Pennsylvania Public Utility Commission Act 13/Impact Fees Audit by PA Auditor...Marcellus Drilling News
 
Clyde Mine Discharge/Tenmile Creek Water Quality Final Report
Clyde Mine Discharge/Tenmile Creek Water Quality Final ReportClyde Mine Discharge/Tenmile Creek Water Quality Final Report
Clyde Mine Discharge/Tenmile Creek Water Quality Final ReportMarcellus Drilling News
 
FERC Order Denying Stay of Kinder Morgan's Broad Run Expansion Project
FERC Order Denying Stay of Kinder Morgan's Broad Run Expansion ProjectFERC Order Denying Stay of Kinder Morgan's Broad Run Expansion Project
FERC Order Denying Stay of Kinder Morgan's Broad Run Expansion ProjectMarcellus Drilling News
 
Final Environmental Impact Statement for NEXUS Gas Transmission Project
Final Environmental Impact Statement for NEXUS Gas Transmission ProjectFinal Environmental Impact Statement for NEXUS Gas Transmission Project
Final Environmental Impact Statement for NEXUS Gas Transmission ProjectMarcellus Drilling News
 
Schedule 13D - Stone Energy Corporation - Largest Shareholder Opposes Bankrup...
Schedule 13D - Stone Energy Corporation - Largest Shareholder Opposes Bankrup...Schedule 13D - Stone Energy Corporation - Largest Shareholder Opposes Bankrup...
Schedule 13D - Stone Energy Corporation - Largest Shareholder Opposes Bankrup...Marcellus Drilling News
 
Report: Analysis of Act 13 Spending by Pennsylvania Municipalities and Counties
Report: Analysis of Act 13 Spending by Pennsylvania Municipalities and CountiesReport: Analysis of Act 13 Spending by Pennsylvania Municipalities and Counties
Report: Analysis of Act 13 Spending by Pennsylvania Municipalities and CountiesMarcellus Drilling News
 

More from Marcellus Drilling News (20)

Five facts about shale: it’s coming back, and coming back strong
Five facts about shale: it’s coming back, and coming back strongFive facts about shale: it’s coming back, and coming back strong
Five facts about shale: it’s coming back, and coming back strong
 
Quarterly legislative action update: Marcellus and Utica shale region (4Q16)
Quarterly legislative action update: Marcellus and Utica shale region (4Q16)Quarterly legislative action update: Marcellus and Utica shale region (4Q16)
Quarterly legislative action update: Marcellus and Utica shale region (4Q16)
 
Access Northeast Pipeline Project - Dec 2016 Update
Access Northeast Pipeline Project - Dec 2016 UpdateAccess Northeast Pipeline Project - Dec 2016 Update
Access Northeast Pipeline Project - Dec 2016 Update
 
Rover Pipeline Letter to FERC Requesting Final Certificate
Rover Pipeline Letter to FERC Requesting Final CertificateRover Pipeline Letter to FERC Requesting Final Certificate
Rover Pipeline Letter to FERC Requesting Final Certificate
 
DOE Order Granting Elba Island LNG Right to Export to Non-FTA Countries
DOE Order Granting Elba Island LNG Right to Export to Non-FTA CountriesDOE Order Granting Elba Island LNG Right to Export to Non-FTA Countries
DOE Order Granting Elba Island LNG Right to Export to Non-FTA Countries
 
LSE Study: Fracking is Revitalizing U.S. Manufacturing
LSE Study: Fracking is Revitalizing U.S. ManufacturingLSE Study: Fracking is Revitalizing U.S. Manufacturing
LSE Study: Fracking is Revitalizing U.S. Manufacturing
 
Letter From 24 States Asking Trump & Congress to Withdraw the Unlawful Clean ...
Letter From 24 States Asking Trump & Congress to Withdraw the Unlawful Clean ...Letter From 24 States Asking Trump & Congress to Withdraw the Unlawful Clean ...
Letter From 24 States Asking Trump & Congress to Withdraw the Unlawful Clean ...
 
Report: New U.S. Power Costs: by County, with Environmental Externalities
Report: New U.S. Power Costs: by County, with Environmental ExternalitiesReport: New U.S. Power Costs: by County, with Environmental Externalities
Report: New U.S. Power Costs: by County, with Environmental Externalities
 
U.S. Crude Oil and Natural Gas Proved Reserves, Year-end 2015
U.S. Crude Oil and Natural Gas Proved Reserves, Year-end 2015U.S. Crude Oil and Natural Gas Proved Reserves, Year-end 2015
U.S. Crude Oil and Natural Gas Proved Reserves, Year-end 2015
 
Velocys Plan to "Build the Business" - Gas-to-Liquids Plants
Velocys Plan to "Build the Business" - Gas-to-Liquids PlantsVelocys Plan to "Build the Business" - Gas-to-Liquids Plants
Velocys Plan to "Build the Business" - Gas-to-Liquids Plants
 
PA DEP Revised Permit for Natural Gas Compression Stations, Processing Plants...
PA DEP Revised Permit for Natural Gas Compression Stations, Processing Plants...PA DEP Revised Permit for Natural Gas Compression Stations, Processing Plants...
PA DEP Revised Permit for Natural Gas Compression Stations, Processing Plants...
 
PA DEP: Methane Reduction Strategies for Natural Gas Operations
PA DEP: Methane Reduction Strategies for Natural Gas OperationsPA DEP: Methane Reduction Strategies for Natural Gas Operations
PA DEP: Methane Reduction Strategies for Natural Gas Operations
 
Northeast Gas Association's 2016 Statistical Guide
Northeast Gas Association's 2016 Statistical GuideNortheast Gas Association's 2016 Statistical Guide
Northeast Gas Association's 2016 Statistical Guide
 
PA PUC Responses to Auditor General's Act 13 Impact Fee Audit
PA PUC Responses to Auditor General's Act 13 Impact Fee AuditPA PUC Responses to Auditor General's Act 13 Impact Fee Audit
PA PUC Responses to Auditor General's Act 13 Impact Fee Audit
 
Pennsylvania Public Utility Commission Act 13/Impact Fees Audit by PA Auditor...
Pennsylvania Public Utility Commission Act 13/Impact Fees Audit by PA Auditor...Pennsylvania Public Utility Commission Act 13/Impact Fees Audit by PA Auditor...
Pennsylvania Public Utility Commission Act 13/Impact Fees Audit by PA Auditor...
 
Clyde Mine Discharge/Tenmile Creek Water Quality Final Report
Clyde Mine Discharge/Tenmile Creek Water Quality Final ReportClyde Mine Discharge/Tenmile Creek Water Quality Final Report
Clyde Mine Discharge/Tenmile Creek Water Quality Final Report
 
FERC Order Denying Stay of Kinder Morgan's Broad Run Expansion Project
FERC Order Denying Stay of Kinder Morgan's Broad Run Expansion ProjectFERC Order Denying Stay of Kinder Morgan's Broad Run Expansion Project
FERC Order Denying Stay of Kinder Morgan's Broad Run Expansion Project
 
Final Environmental Impact Statement for NEXUS Gas Transmission Project
Final Environmental Impact Statement for NEXUS Gas Transmission ProjectFinal Environmental Impact Statement for NEXUS Gas Transmission Project
Final Environmental Impact Statement for NEXUS Gas Transmission Project
 
Schedule 13D - Stone Energy Corporation - Largest Shareholder Opposes Bankrup...
Schedule 13D - Stone Energy Corporation - Largest Shareholder Opposes Bankrup...Schedule 13D - Stone Energy Corporation - Largest Shareholder Opposes Bankrup...
Schedule 13D - Stone Energy Corporation - Largest Shareholder Opposes Bankrup...
 
Report: Analysis of Act 13 Spending by Pennsylvania Municipalities and Counties
Report: Analysis of Act 13 Spending by Pennsylvania Municipalities and CountiesReport: Analysis of Act 13 Spending by Pennsylvania Municipalities and Counties
Report: Analysis of Act 13 Spending by Pennsylvania Municipalities and Counties
 

Recently uploaded

Transformative Leadership: N Chandrababu Naidu and TDP's Vision for Innovatio...
Transformative Leadership: N Chandrababu Naidu and TDP's Vision for Innovatio...Transformative Leadership: N Chandrababu Naidu and TDP's Vision for Innovatio...
Transformative Leadership: N Chandrababu Naidu and TDP's Vision for Innovatio...srinuseo15
 
*Navigating Electoral Terrain: TDP's Performance under N Chandrababu Naidu's ...
*Navigating Electoral Terrain: TDP's Performance under N Chandrababu Naidu's ...*Navigating Electoral Terrain: TDP's Performance under N Chandrababu Naidu's ...
*Navigating Electoral Terrain: TDP's Performance under N Chandrababu Naidu's ...anjanibaddipudi1
 
04052024_First India Newspaper Jaipur.pdf
04052024_First India Newspaper Jaipur.pdf04052024_First India Newspaper Jaipur.pdf
04052024_First India Newspaper Jaipur.pdfFIRST INDIA
 
America Is the Target; Israel Is the Front Line _ Andy Blumenthal _ The Blogs...
America Is the Target; Israel Is the Front Line _ Andy Blumenthal _ The Blogs...America Is the Target; Israel Is the Front Line _ Andy Blumenthal _ The Blogs...
America Is the Target; Israel Is the Front Line _ Andy Blumenthal _ The Blogs...Andy (Avraham) Blumenthal
 
China's soft power in 21st century .pptx
China's soft power in 21st century   .pptxChina's soft power in 21st century   .pptx
China's soft power in 21st century .pptxYasinAhmad20
 
The political system of the united kingdom
The political system of the united kingdomThe political system of the united kingdom
The political system of the united kingdomlunadelior
 
Politician uddhav thackeray biography- Full Details
Politician uddhav thackeray biography- Full DetailsPolitician uddhav thackeray biography- Full Details
Politician uddhav thackeray biography- Full DetailsVoterMood
 
THE OBSTACLES THAT IMPEDE THE DEVELOPMENT OF BRAZIL IN THE CONTEMPORARY ERA A...
THE OBSTACLES THAT IMPEDE THE DEVELOPMENT OF BRAZIL IN THE CONTEMPORARY ERA A...THE OBSTACLES THAT IMPEDE THE DEVELOPMENT OF BRAZIL IN THE CONTEMPORARY ERA A...
THE OBSTACLES THAT IMPEDE THE DEVELOPMENT OF BRAZIL IN THE CONTEMPORARY ERA A...Faga1939
 
422524114-Patriarchy-Kamla-Bhasin gg.pdf
422524114-Patriarchy-Kamla-Bhasin gg.pdf422524114-Patriarchy-Kamla-Bhasin gg.pdf
422524114-Patriarchy-Kamla-Bhasin gg.pdflambardar420420
 
KING VISHNU BHAGWANON KA BHAGWAN PARAMATMONKA PARATOMIC PARAMANU KASARVAMANVA...
KING VISHNU BHAGWANON KA BHAGWAN PARAMATMONKA PARATOMIC PARAMANU KASARVAMANVA...KING VISHNU BHAGWANON KA BHAGWAN PARAMATMONKA PARATOMIC PARAMANU KASARVAMANVA...
KING VISHNU BHAGWANON KA BHAGWAN PARAMATMONKA PARATOMIC PARAMANU KASARVAMANVA...IT Industry
 
declarationleaders_sd_re_greens_theleft_5.pdf
declarationleaders_sd_re_greens_theleft_5.pdfdeclarationleaders_sd_re_greens_theleft_5.pdf
declarationleaders_sd_re_greens_theleft_5.pdfssuser5750e1
 
Dubai Call Girls Pinky O525547819 Call Girl's In Dubai
Dubai Call Girls Pinky O525547819 Call Girl's In DubaiDubai Call Girls Pinky O525547819 Call Girl's In Dubai
Dubai Call Girls Pinky O525547819 Call Girl's In Dubaikojalkojal131
 
{Qatar{^🚀^(+971558539980**}})Abortion Pills for Sale in Dubai. .abu dhabi, sh...
{Qatar{^🚀^(+971558539980**}})Abortion Pills for Sale in Dubai. .abu dhabi, sh...{Qatar{^🚀^(+971558539980**}})Abortion Pills for Sale in Dubai. .abu dhabi, sh...
{Qatar{^🚀^(+971558539980**}})Abortion Pills for Sale in Dubai. .abu dhabi, sh...hyt3577
 
06052024_First India Newspaper Jaipur.pdf
06052024_First India Newspaper Jaipur.pdf06052024_First India Newspaper Jaipur.pdf
06052024_First India Newspaper Jaipur.pdfFIRST INDIA
 
Unveiling the Characteristics of Political Institutions_ A Comprehensive Anal...
Unveiling the Characteristics of Political Institutions_ A Comprehensive Anal...Unveiling the Characteristics of Political Institutions_ A Comprehensive Anal...
Unveiling the Characteristics of Political Institutions_ A Comprehensive Anal...tewhimanshu23
 
Job-Oriеntеd Courses That Will Boost Your Career in 2024
Job-Oriеntеd Courses That Will Boost Your Career in 2024Job-Oriеntеd Courses That Will Boost Your Career in 2024
Job-Oriеntеd Courses That Will Boost Your Career in 2024Insiger
 
10052024_First India Newspaper Jaipur.pdf
10052024_First India Newspaper Jaipur.pdf10052024_First India Newspaper Jaipur.pdf
10052024_First India Newspaper Jaipur.pdfFIRST INDIA
 
05052024_First India Newspaper Jaipur.pdf
05052024_First India Newspaper Jaipur.pdf05052024_First India Newspaper Jaipur.pdf
05052024_First India Newspaper Jaipur.pdfFIRST INDIA
 

Recently uploaded (20)

Transformative Leadership: N Chandrababu Naidu and TDP's Vision for Innovatio...
Transformative Leadership: N Chandrababu Naidu and TDP's Vision for Innovatio...Transformative Leadership: N Chandrababu Naidu and TDP's Vision for Innovatio...
Transformative Leadership: N Chandrababu Naidu and TDP's Vision for Innovatio...
 
*Navigating Electoral Terrain: TDP's Performance under N Chandrababu Naidu's ...
*Navigating Electoral Terrain: TDP's Performance under N Chandrababu Naidu's ...*Navigating Electoral Terrain: TDP's Performance under N Chandrababu Naidu's ...
*Navigating Electoral Terrain: TDP's Performance under N Chandrababu Naidu's ...
 
9953056974 Call Girls In Pratap Nagar, Escorts (Delhi) NCR
9953056974 Call Girls In Pratap Nagar, Escorts (Delhi) NCR9953056974 Call Girls In Pratap Nagar, Escorts (Delhi) NCR
9953056974 Call Girls In Pratap Nagar, Escorts (Delhi) NCR
 
04052024_First India Newspaper Jaipur.pdf
04052024_First India Newspaper Jaipur.pdf04052024_First India Newspaper Jaipur.pdf
04052024_First India Newspaper Jaipur.pdf
 
America Is the Target; Israel Is the Front Line _ Andy Blumenthal _ The Blogs...
America Is the Target; Israel Is the Front Line _ Andy Blumenthal _ The Blogs...America Is the Target; Israel Is the Front Line _ Andy Blumenthal _ The Blogs...
America Is the Target; Israel Is the Front Line _ Andy Blumenthal _ The Blogs...
 
China's soft power in 21st century .pptx
China's soft power in 21st century   .pptxChina's soft power in 21st century   .pptx
China's soft power in 21st century .pptx
 
The political system of the united kingdom
The political system of the united kingdomThe political system of the united kingdom
The political system of the united kingdom
 
Politician uddhav thackeray biography- Full Details
Politician uddhav thackeray biography- Full DetailsPolitician uddhav thackeray biography- Full Details
Politician uddhav thackeray biography- Full Details
 
THE OBSTACLES THAT IMPEDE THE DEVELOPMENT OF BRAZIL IN THE CONTEMPORARY ERA A...
THE OBSTACLES THAT IMPEDE THE DEVELOPMENT OF BRAZIL IN THE CONTEMPORARY ERA A...THE OBSTACLES THAT IMPEDE THE DEVELOPMENT OF BRAZIL IN THE CONTEMPORARY ERA A...
THE OBSTACLES THAT IMPEDE THE DEVELOPMENT OF BRAZIL IN THE CONTEMPORARY ERA A...
 
422524114-Patriarchy-Kamla-Bhasin gg.pdf
422524114-Patriarchy-Kamla-Bhasin gg.pdf422524114-Patriarchy-Kamla-Bhasin gg.pdf
422524114-Patriarchy-Kamla-Bhasin gg.pdf
 
KING VISHNU BHAGWANON KA BHAGWAN PARAMATMONKA PARATOMIC PARAMANU KASARVAMANVA...
KING VISHNU BHAGWANON KA BHAGWAN PARAMATMONKA PARATOMIC PARAMANU KASARVAMANVA...KING VISHNU BHAGWANON KA BHAGWAN PARAMATMONKA PARATOMIC PARAMANU KASARVAMANVA...
KING VISHNU BHAGWANON KA BHAGWAN PARAMATMONKA PARATOMIC PARAMANU KASARVAMANVA...
 
call girls inMahavir Nagar (delhi) call me [🔝9953056974🔝] escort service 24X7
call girls inMahavir Nagar  (delhi) call me [🔝9953056974🔝] escort service 24X7call girls inMahavir Nagar  (delhi) call me [🔝9953056974🔝] escort service 24X7
call girls inMahavir Nagar (delhi) call me [🔝9953056974🔝] escort service 24X7
 
declarationleaders_sd_re_greens_theleft_5.pdf
declarationleaders_sd_re_greens_theleft_5.pdfdeclarationleaders_sd_re_greens_theleft_5.pdf
declarationleaders_sd_re_greens_theleft_5.pdf
 
Dubai Call Girls Pinky O525547819 Call Girl's In Dubai
Dubai Call Girls Pinky O525547819 Call Girl's In DubaiDubai Call Girls Pinky O525547819 Call Girl's In Dubai
Dubai Call Girls Pinky O525547819 Call Girl's In Dubai
 
{Qatar{^🚀^(+971558539980**}})Abortion Pills for Sale in Dubai. .abu dhabi, sh...
{Qatar{^🚀^(+971558539980**}})Abortion Pills for Sale in Dubai. .abu dhabi, sh...{Qatar{^🚀^(+971558539980**}})Abortion Pills for Sale in Dubai. .abu dhabi, sh...
{Qatar{^🚀^(+971558539980**}})Abortion Pills for Sale in Dubai. .abu dhabi, sh...
 
06052024_First India Newspaper Jaipur.pdf
06052024_First India Newspaper Jaipur.pdf06052024_First India Newspaper Jaipur.pdf
06052024_First India Newspaper Jaipur.pdf
 
Unveiling the Characteristics of Political Institutions_ A Comprehensive Anal...
Unveiling the Characteristics of Political Institutions_ A Comprehensive Anal...Unveiling the Characteristics of Political Institutions_ A Comprehensive Anal...
Unveiling the Characteristics of Political Institutions_ A Comprehensive Anal...
 
Job-Oriеntеd Courses That Will Boost Your Career in 2024
Job-Oriеntеd Courses That Will Boost Your Career in 2024Job-Oriеntеd Courses That Will Boost Your Career in 2024
Job-Oriеntеd Courses That Will Boost Your Career in 2024
 
10052024_First India Newspaper Jaipur.pdf
10052024_First India Newspaper Jaipur.pdf10052024_First India Newspaper Jaipur.pdf
10052024_First India Newspaper Jaipur.pdf
 
05052024_First India Newspaper Jaipur.pdf
05052024_First India Newspaper Jaipur.pdf05052024_First India Newspaper Jaipur.pdf
05052024_First India Newspaper Jaipur.pdf
 

What If...The United States was Forced to Pay EU Energy Prices?

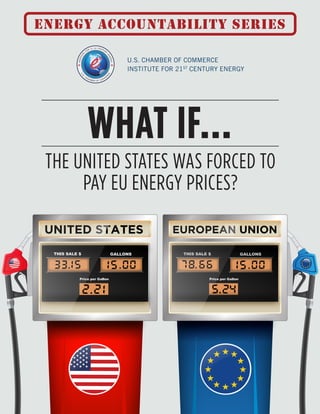
  • 1. WHAT IF... energy accountability series UNITED STATES EUROPEAN UNION THE UNITED STATES WAS FORCED TO PAY EU ENERGY PRICES?
  • 2. OUR MISSION The mission of the U.S. Chamber of Commerce’s Institute for 21st Century Energy is to unify policymakers, regulators, business leaders, and the American public behind a common sense energy strategy to help keep America secure, prosperous, and clean. Through policy development, education, and advocacy, the Institute is building support for meaningful action at the local, state, national, and international levels. The U.S. Chamber of Commerce is the world’s largest business federation representing the interests of more than 3 million businesses of all sizes, sectors, and regions, as well as state and local chambers and industry associations. Copyright © 2013 by the United States Chamber of Commerce. All rights reserved. No part of this publication may be reproduced or transmitted in any form—print, electronic, or otherwise—without the express written permission of the publisher. This paper marks the third in a series of reports that we will be releasing this fall, each taking a substantive look at what might have happened in the past – or could happen in the future – if certain energy-related ideas and policy prescriptions put forth by prominent politicians and their supporters were actually adopted. We’re calling it the Energy Accountability Series. Certainly, one doesn’t need to look far these days to find platforms or outlets that claim to be definitive “fact-checkers” of all manner of utterances candidates make on the campaign trail. On that, the Energy Accountability Series will not seek to reinvent the wheel. What we are much more interested in – and what we think will be much more valuable to voters, as well – is taking a step back to better understand (and quantify where possible) the real-world, economy-wide consequences of living in a world in which candidates’ rhetoric on critical energy issues were to become reality. Too often, there is a temptation to dismiss statements made by candidates as things said “off the cuff,” or in the “heat of the moment,” or offered up merely to “appeal to their base.”This is incredibly cynical, and it needs to change. A candidate’s views and the things he or she says and does to win the support of interest groups have a real impact on how policy is shaped, and ultimately implemented. That is especially true on energy issues today, as groups continue to advance a “Keep It In the Ground” agenda that, if adopted, would force our country to surrender the enormous domestic benefits and clear, global competitive advantages that increased energy development here at home have made possible. Accordingly, candidates and public opinion leaders should be taken at their word, and this series will evaluate what those words would mean for America. The Energy Accountability Series will ask the tough questions and provide quantitative, clear-eyed answers on the full impacts and implications of these policies, and it will do so irrespective of which candidates, groups or political parties happen to support or oppose them. Our hope is that these reports help promote and inform a fact-based debate of the critical energy issues facing our country. Armed with this information, voters will have the opportunity this fall to make the right choices for themselves and their families. energy accountability series About the Copyright © 2016 by the United States Chamber of Commerce. All rights reserved. No part of this publication may be reproduced or transmitted in any form—print, electronic, or otherwise—without the express written permission of the publisher.
  • 3. With the presidential election just around the corner, voters are trying to better understand the practical implications of the various policy ideas and proposals being put forth. Over the course of the campaign, some interest groups have sought to persuade candidates to support implementing European-style energy policies in the United States. And, at least on some level, it appears that effort has been successful, with a number of candidates today making explicit statements in support of the kind of government controls over energy production and consumption that exist today in the European Union (EU). For example, U.S. Sen. Bernie Sanders structured his entire energy and environmental policy platform around the adoption of a carbon dioxide reduction plan taken directly from the EU, promising a 40 percent cut in emissions below 1990 levels by 2030. Secretary Hillary Clinton, the Democratic nominee, has vowed to “stop fossil fuels” from being produced on federal lands, and her party’s platform supports a federal renewable electricity mandate of 50 percent by 2027. This goes well beyond anything proposed by the current administration, and even exceeds the EU’s renewable energy target of 27 percent by 2030. The trend toward European-style policies across a range of different issues (especially energy) was best summarized by Sanders during a debate earlier this year in Las Vegas.“I think,” he said, that “we should look to countries like Denmark, like Sweden, and Norway and learn from what they have accomplished.” Later, at Sanders’s insistence, environmental activist Bill McKibben – a staunch opponent of fossil fuels – was appointed to the platform committee of the Democratic National Convention. Among other things, McKibben has called on the federal government to “raise the price of fossil fuels” to make the U.S.“look more like Denmark” and praised Germany for implementing a solar energy policy that “has nothing to do with technology or location – it’s all political will.” With high taxes, restrictive environmental policies, and a heavy reliance on imports, EU businesses and residents pay more than U.S. consumers for electricity, natural gas, motor fuel, and just about every other form of consumable energy. Energy prices play a large part in the performance and competitiveness of the overall economy. High energy prices have a negative impact on the economy – from lower gross domestic product (GDP) growth to fewer jobs and decreased household income. What if the U.S. was Forced to Pay EU Prices for Its Energy?
  • 4. One European business leader summed up European’s dire energy situation this way: “I can see green taxes, I can see no shale gas, I can see closure of nuclear, I can see manufacturing being driven away. I can see the competition authorities in Brussels blissfully unaware of the tsunami of imported product heading this way and standing blindly in the way of sensible restructuring . . . It’s not looking good for Europe, we are rabbits caught in the headlights, and we have got our trousers down.” The goal of this study, and others to follow it, is to help public audiences better understand and visualize how our country, our economy and their own individual households might be impacted under a scenario in which candidates’ statements and positions as they relate to this issue were converted into policy and implemented on a national basis. Below are just a few examples of the political rhetoric we continue to see and hear from those who seek to make energy harder to find and more expensive to consume – just like it is in Europe:
  • 5. The easiest thing to do is raise the price of fossil fuels. If that had been done decades ago in the U.S., it would look more like Denmark ...” Bill McKibben, founder of 350.org & DNC platform committee member; Feb. 15, 2016 “If the tax on gasoline were higher, people would alter their behavior to drive less … [A] tax exceeding $2 a gallon makes sense. Gregory Mankiw, former chairman, Council of Economic Advisers, Jan. 21, 2012 The $10 price per barrel is still just a fraction of the cost carbon imposes on our country, but it’s a start.” 350.org, Feb. 4, 2016 “The Clean Power Plan is likely to transform the US power industry just as [renewable energy] targets have radically changed the European energy landscape. Gerard Reid, Adjunct Prof. of Business, Imperial College London, April 8, 2015 And think of what’s happening in countries like Spain [and] Germany … where they’re making real investments in renewable energy. They’re surging ahead of us … There is no reason we can’t do the same thing right here in America.” President-elect Barack Obama, Jan. 19, 2009 I think we should look to countries like Denmark, like Sweden and Norway, and learn from what they have accomplished.” U.S. Sen. Bernie Sanders (D-Vt); Oct. 13, 2015 “Somehow we have to figure out how to boost the price of gasoline to the levels in Europe. Steven Chu, Former U.S. Energy Secretary, Dec. 12, 2008 “ “ “ “ ” ” ”
  • 6. 3
  • 7. Contents Executive Summary EU Policy Review Energy Price Comparison: United States vs. EU Macroeconomic Review Scenario Analysis: Energy Price Impact1 Technical Appendix State-Level Analyses (CO, IL, IN, MI, FL, OH, WI) 3 5 11 15 21 29 39
  • 8. 1
  • 10. 2 Over the past several years, some interest groups have argued in favor of implementing European-style energy policies in the United States—a notion that dates back to the beginning of the Obama administration. Over time, these efforts have led to leading political candidates today making explicit statements in support of the kind of government controls over energy production and consumption that exist today in the European Union (EU).1 As a result of the policies imposed by European governments, residents of EU member countries pay significantly higher prices than U.S. consumers for every type of energy they consume. In recognition of this reality, and set against the backdrop of a political season in which candidates have looked to the EU for energy policy inspiration, the question we seek to answer in this report is: What would happen to U.S. households, businesses and the broader economy if Europe’s energy policies and prices were imposed here? There are large differences between the EU and the United States in the way energy is accessed, delivered, transported, taxed, and regulated. The Energy Institute’s analysis identifies four key factors, detailed in the report, that conspire to make energy more costly to consume in Europe and much harder to produce relative to the United States: • Wholesale restrictions in place in EU countries that inhibit access to low-cost, existing electricity supply and potentially abundant upstream oil and natural gas supplies; • More generous subsidies provided by EU members for otherwise uneconomic alternative technologies; • EU policies in place that impose a tax or fee on carbon emissions; and • Much higher taxes on energy consumption in the EU Taken together, these four factors have held the European economy back and given the United States (and other low-cost energy countries) a major advantage in the global marketplace. In fact, the Energy Institute’s analysis found European electricity, natural gas, and motor fuel, energy prices over the past several years have ranged from between 1.6 to 2.4 times greater than U.S. prices per unit of energy consumed. The IMPLAN model was used to help determine how these policy differences might affect key performance components of the U.S. economy if they were implemented here. European energy policies and prices would impose a $676 billion drag on the U.S. residential sector and a $31 billion hit to the industrial sector on an annual basis, based on 2014 data. The average American household would be forced to pay $4,800 more per year (or $400 per month) for their energy than they do today The increase in residential energy prices would have the effect of eliminating the equivalent of 7.7 million jobs in the United States, owing to depressed demand for labor. Separately, another 273,000 jobs would be lost due to the increase in industrial energy prices; and Lost labor income tied to the increase in residential energy prices would total $364 billion, in addition to a $17 billion loss on the industrial side – again, all on annual basis. KEY FINDINGS
  • 11. 3 STATE-LEVEL IMPACTS In addition to modeling the aggregate impacts of these European policies and prices on the U.S. economy, the Energy Institute selected a number of states with significant industrial and manufacturing activity to illustrate how energy costs comparable to those in the EU might look and feel on a more local and regional level. The six states we modeled that fit this description are: Colorado, Illinois, Indiana, Michigan, Ohio and Wisconsin. Additionally, we conducted impact-modeling on a seventh state, Florida, to evaluate how energy cost-increases could affect that state’s large fixed-income population. Using IMPLAN’s state-level macroeconomic mode to estimate the impacts of a residential price increase to the EU level, we estimate that each of these states would lose billions of dollars in state GDP and labor income, and hemorrhage tens of thousands of jobs. These state-level impacts are summarized in Table 1. In addition to the residential sector impacts described above, the Energy Institute examined the potential “economic value at risk” for the top 25 energy-intensive industries in these states. Here, we define economic value at risk as the total economic contribution that an industry provides, inclusive of multiplier (i.e., ripple) effects. Table 2 depicts the economic value at risk more broadly if the top 25 energy-intensive industries were to disappear or be significantly adversely impacted in the states we examined. As this analysis shows, Europe provides a cautionary tale. Regulatory structures -- including the Emissions Trading System, taxes, user fees, large subsidies, and mandates -- all conspire to make Europe’s energy prices among the highest in the world. Exorbitant energy prices are turning Europe’s energy-intensive industries into endangered species, and they would do the same thing here if given the chance. Table 1: State Level Impact from Residential & Industrial Energy Price Increase (2014) Table 2: State-level Economic Value at Risk of the Top 25 Energy-Intensive Sectors (2014) Economic Impact Colorado Florida Illinois Indiana Michigan Ohio Wisconsin Lost State GDP (billions) $6.8 $28.5 $17.4 $7.8 $11.9 $14.8 $6.3 Lost Labor Income (billions) $3.9 $15.9 $9.9 $4.3 $6.8 $8.2 $3.5 Lost Annual Employment (FTE – 1,000s) 84.2 377.4 201.2 104.1 159.6 187.2 81.5 Annual Energy Cost Increase (per household) $4,730 $4,980 $5,230 $5,450 $5,310 $5,000 $4,720 Economic Impact Colorado Florida Illinois Indiana Michigan Ohio Wisconsin State GDP (billions) $11.7 $31.7 $48.9 $60.3 $52.2 $57.2 $40.6 Labor Income (billions) $6.8 $18.2 $30.6 $26.2 $31.5 $29.9 $25.1 Annual Employment (FTE – 1,000s) 115.7 338.8 492.9 427.2 521.0 512.8 447.8
  • 12. 4 CITATIONS 1 For purposes of this report, our analysis is focused on the aggregate of the 28 countries included in the EU. For a list of all 28 countries, see: https://www.gov.uk/eu-eea
  • 14. 6 Electricity, natural gas, and motor fuel prices are in each case higher – and, in some cases, significantly higher – in EU countries than they are in the United States. Upon closer review, there are four main drivers that largely explain this phenomenon: 1. Wholesale restrictions in the EU on access to low-cost, existing electricity supply and potentially abundant upstream oil and natural gas supplies A number of European nations have imposed country-wide regulations whose explicit intent is to restrict access to, and consumption of, otherwise lower-cost energy supplies, driving up prices currently being paid by consumers. Germany, for example, announced plans in 2011 to close all of its nuclear generation capacity by 2022. Replacing this generation with renewable – or even hydrocarbon-derived – energy will have the effect of driving up the delivered price of electricity to end-consumers. Additionally, the EU’s collective policy position of shunning development of much of its natural gas and crude supplies has resulted in a significant and arguably unhealthy reliance on non-EU imports (Figure 1). The continent is dependent on others for 70 percent of its natural gas and 88 percent of its crude oil (as compared with four percent and 27 percent in the U.S., respectively). Not only does this have obvious price implications, it also has a deleterious impact on Europe’s security and geopolitical standing. 2. More generous energy subsidies The EU’s environmental and energy policies have been highly favorable toward alternative sources, such as wind and solar. In fact, from 2005 to 2015, the EU invested over $750 billion in renewable energy, while the U.S. spent $330 billion.1 As an example of this massive build-out of renewables, Germany – a country with roughly the same solar potential as Alaska2 – has become one of the leading solar photovoltaic markets in the world. In 2015 alone, Germany’s renewable energy portfolio provided the country with a third of its energy.3 However, this technology has not come cheaply (or with full reliability). The subsidies provided by the government to fuel the expansion of renewable energy have been paid for by consumers, mostly in the form of a separate Figure 1: Natural Gas and Oil Total Net Imports and as a Percent of Consumption 2014 Source: BP Statistical Review of World Energy June 2015 and Eurostat
  • 15. 7 and specific renewables surcharge. In 2014, this surcharge alone accounted for approximately 21 percent of the average customer’s bill.4 Moreover, dealing with large amounts of intermittent power can lead to higher prices by increasing grid balancing costs. 3. Policies that impose a tax or fee on carbon emissions Restrictive regulations, such as the EU ETS,5 taxes on carbon emissions, and the Large Combustion Plant Directive,6 have had an obvious and direct impact on energy prices. As more restrictive emissions targets are imposed over time, more fossil-fired generation is being shut down. One analyst recently noted that “fossil generators are facing an increasingly difficult operating environment, with a poor demand outlook, aging fleet, subsidies for renewables and policies to reduce emissions all having their hand in closures.”7 The EU ETS – which created Europe’s carbon trading market – represents another policy mechanism that has added to the cost of energy. The ETS is the world’s largest carbon cap-and-trade market and has existed since 2005. It covers GHG emissions from power and heat generation, energy-intensive industrial and manufacturing,8 and civil aviation sectors in 31 countries.9,10 In 2014, CO2 prices averaged €5.88 ($6.47) per metric ton,11 which amounts to approximately €6.92 ($7.62) per megawatt hour of electricity produced12 or a 17 percent premium over the average, wholesale cost of electricity produced in Europe.13 The EU ETS is a major element in the bloc’s program to cut GHG emissions 40 percent below 1990 levels by 2030. It penalizes higher carbon- emitting technologies with a carbon price, thereby also providing a subsidy to renewables. While many legislative attempts have been made in the U.S. to implement a carbon cap-and-trade at the national level, they have failed and only a handful of mostly coastal states have moved ahead with their own versions of cap-and-trade.14 4. Higher taxes on energy consumption Higher taxes and fees on energy consumption is one of the main drivers of higher energy prices in the EU. In fact, according to a 2015 report from the OECD on taxing energy use, the “highest overall tax rates tend to be seen in countries which are members of the European Union.”15 The report goes on to note that the “energy tax policy is significantly shaped by the 2003 EU Energy Taxation Directive, which sets minimum tax rates for a wide range of energy commodities.”16 While the goal of this policy is to “reduce distortions caused by divergent national tax rates, remove competitive distortions between mineral oils and other (unlegislated) energy products, and create incentives for energy- efficiency and emission reductions,”17 it creates higher prices for consumers and businesses. For example, Figure 2 illustrates the effective energy18 and carbon-dioxide tax rates across various countries. These rates are substantially higher in the EU – approximately 20 times higher – than in the United States.
  • 16. 8 In 2014, the EIA conducted an analysis that compared residential electricity prices in the EU with those in the United States. The results align with the findings in the charts above. That is, taxes are much higher in the EU, which contribute directly to the overall higher cost of energy. For example, in 2013, EU countries taxed residential electricity rates at an average of 31 percent, with a low of five percent (UK) and a high of 57 percent (Denmark).19 For motor fuel, at $3.36 per gallon, gasoline taxes in the EU are almost 7 times higher than the U.S.; at $2.38 per gallon, diesel taxes are 4 times higher. Figure 2: Economy-wide Average Effective Tax Rates on Energy (left) and on CO2 from Energy (right) Source: OECD (2015). Tax rates are as of April 1, 2012. U.S. figures do not include state taxes
  • 17. 9 CITATIONS 1 United Nations Environment Programme and Bloomberg New Energy Finance, Global Trends in Renewable Energy Investment 2016. Available at: http://fs-unep-centre.org/publications/global-trends-renewable-ener- gy-investment-2016 2 Lydersen, K. (2012) From Dusseldorf to Duluth, the promises and pitfalls of solar. Midwest Energy News. Re- trieved 11 May 2016 from http://midwestenergynews.com/2012/09/27/from-dusseldorf-to-duluth-the-prom- ises-and-pitfalls-of-solar/ 3 GmbH, T. (2016). Renewables’ Share Expected to Rise to 33 Percent in 2015. Bdew.de. Retrieved 4 May 2016, from https://www.bdew.de/internet.nsf/id/20151103-pi-renewables-share-expected-to-rise-to-33-percent- in-2015-en 4 In 2014, the renewable surcharge was EUR 6.24 cents/kWh, or about USD 8 cents/kWh. To put this into perspective, the U.S. average retail residential electricity rate was 12.5 cents/kWh. Thus, Germany’s surcharge represents 2/3rd of the U.S. price. 5 The EU ETS is the world’s largest cap-and-trade carbon market. The EU ETS requires utilities and industry to hold allowances to cover their pollution. Allowances can be bought and sold on an open market and the allowable pollution targets decrease over time, making compliance more difficult and expensive for traditional fossil-fueled generators. For more info, see: http://ec.europa.eu/clima/policies/ets/index_en.htm 6 The LCPD is a directive that is meant to limit the amount of flue gas emissions specifically for Sulphur dioxide, nitrogen oxides, and dust. For more info, see: http://eur-lex.europa.eu/legal-content/EN/TXT/?uri=URISERV percent3Al28028 7 EU Shutters Most Coal, Natural Gas Power in Six Years. (2015). Bloomberg.com. Retrieved 3 May 2016, from http://www.bloomberg.com/news/articles/2015-02-11/eu-shutters-most-coal-natural-gas-power-in-six-years 8 Energy-intensive industry includes oil refineries, steel works and production of iron, aluminum, metals, cement, lime, glass, ceramics, pulp, paper, cardboard, acids and bulk organic chemicals. 9 The 31 countries include all of the EU 28 countries plus Iceland, Liechtenstein and Norway. 10 The EU Emissions Trading System (EU ETS) Fact Sheet. http://ec.europa.eu/clima/publications/docs/fact- sheet_ets_en.pdf 11 European Union: An Emissions Trading Case Study. IETA. Available at: http://www.ieta.org/resources/Re- sources/Case_Studies_Worlds_Carbon_Markets/euets_case_study_may2015.pdf 12 Based on an average historical emission rate from of 1.18 tonnes per MWh in the EU (excludes non-EU coun- tries included under the EU ETS). $6.92/MWh = 1.18 tonne of CO2/MWh x $5.88/ tonne of CO2. 13 Average wholesale electricity prices in the EU were at about €40/MWh. See https://ec.europa.eu/energy/ sites/ener/files/documents/EnergyDailyPricesReport-EUROPA_0.pdf 14 Hardball, E. (2015). Gov. Cuomo aims to link U.S. Northeast’s carbon market with Calif.’s. ClimateWire. Re- trieved 11 May 2016; http://www.eenews.net/stories/1060026140 15 OECD (2015), Taxing Energy Use 2015: OECD and Selected Partner Economies, OECD Publishing, Paris. 16 http://dx.doi.org/10.1787/9789264232334-en 17 Ibid. 18 OECD (2015), Taxing Energy Use 2015: OECD and Selected Partner Economies, OECD Publishing, Paris. 19 http://dx.doi.org/10.1787/9789264232334-en
  • 18. 10
  • 20. 12 Energy prices in the EU on a per unit basis have historically been much higher than prices for the same energy products used in the United States. In this section, we show how the price differentials for electricity, natural gas, and motor fuel have stacked up over time. DATA SOURCES & ENERGY PRICE DIFFERENTIALS For U.S. energy data, we rely on EIA for annual estimates of prices.1 For the EU, we rely on price data from the European Commission’s Eurostat2 and the European Environment Agency (EEA).3 We also utilize various conversion factors and the U.S. Internal Revenue Service (IRS) for historical exchange rates.4 The differences in energy pricing regimes between the United States and EU are apparent both in an industrial context, and a residential one. In 2014, these sectors accounted for approximately 64 percent of total U.S. electricity consumption and 52 percent of total U.S. natural gas consumption. Additionally, the residential sector accounted for 85 percent of the total U.S. petroleum consumption for transportation use in 2014.5 Given their consumption levels, the residential and industrial sectors serve as good indicators of how the larger U.S. economy would be impacted if EU-style policies were adopted. ELECTRICITY PRICES Figure 3 illustrates how historical residential electricity prices have compared between the U.S. and EU from 2010 to 2014. Delivered residential electricity prices in the EU during this period averaged near $240/MWh, whereas the U.S. averaged nearly $120/MWh, or less than half of EU prices. Additionally, residential electricity price growth over this time period differs significantly, with the EU rising 22 percent (or five percent annually), while prices in the U.S. increased by only eight percent (or two percent annually). A similar story can be seen in the industrial sector.6 For delivered residential natural gas prices (Figure 4), the U.S. experienced a slight decline of four percent from 2010 to 2014, driven primarily by the increase in domestic supply of natural gas from shale.7 The EU, on the other hand, saw an increase in delivered residential natural gas prices of 29 percent.8 Figure 3: U.S. and EU Residential Electricity Price Comparison, 2010-2014, (USD/MWh)
  • 21. 13 For delivered industrial natural gas, prices remained somewhat constant in the U.S. while they increased by over 26 percent in the EU from 2010 to 2014. A similar picture emerges for gasoline and diesel fuel prices. Motor fuel prices in the EU were 2.1 to 2.3 times higher than U.S. prices for gasoline and 1.8 to 1.9 times higher for diesel fuel from 2010 to 2014. By 2014, U.S. gasoline prices averaged $3.44/gallon whereas EU prices averaged $7.42/ gallon, as shown in Figure 5. Diesel fuel prices follow a similar pattern as gasoline prices, with EU prices nearly double those in the United States.9 The price differences between the U.S. and the EU are significant across all major fuel types. In general, in 2014 EU residents paid 77 to 127 percent more for energy compared to U.S. residents and EU industrial consumers paid 65 to 143 percent more than U.S. industries. As highlighted previously, EU energy and environmental policies can explain much of the price differences. Figure 4: U.S. and EU Residential Natural Gas Price Comparison, 2010-2014, (USD/mcf) Figure 5: U.S. and EU Gasoline Price Comparison, 2010-2014, (USD/gallon)
  • 22. 14 CITATIONS 1 See http://www.eia.gov/. 2 See http://ec.europa.eu/eurostat. 3 See http://www.eea.europa.eu/. 4 See https://www.irs.gov/Individuals/International-Taxpayers/Yearly-Average-Currency-Exchange-Rates. 5 See https://www.eia.gov/totalenergy/data/monthly/pdf/sec3_26.pdf. 6 EU average price for 2010-2014 in the Industrial sector is equal to $119/MWh, while U.S. prices averaged ap- proximately $69/MWh. However, from a price growth perspective, the EU remained relatively flat, whereas the U.S. experienced a 5 percent increase in price (or about 1.2 percent annually). 7 U.S. dry natural gas production increased from 21.3 Tcf in 2010 to over 25.7 Tcf in 2014, representing over a 20 percent increase from 2010 volumes. 8 Although we do not display it graphically here, we see similar patterns in gasoline and diesel fuel prices. 9 For diesel fuel, the U.S. averaged $3.83/gallon, while the EU was at $6.77/gallon in 2014.
  • 24. 16 Affordable energy prices are a major driver and facilitator of economic growth. Lower energy prices create benefits in the form of lower operating costs for businesses and higher disposable income for consumers, which when combined have the effect of increasing employment and overall economic output. While many other factors contribute to the overall health, strength, and competitiveness of a given economy, a number of studies have detailed the relationship between access to affordable energy and a growing economy. For example, a recent U.S. Council of Economic Advisers report notes that increasing production of oil and natural gas “has contributed broadly to employment and gross domestic product (GDP) growth during the recovery from the Great Recession.”1 In this section, we provide a brief overview of how specific macroeconomic indicators have differed between the U.S. and EU over time. GROSS DOMESTIC PRODUCT/ECONOMIC OUTPUT Europe’s combined gross domestic product (GDP) is roughly similar in size to that of the United States. In 2014, the EU’s GDP was $18.5 trillion compared to U.S. GDP of $17.4 trillion.2 Leading up to the recession, the gap between the EU’s GDP and United States’ GDP was much greater – exceeding $3.2 trillion in 2007. This gap has closed significantly in the intervening years, mainly due to much different rates of economic growth. From 2008 to 2014, the U.S. experienced an annual average GDP growth of 2.8 percent compared to -0.5 percent in the EU. Figure 6 shows how GDP has changed over time between the U.S. and EU. While the U.S. GDP was obviously impacted by the recession as well, it has since recovered. As shown in the figure above, U.S. GDP has been steadily catching up to the EU’s. On a per capita basis, the U.S. GDP is well ahead Figure 6: U.S. and EU GDP, 2008-2014, (USD Trillions Nominal)
  • 25. 17 of the EU. Between 2008 and 2014, U.S. GDP per capita grew 13 percent (from $48,400 to $54,600), while EU GDP per capita decreased by 0.4 percent (from $37,900 to $36,400). By 2014, the gap in GDP per capita between the U.S. and the EU was just over $18,000 (Figure 7). Ultimately, the EU has struggled to return to pre-recession economic output levels on both an absolute GDP basis and a per capita basis, as indicated by the two figures above. Part of this struggle occurred when it fell back into a recession beginning in the third quarter of 2011. EMPLOYMENT AND HOUSEHOLD INCOME Employment and household income are two other measures to gauge the health of a given economy. These additional macroeconomic indicators paint a broader picture of an economy’s overall health. For example, higher levels of employment tend to provide more income to consumers and directly affect a nation’s level of productivity. It is important, then, to understand how higher energy prices might affect these indicators. As it relates to employment, the U.S. has seen higher employment levels than the EU since the recession. From 2008 to 2014, the job market in the U.S. grew 0.7 percent annually3 (from 128.8 million to 134.0 million employees) compared to -0.3 percent annually4 (from 213.4 million to 209.5 million employees) in the EU. The EU experienced a steady decline from 2008 until 2013 and then an uptick in 2014 as shown in Figure 8. Countries like Spain and Greece have weighed heavily on the EU’s employment numbers as they have exceptionally high unemployment rates (26.7 percent and 27.8 percent, respectively) particularly with youth unemployment (55.5 percent and 57.1 percent, respectively) in 2014.5 A major driver of the higher rate of economic growth in the U.S. has been the growth of oil and gas production. This production growth has created economic benefits across the entire oil and gas value chain. Figure 7: U.S. and EU GDP per Capita, 2008-2014, (USD Nominal)
  • 26. Various studies have shown the enormous effect the “shale revolution” has had on the U.S. economy. The 2015 Economic Report of the U.S. President estimates that “the oil and natural gas sectors alone contributed more than 0.2 percentage point to real GDP growth between 2012 and 2014, in contrast to a slight negative contribution on average from 1995 to 2005.”6 Additionally, the “contribution between 2012 and 2014, which does not count all economic spillovers, added substantially to the 2.4 percent average annualized rate of U.S. economic growth over these three years.”7 Another report, which focused on 2011, estimated that the total operational and capital investment impact of the oil and natural gas industry to the U.S. economy was $1.2 trillion (or 8 percent of U.S. GDP in 2011).8 Additionally, McKinsey Global Institute released a report stating that “shale energy could revitalize the oil and gas industry, have downstream benefits for energy-intensive manufacturing, and send ripple effects across the economy.”9 The report goes on to estimate that the shale boom “could add 2 to 4 percent ($380 billion to $690 billion) to annual GDP and create up to 1.7 million permanent jobs by 2020.”10 The International Energy Agency (IEA) also chimed in, stating that “the shale gas boom will boost US manufacturing and jobs until at least 2035…reinforcing America’s economic edge over Asia and Europe for the next two decades.”11 Furthermore, the IEA“warned that Europe would need to embrace tough reforms to avoid falling behind the US over the next 20 years.”12 In July 2014, the IEA stated that “the U.S. shale- gas boom is placing 30 million jobs at risk in Europe as companies with greater reliance on energy contend with higher fuel prices than their American counterparts.”13 In addition to total jobs and the employment, disposable household income rates are helpful indicators of economic performance. Net disposable household income annual growth rates for the U.S. and the EU are shown in Figure 9. The U.S. has had somewhat consistent annual growth in disposable income, averaging 1.1 percent each year, while the EU has averaged just 0.2 percent annual growth. Figure 8: U.S. and EU Employment Rate, Ages 20-64, 2008-2014 (percent of age group population) 18
  • 27. Lower energy prices have had a clear and positive impact on economic growth in the U.S. The linkage between energy prices and economic output has been studied extensively. One study states that in the case of an oil price shock, the “effects are not trivial” and that “oil shocks have caused and/or contributed to each one of the US and global recessions in the last thirty years.”14 Other studies come to similar conclusions – energy prices do play a role in the economic prosperity of a nation.15 The EU, for its part, has been stuck in a high energy price environment since the recession due to policies and circumstances that are largely self-imposed, which in turn have slowed the pace of its recovery. Figure 9: U.S. and EU Net Household Disposable Income Annual Growth, 2008-2013 (percent) Source: OECD. Data for U.S. only available through 2013. See: https://data.oecd.org/hha/household-disposable- income.htm 19
  • 28. CITATIONS 1 2015 Economic Report of the President, Chapter 6: The Energy Revolution: Economic Benefits and the Founda- tion for a Low-Carbon Energy Future. U.S. Council of Economic Advisers. Available at: https://www.whitehouse. gov/sites/default/files/docs/2015_erp_chapter_6.pdf 2 The World Bank, http://data.worldbank.org/indicator/NY.GDP.MKTP.CD/countries/EU?display=default. 3 See BLS, http://www.bls.gov/lau/. This calculation includes all civilian labor force employment for the 20-64 age group. 4 See Eurostat, Employment by sex, age and citizenship data table. http://ec.europa.eu/eurostat/web/lfs/data/ database. 5 Unemployment rate by sex and age - monthly average, percent. (n.d.). Retrieved from http://appsso.eurostat. ec.europa.eu/ 6 Ibid. 7 Ibid. 8 PWC, Economic Impacts of the Oil and Natural Gas Industry on the US Economy in 2011. July 2013. Available at: http://www.api.org/~/media/files/policy/jobs/economic_impacts_ong_2011.pdf 9 McKinsey Global Institute, Game Changers: Five Opportunities for US Growth and Renewal, July 2013. Available at: http://www.mckinsey.com/global-themes/americas/us-game-changers 10 Ibid. 11 Shale gas boom to fuel US lead over Europe and Asia for decades. (2016). Financial Times. Retrieved 5 May 2016, from http://www.ft.com/cms/s/0/287fbf4e-4b9c-11e3-a02f-00144feabdc0.html#axzz47ojq0Vyd 12 Ibid. 13 Europe Risks Losing 30 Million Jobs to U.S. Shale Boom. (2016). Bloomberg.com. Retrieved 5 May 2016, from http://www.bloomberg.com/news/articles/2014-07-17/europe-risks-losing-30-million-jobs-to-u-s-shale-boom 14 Roubini, N. and Setser, B., The effects of the recent oil price shock on the U.S. and global economy, August 2004. Available at: http://pages.stern.nyu.edu/~nroubini/papers/OilShockRoubiniSetser.pdf 15 For example, see: Bordoff, J. and Stock, J., The Implications of Lower Oil Prices for the US Economy Amid the Shale Boom, December 2014; Centre for Climate Change Economics and Policy, Historical Energy Price Shocks and their Changing Effects on the Economy, April 2014; Congressional Budget Office, The Economic Effects of Recent Increases in Energy Prices, July 2006; and Kilian, L., The Economic Effects of Energy Price Shocks, May 2007. 20
  • 30. 22 The previous sections demonstrate how much more expensive energy products have been in EU countries in recent years relative to the United States, with additional discussion of how higher prices may have affected economic growth and contributed to the EU’s relatively slower rebound following the global recession. In this section, we seek to quantify the impact of EU-style policies on the U.S. economy – especially insofar as they have the effect of increasing U.S. delivered energy prices to EU levels. We also take a closer look at how the economies of seven U.S. states – Colorado, Florida, Illinois, Indiana, Michigan, Ohio and Wisconsin – might fare if their businesses and consumers were forced to operate under an EU energy-pricing regime. ANALYTICAL METHODOLOGY The analysis presented here shows the potential impacts in a single year – 2014 – if the U.S. were to be forced to operate under EU-level energy prices.1 To model the overall macroeconomic impact of these higher prices, we started by calculating the percentage differences between energy prices in the U.S. and EU. For data, we relied on the following: • EIA for annual estimates of U.S. prices.2 • European Commission’s Eurostat3 and the European Environment Agency (EEA) for EU price data.4 • US Census Annual Survey of Manufacturers (ASM)5 and the EIA’s Manufacturing Energy Consumption Survey (MECS)6 for Industrial energy expenditures and fuel consumption shares. • U.S. IRS for historical exchange rates.7 • Bureau of Labor Statistics (BLS) Consumer Expenditure Survey for historical U.S. consumer expenditures.8 Table 3 illustrates how retail energy prices differ between the U.S. and EU for the residential and industrial sectors for 2014. Energy prices were nearly double per unit of consumption in the EU across the board. For example, the U.S. average price for retail electricity in 2014 was $125.20/ MWh, whereas the EU’s price was $259.31/ MWh, or 207 percent of the U.S. price. The percent-difference values we calculate in the table above represent the starting point for our total economic impact analysis. Table 3: Retail Energy Price Differential Impacts, 2014 US Price (USD/unit) EU Price (USD/unit) % Difference Residential Electricity (MWh) $125.20 $259.31 107% Natural Gas (mcf) $10.97 $24.94 127% Motor Fuels (gallons) Gasoline $3.44 $7.42 116% Diesel $3.83 $6.77 77% Wtd. Gas & Diesel 107% Industrial Electricity (MWh) $71.00 $116.96 65% Natural Gas (mcf) $5.55 $13.50 143%
  • 31. 23 ECONOMIC IMPACT MODELING & ASSUMPTIONS To conduct this analysis, the IMPLAN model was used to estimate the overall macroeconomic effects of higher energy prices. IMPLAN is a general input-output modeling software and data system that tracks the movement of money and resources through an economy, looking at linkages between industries along the supply chain to measure the cumulative effect of spending in terms of job creation, income, production, and taxes. As such, IMPLAN helps us understand and quantify the so-called economic “ripple” (or multiplier) effect that tracks how each dollar of input, or direct spending, cycles through the economy to suppliers and ultimately to households. To model the overall macroeconomic impact of higher energy prices, we start with the percentage differences calculated in Table 3 above. We assume that the additional energy costs come in the form of lost consumer income for the residential sector9 and lost margin for the industrial sector. Additionally, we assume that under the higher- price scenario, consumption stays constant. Implicitly, we are assuming that Americans would want to maintain the same standard of living (to the extent possible) under higher energy prices. Of course, demand isn’t completely inelastic, but several studies have shown that short-term demand is highly inelastic under price increases. For example, one study found that “demand is relatively inelastic to price [and that] in the past 20 years, this relationship has not changed significantly.”10 Another study notes that “electricity price elasticities in general are expected to be fairly inelastic due to limited substitution possibilities for electricity.”11 For our residential consumer impact analysis, we rely on the BLS Consumer Expenditure Survey for the annual average consumer expenditures on energy, broken down by income level. Because we assume that consumption at every income level stays constant under a price change, we increase the average energy expenditure for electricity, natural gas, and motor fuel for each income level by the price differentials calculated in Table 3. These calculations are displayed in Table 4. Table 4: Average Residential Electricity, Natural Gas, and Motor Fuel Expenditure by Income Level (2014, $Billions) Income Bracket 2014 Actual Expediture Increased Price Scenario Difference Less than $10k $25.5 $53.3 -$27.8 $10k to $15k $20.1 $42.1 -$22.0 $15k to 25k $48.8 $102.0 -$53.3 $25 to $35k $76.2 $159.4 $55.8 $35k to $50k $73.3 $153.4 -$80.1 $50k to $75k $102.4 $214.2 $111.8 $75k to $100k $71.7 $150.1 -$78.4 $100k to $150k $88.9 $180.1 $97.2 $150k and more $76.0 $159.4 $83.4 Total $582.8 $1,219.9 $609.7
  • 32. 24 Table 5: Average Industrial Electricity and Natural Gas Expenditure, Top 25 (2014, $Billions) Industry NAICS 2014 Energy Spending (Billion $) Increased Price Scenario (Billion $) Difference 1 Petroleum refineries 32411 $10.2 $20.3 $10.1 2 Other Basic Organic Chemical Manufacturing 32519 6.1 8.9 2.8 3 Iron and steel mills and ferroalloy manufacturing 3311 5.6 8.5 2.9 4 Paper Mills 32212 3.3 5.4 2.1 5 Plastics material and resin manufacturing 325211 3.2 4.5 1.3 6 Paperboard Mills 32213 2.6 4.3 1.7 7 Petrochemical Manufacturing 32511 2.5 4.2 1.6 8 Motor Vehicle Parts Manufacturing 3363 2.1 3..6 1.5 9 Other plastics product manufacturing 32619 1.9 3.2 1.3 10 Semiconductor and related device manufacturing 334413 1.6 2.7 1.1 11 Industrial gas manufacturing 32512 1.5 2.9 1.3 12 Cement manufacturing 32731 1.5 2.0 0.6 13 Printing 32311 1.3 2.3 1.0 14 Alumine refining and primary aluminum production 331313 1.1 1.9 0.8 15 Lime and gypsum product manufacturing 3274 0.9 1.6 0.7 16 Plastics packaging materials and unlaminated film and sheet manufacturing 32611 0.9 1.5 0.6 17 Ferrous metal foundries 33151 0.9 1.4 0.5 18 Paperboard container manufacturing 32221 0.9 1.4 0.6 19 Poultry processing 311615 0.8 1.5 0.6 20 Wet corn milling 311221 0.8 1.3 0.5 21 Sawmills and wood preservation 3211 0.7 1.2 0.4 22 Pharmaceuticals preparation manufacturing 325412 0.7 1.2 0.5 23 Fertilizer manufacturing 32531 0.7 1.4 0.7 24 Fruit and vegetables canning, pickling, and drying 31142 0.7 1.3 0.7 25 Other general purpose machinery manufacturing 3339 0.7 1.1 0.5 Total $53.0 $89.5 $36.5
  • 33. 25 Overall, residential energy expenditures more than double from $583 billion to $1,220 billion under the EU price scenario. This $610 billion increase in costs would directly reduce the amount of money each household has available to spend on goods and services. This indirect impact on the economy is modeled in IMPLAN. For our industrial impact analysis, we ranked the top 25 industries based on total electricity and fuel consumption using the US Census’s Annual Survey of Manufacturers (ASM). We also used EIA’s Manufacturing Energy Consumption Survey (MECS) data to calculate the percentage of fuel that was spent on natural gas. As with our Residential analysis, we assume that energy consumption stays constant while prices change. As Table 5 shows, the total cost impact to these industries is $36.5 billion. RESULTS We first ran IMPLAN to calculate the macroeconomic impacts of lower residential household incomes caused by higher energy prices. We reduced the household income level for each income bracket as outlined above in Table 4. IMPLAN calculated the indirect and induced economic impacts, which resulted in $644 billion in lost GDP opportunities; more than $364 billion in lost labor income; and nearly 7.4 million jobs lost as well, as shown in Table 6. Our modeling indicates that higher energy prices (assuming consumption remains constant) lowers overall economic output, reduces labor income, and creates a significant loss in employment. These impacts are felt across a number of industrial sectors. In Figure 10, we show the top 10 most impacted North American Industry Classification System (NAICS) sectors and the lost GDP opportunity each sector would have experienced under the higher energy price scenario in the residential sector. For example, the Health Care and Social Assistance sector would have lost approximately $82 billion, while the Real Estate and Rental and Leasing sector would have lost $62 billion. For the industrial sector, we found that the overall impact of higher energy prices equates to $31.2 billion in lost GDP. This economic hit also equates to over $16 billion in lost labor income and just over 273,000 jobs, as shown in Table 7. We note that these figures are somewhat conservative given that the impact modeled was only on the top 25 industrial sectors. Furthermore, because we assume for the purposes of this study that an increase in price does not retard consumption, we zero-out any induced and indirect losses associated with Table 6: Aggregate Residential Economic Impacts due to Increased Energy Prices, 2014 Economic Impact Aggregate Economic Lost Opportunity GDP $644.3 billion Labor Income $364.1 billion Annual Employment 7.4 million jobs Economic Impact Aggregate Economic Lost Opportunity GDP $31.2 billion Labor Income $16.7 billion Annual Employment 273,100 jobs Table 7: Aggregate Industrial Economic Impacts due to Increased Energy Prices, 2014
  • 34. 26 Figure 10: GDP Impacts of the Top 10 NAICS Industry Sectors from Residential Price Increases, 2014, ($ Billions) Figure 11: GDP Impacts of the Top 10 NAICS Industry Sectors resulting from an Energy Price Increase to Energy-Intensive Industries, 2014, ($ Billions) $82 $62 $58 $57$48 $36 $35 $33 $29 $67 Health Care and Social Assistance Real Estate and Rental and Leasing Finance and Insurance Manufacturing Retail Trade Wholesale Trade Information Professional, Scientific, and Technical Services Accommodation and Food Services No NAICS Code Designation* All other Sectors Total GDP Impact: $139 billion *Includes IMPLAN sectors for which there is no matching NAICS code. The majority of these impacts are in Owner-occupied Dwellings ($62 billion) and Other Local Government Enterprises ($4 billion). $13.1 $2.5 $1.6 $1.5 $1.5 $1.4 $1.3 $1.1 $1.0 $1.3 Manufacturing Wholesale Trade Finance and Insurance Real Estate and Rental and Leasing Professional, Scientific, and Technical Services Transportation and Warehousing Health Care and Social Assistance Retail Trade Management of Companies and Enterprises No NAICS Code Designation* All other Sectors Total GDP Impact: $5.0 billion *Includes IMPLAN sectors for which there is no matching NAICS code. The majority of these impacts are in Owner-occupied Dwellings ($1.1 billion) and Other Local Government Enterprises ($0.2 billion). $82 $62 $58 $57$48 $36 $35 $33 $29 $67 Health Care and Social Assistance Real Estate and Rental and Leasing Finance and Insurance Manufacturing Retail Trade Wholesale Trade Information Professional, Scientific, and Technical Services Accommodation and Food Services No NAICS Code Designation* All other Sectors Total GDP Impact: $139 billion *Includes IMPLAN sectors for which there is no matching NAICS code. The majority of these impacts are in Owner-occupied Dwellings ($62 billion) and Other Local Government Enterprises ($4 billion). $13.1 $2.5 $1.6 $1.5 $1.5 $1.4 $1.3 $1.1 $1.0 $1.3 Manufacturing Wholesale Trade Finance and Insurance Real Estate and Rental and Leasing Professional, Scientific, and Technical Services Transportation and Warehousing Health Care and Social Assistance Retail Trade Management of Companies and Enterprises No NAICS Code Designation* All other Sectors Total GDP Impact: $5.0 billion *Includes IMPLAN sectors for which there is no matching NAICS code. The majority of these impacts are in Owner-occupied Dwellings ($1.1 billion) and Other Local Government Enterprises ($0.2 billion).
  • 35. 27 the oil, natural gas, and electric generation industries. For example, the model outputs show that higher energy costs in the industrial sector translate to a reduction of purchases from the natural gas distribution sector. However, under the assumption that consumption does not change, these indirect and induced effects do not, in our study, occur. We adjust the outputs to reflect this. As with the residential sector, the impacts of higher prices on U.S. industries would be felt across a number of sectors. In the figure below, we show the top 10 most impacted NAICS sectors and the lost GDP opportunity each sector would experience under the higher energy price scenario. Not surprisingly, several well-known energy- intensive industries are represented on the list of the most impacted sectors below (mostly those in the manufacturing sector). We calculate that the manufacturing sector would stand to lose approximately $13.1 billion on an annual basis if forced to operate under an EU- level energy pricing regime.
  • 36. 28 CITATIONS 1 2014 is the year in which the most recent and complete data is available for all energy consumption and prices. 2 See http://www.eia.gov/. Data tables used include: “Average price (cents/kilowatt hour by State by Provider, 1990-2014”, Natural gas average residential price delivered to residential consumers, Natural gas average industrial price , Retail gasoline prices all grades all formulations, Retail No 2 Diesel prices. 3 See http://ec.europa.eu/eurostat. Note that for the EU, we use the EU 28 countries in our analysis. Tables used include: “Electricity prices by type of user” and “Natural gas prices by type of user.” User types pulled are “Medium size households” and “Medium size industries.” 4 See http://www.eea.europa.eu/data-and-maps/daviz/nominal-and-real-fuel-prices-2#tab-chart_1. 5 http://factfinder.census.gov/bkmk/table/1.0/en/ASM/2014/31GS101 6 https://www.eia.gov/consumption/manufacturing/ 7 See https://www.irs.gov/Individuals/International-Taxpayers/Yearly-Average-Currency-Exchange-Rates. 8 See tables for 2014 “Income Before Taxes” and “Higher Income Before Taxes” at: http://www.bls.gov/cex/csx- combined.htm. 9 The modeling approach assumes that all increased costs associated with higher prices are passed along to the final consumer. That is, the final consumer bears all additional costs, and no costs are absorbed within the electricity, natural gas, and refined fuels value chains. This is a reasonable assumption in that we see final con- sumers in countries like Germany paying for the increases in taxes, fees, and wholesale fuel costs. In the U.S., energy service providers typically have “pass-through” clauses that allows them to pass through the wholesale fuel costs to the final consumer. 10 Bernstein, M. and Griffin, J., Regional Differences in the Price-Elasticity of Demand for Energy, February 2006. 11 Madlener, R. et al., Econometric Estimation of Energy Demand Elasticities, Volume 3, Issue, E.ON Energy Re- search Center Series.
  • 38. 30 The vast majority of the electricity produced in Colorado (more than 80 percent)1 is derived from coal and natural gas. These lower-than- average generation costs translate into lower- than-average power costs for consumers and businesses in the state, which in turn have contributed to better-than-average economic performance in recent years. In 2014, Colorado generated $306 billion in GDP2 , had nearly 2.7 million people active in the workforce and had an unemployment rate of 5.0 percent, which is well below the national average of 6.2 percent.3 All told, our analysis indicates that Colorado would see a $6.8 billion drop in its state annual economic output figure under a scenario in which Colorado residents and businesses were forced to live under an EU energy price regime. More than 84,000 jobs that would otherwise exist under the energy price regime currently in place in the state would be lost. And all those lost jobs would deprive Colorado families of nearly $4 billion in annual wages, even while forcing those same families (and all the rest as well) to pay nearly $4,730 more for their energy per year than what they already pay. Table 8 summarizes these impacts. In addition to the impacts described above, we examined the level of potential economic value at risk for the top 25 energy-intensive industries in Colorado. Based on our models, we find that more than 115,000 Colorado jobs would be at risk of leaving the state or being discontinued under an EU energy pricing system, taking with them nearly $12 billion in annual state GDP. One specific example of an industry sector in Colorado that could be placed at risk if energy prices were to rise dramatically is the state’s brewing industry, which directly contribute $1.4 billion in annual state GDP (as of 2014). Rather than continue production in Colorado, brewers could move operations to a region with lower energy costs. Colorado Economic Impact Higher Residential Energy Prices Higher Industrial Energy Prices Total Impact Lost State GDP $6.7 billion $125 million $6.8 billion Lost Labor Income $3.8 billion $74 million $3.9 billion Lost Annual Employment 82,900 jobs 1,300 jobs 84,200 jobs Annual Energy Cost Increase $4,730 per household Table 8: Impacts of EU Energy Prices on Colorado Economy (2014) Table 9: Colorado’s Industrial Value at Risk Under EU Price Regime (2014) Economic Impact Industrial Value at Risk (Direct Impact) Industrial Value at Risk (Additional Impact) Industrial Value at Risk (Economy-Wide Impact) State GDP $4.7 billion $7.1 billion $11.7 billion Labor Income $2.5 billion $4.3 billion $6.8 billion Annual Employment 40,600 jobs 75,100 jobs 115,700 jobs
  • 39. 31 In Illinois, an even greater percentage of the state’s electricity (more than 80 percent)4 comes from low-cost sources such as coal and natural gas than in Colorado. In large part because of that, Illinois consumers pay less for their electricity than the average U.S. ratepayer (roughly 1.2 cents less per kilowatt-hour).5 In 2014, Illinois generated $742 billion in GDP,6 had nearly 6.1 million people in the workforce and had an unemployment rate of 7.1 percent.7 Because Illinois is a bigger state than Colorado, with much more significant industrial activity and greater demand for energy, the impacts that Illinois’s economy would be forced to endure as a consequence of imposing EU-inspired energy pricing are much larger than those we witnessed in Colorado. For instance, our analysis indicates that imposing EU-level energy prices on Illinois would cost the state $17.4 billion in lost state GDP and nearly $10 billion in lost labor income. All told, we find that more than 200,000 jobs would be lost directly as a result of higher residential and industrial electricity costs. And the per-household cost for Illinois consumers in the form of higher energy bills would amount to more than $5,200 per year. These impacts are summarized in Table 10. As we did with the other states, we also examined what the potential economic value at risk is for the top 25 energy-intensive industries in Illinois – industries that would be placed at immediate risk of idling, shuttering or moving if they were forced to pay EU-level prices for their energy inputs. Under such a scenario, we find that nearly 500,000 jobs in Illinois that exist today would be placed at risk of being lost; nearly $50 billion in state GDP would be at risk; and more than $30 billion in annual labor income would be placed in a similarly precarious position. Economic Impact Higher Residential Energy Prices Higher Industrial Energy Prices Total Impact Lost State GDP $16.6 billion $789 million $17.4 billion Lost Labor Income $9.4 billion $492 million $9.9 billion Lost Annual Employment 193,600 jobs 7,600 jobs 201,200 jobs Annual Energy Cost Increase $5,230 per household Table 10: Impacts of EU Energy Prices on Illinois Economy (2014) Economic Impact Industrial Value at Risk (Direct Impact) Industrial Value at Risk (Additional Impact) Industrial Value at Risk (Economy-Wide Impact) State GDP $19.0 billion $30.0 billion $48.9 billion Labor Income $12.5 billion $18.1 billion $30.6 billion Annual Employment 173,700 jobs 319,200 jobs 492,900 jobs Table 11: Illinois’s Industrial Value at Risk Under EU Price Regime (2014) Illinois
  • 40. 32 In Indiana, most of the power produced (over 95 percent)8 comes from low-cost sources such as coal and natural gas; little wonder, then, that Indiana consumers pay less for their electricity than all but 10 states in the country.9 In 2014, Indiana generated $324 billion in GDP10 , had nearly three million people in the workforce and had an unemployment rate of 6.0 percent, which is just below the national average of 6.2 percent.11 If residents of the Hoosier State were to wake up tomorrow and find themselves forced to pay EU- inspired prices for their energy, the consequences would be severe. For starters, our analysis finds that more than 104,000 jobs would be wiped out, with the vast majority of those being discontinued as a result of higher residential sector energy costs. Those lost jobs would have the effect of eliminating more than $4.3 billion in annual labor income, contributing in part to the loss of $7.8 billion in annual state GDP. These impacts, which also include an extra $5,450 that Indiana households will need to pay each year in higher energy costs, are captured in Table 12. We also examined the potential economic value at risk for the top 25 energy-intensive industries in Indiana, as we did for other states. Our analysis finds that nearly 430,000 jobs would be placed at risk for elimination or departure across the entire spectrum of the state’s economy under a scenario in which Indiana was forced to pay EU prices for its energy. Those lost jobs translate into more than $26 billion in lost labor income, and a more than $60 billion hit to the state’s annual economic output. One sector worth noting in Indiana is the pharmaceutical manufacturing industry, which contributes $18.7 billion in direct GDP to the state. If energy prices were to rise to European levels, this sector could be at risk. Because of the ripple effect, the total economic value at risk increases up to $23.4 billion.  Table 13 shows the economic value at risk for all of Indiana’s top 25 energy- intensive industry sectors. Indiana Economic Impact Higher Residential Energy Prices Higher Industrial Energy Prices Total Impact Lost State GDP $6.9 billion $879 million $7.8 billion Lost Labor Income $3.8 billion $491 million $4.3 billion Lost Annual Employment 95,800 jobs 8,300 jobs 104,100 jobs Annual Energy Cost Increase $5,450 per household Table 12: Impacts of EU Energy Prices on Indiana Economy (2014) Table 13: Indiana’s Industrial Value at Risk Under EU Price Regime (2014) Economic Impact Industrial Value at Risk (Direct Impact) Industrial Value at Risk (Additional Impact) Industrial Value at Risk (Economy-Wide Impact) State GDP $36.3 billion $23.9 billion $60.3 billion Labor Income $12.0 billion $14.2 billion $26.2 billion Annual Employment 134,600 jobs 292,600 jobs 427,200 jobs
  • 41. 33 In Michigan, over 90 percent of the power produced12 comes from low-cost sources such as coal and natural gas. In 2014, Michigan generated $447 billion in GDP13 , had nearly 4.4 million people in the workforce and had an unemployment rate of 7.3 percent, which is above the national average of 6.2 percent.14 All told, our analysis indicates that Michigan would see a nearly $12 billion drop in its state annual economic output under a scenario in which its residents and businesses were forced to live under an EU energy price regime. Nearly 160,000 jobs that would otherwise exist at current price levels in the state would be lost. And all those lost jobs would deprive Michigan families of nearly $7 billion in annual wages, making it even more difficult for each Michigan household to pay the extra $5,310 per year to cover higher energy bills. These impacts are summarized in Table 14. As it relates to the potential economic value at risk is for the top 25 energy-intensive industries in Michigan, the Energy Institute’s analysis finds that more than 520,000 jobs held by Michigan residents today would be at risk of being moved or eliminated under a higher-cost EU energy price regime. Our modeling found that more than $52 billion in state GDP would similarly be placed at risk, along with more than $31 billion in labor income – wages that would be at risk of moving to other lower-cost regions, or disappearing entirely. One segment of Michigan’s economy worth highlighting is its automotive vehicle and parts manufacturing industries, which contributes $7.7 billion in direct GDP to the state. If energy prices were to rise to European levels, this sector could be at risk (i.e., the industry may stop or move production elsewhere). Because of the ripple effect, the total economic value at risk increases up to $17.5 billion.  Table 15 shows the economic value at risk for Michigan’s top 25 energy- intensive industry sectors. Michigan Economic Impact Higher Residential Energy Prices Higher Industrial Energy Prices Total Impact Lost State GDP $11.0 billion $893 million $11.9 billion Lost Labor Income $6.3 billion $542 million $6.8 billion Lost Annual Employment 150,600 jobs 9,000 jobs 159,600 jobs Annual Energy Cost Increase $5,310 per household Table 14: Impacts of EU Energy Prices on Michigan Economy (2014) Table 15: Michigan’s Industrial Value at Risk Under EU Price Regime (2014) Economic Impact Industrial Value at Risk (Direct Impact) Industrial Value at Risk (Additional Impact) Industrial Value at Risk (Economy-Wide Impact) State GDP $22.4 billion $29.8 billion $52.2 billion Labor Income $12.9 billion $18.7 billion $31.5 billion Annual Employment 175,600 jobs 345,400 jobs 521,000 jobs
  • 42. 34 In Florida, most of the power produced (over 95 percent)15 comes from low-cost sources such as coal and natural gas. In 2014, Florida generated $836 billion in GDP16 , had more than nine million people in the workforce and had an unemployment rate of 6.3 percent, which right near the national average of 6.2 percent.17 When we ran the numbers for Florida, we found that more than 377,000 jobs that presently exist in the Sunshine State would be lost if EU energy prices were imposed on its economy. Nearly $30 billion in annual state economic output would also be lost, and workers in the state would collect about $16 billion less in wages than they might have otherwise done. Especially concerning given the state’s high percentage of fixed-income residents, the average Florida household would be forced to pay nearly $5,000 more per year for their energy than what it currently pays. These impacts are summarized in Table 16. Similar to the negative impacts that would befall the Florida economy as a direct result of being forced to pay higher, EU-style residential and consumer energy prices, the potential economic value at risk for the top 25 energy-intensive industries in Florida is similarly enormous. For example, our analysis found that nearly 340,000 Florida jobs would be put at risk under this scenario, potentially resulting in the loss of more than $18 billion in wages, and costing the economy more than $31 billion in state GDP. One sector worth highlighting is Florida’s semiconductor manufacturing industry, which contributes $1.7 billion in direct GDP to the state. If energy prices were to rise to European levels, this sector could be at risk for closure. Accounting for the ripple effect, the total economic value at risk increases to $4.2 billion. Table 17 summarizes these impacts. Florida Economic Impact Higher Residential Energy Prices Higher Industrial Energy Prices Total Impact Lost State GDP $28.0 billion $455 million $28.5 billion Lost Labor Income $15.6 billion $272 million $15.9 billion Lost Annual Employment 372,400 jobs 5,000 jobs 377,400 jobs Annual Energy Cost Increase $4,980 per household Table 16: Impacts of EU Energy Prices on Florida Economy (2014) Table 17: Florida’s Industrial Value at Risk Under EU Price Regime (2014) Economic Impact Industrial Value at Risk (Direct Impact) Industrial Value at Risk (Additional Impact) Industrial Value at Risk (Economy-Wide Impact) State GDP $11.8 billion $19.9 billion $31.7 billion Labor Income $6.4 billion $11.8 billion $18.2 billion Annual Employment 105,100 jobs 233,700 jobs 338,800 jobs
  • 43. 35 Almost all of the power produced in Ohio (96 percent)18 comes from conventional and low- cost sources – coal, natural gas, and nuclear. Ohio is also a major manufacturing state – the manufacturing sector alone represents 17 percent of Ohio’s GDP, generates more than 660,000 jobs, and chips in $36 billion in labor income.19 Ohio generated $576 billion in GDP in 201420 , had nearly 5.4 million people employed, and had an unemployment rate of 5.7 percent, below the national average of 6.2 percent.21 Ohio’s economy is on track to continue its growth, with significant growth coming from oil and natural gas development, including from unconventional sources.22 Under European-style energy policies that make fossil fuels more expensive and/ or harder to produce, Ohio households and businesses would suffer major economic impacts. Those impacts start with jobs: under this new pricing regime, Ohio would lose more than 187,000 jobs, and $8.2 billion in wages being paid out to Ohio workers today would also be eliminated. All told, the state’s annual economic output would decline by a staggering $14.8 billion. Our analysis of energy price increase impacts to Ohio (including the extra $5,000 that Ohio households would have to pay for their energy, over and above what they already pay today) is represented in Table 18. As with the other states we analyzed, we examined what the potential economic value at risk would be for the top 25 energy-intensive industries in Ohio. Similar in many ways to the industrial profile on display in Michigan, Ohio’s economy would stand to lose more than 512,000 jobs if EU energy prices became the norm there. Those lost jobs put nearly $30 billion in wages at risk, and have the potential to deprive Ohioans of more than $57 billion in annual state GDP. One segment worth noting in Ohio is its iron and steel manufacturing sector, which contributes $2.2 billion in direct GDP to the state. If energy prices were to rise to European levels, this sector could be at risk (i.e., the industry may stop or move production elsewhere). Because of the ripple effect, the total economic value at risk increases to $5.8 billion. Table 19 shows the economic value at risk for Ohio’s top 25 energy-intensive industry sectors. Ohio Economic Impact Higher Residential Energy Prices Higher Industrial Energy Prices Total Impact Lost State GDP $13.3 billion $1.5 billion $14.8 billion Lost Labor Income $7.4 billion $807 million $8.2 billion Lost Annual Employment 173,700 jobs 13,500 jobs 187,200 jobs Annual Energy Cost Increase $5,000 per household Table 18: Impacts of EU Energy Prices on Ohio Economy (2014) Table 19: Ohio’s Industrial Value at Risk Under EU Price Regime (2014) Economic Impact Industrial Value at Risk (Direct Impact) Industrial Value at Risk (Additional Impact) Industrial Value at Risk (Economy-Wide Impact) State GDP $27.7 billion $29.5 billion $57.2 billion Labor Income $12.1 billion $17.8 billion $29.9 billion Annual Employment 169,400 jobs 343,400 jobs 512,800 jobs
  • 44. 36 Wisconsin’s economy as recovered more quickly than that of other states coming out of the recession of 2009. In 2014, the state generated $290 billion in GDP23 , had more than 2.9 million people employed, and had an unemployment rate of 5.5 percent, below the national average of 6.2 percent.24 A large part of Wisconsin’s economic success is related to its lower energy costs. Nearly 90 percent25 of the electric power in Wisconsin comes from conventional and low-cost sources – coal, natural gas, and nuclear. The state’s manufacturing sector is a large consumer of electricity, and the sector represented nearly 19 percent of the state’s GDP in 2014 and accounted for more than 16 percent of the state’s workforce in 2015. Average annual compensation in Wisconsin’s manufacturing sector was more than $67,000 per employee in 2015.26 Wisconsin’s economic outlook in more recent years, however, has slightly dimmed. Ranked as 38th in job creation, the state has been lagging other states.27 Wisconsin’s economy could be under even greater pressure if European-style energy policies were to be imposed there. Our analysis finds that more than 81,000 jobs would be lost under such a scenario, along with $3.5 billion in lost annual wages and a hit to the state GDP approaching $6.3 billion per year. Critically, Wisconsin households would have to pay $4,720 more per year for their energy than they already do. Table 20 summarizes these impacts. As with the other states, we examined what the potential economic value at risk is for the top 25 energy-intensive industries in Wisconsin. Here again, our models point to hundreds of thousands of jobs being placed at risk if EU energy prices were to be imposed on the broader economy. We found that nearly 450,000 jobs that currently exist today would be put at risk for elimination; $25 billion in labor income each year could potentially be lost; and greater than $40 billion in annual state GDP could potentially be wiped out. In Wisconsin, the state’s cheese manufacturing sub-sector is a key sector worth noting, as it contributes over $1.5 billion in direct GDP and nearly $9.7 billion in GDP to the state via its economic ripple effect. In fact, the cheese manufacturing sub-sector represents approximately one-quarter of the GDP value at risk of Wisconsin’s top 25 energy-intensive industry sectors (Table 21). Wisconsin Economic Impact Higher Residential Energy Prices Higher Industrial Energy Prices Total Impact Lost State GDP $5.5 billion $805 million $6.3 billion Lost Labor Income $3.0 billion $496 million $3.5 billion Lost Annual Employment 72,900 jobs 8,600 jobs 81,500 jobs Annual Energy Cost Increase $4,720 per household Table 20: Impacts of EU Energy Prices on Wisconsin Economy (2014)
  • 45. 37 Table 21: Wisconsin’s Industrial Value at Risk Under EU Price Regime (2014) Economic Impact Industrial Value at Risk (Direct Impact) Industrial Value at Risk (Additional Impact) Industrial Value at Risk (Economy-Wide Impact) Cheese Manufacturing Share of the Top 25 State GDP $15.8 billion $24.9 billion $40.6 billion 24 percent Labor Income $10.4 billion $14.6 billion $25.1 billion 21 percent Annual Employment 161,400 286,500 jobs 447,800 jobs 21 percent
  • 46. 38 CITATIONS 1 EIA-923 Report. 2 BEA, GDP by State. Available at: http://www.bea.gov/regional/ 3 BLS. http://www.bls.gov/news.release/archives/srgune_03042015.pdf 4 EIA-923 Report. 5 Nebraska state energy office, data from 2015. Comparison chart available here: http://www.neo.ne.gov/stat- shtml/204.htm 6 BEA, GDP by State. Available at: http://www.bea.gov/regional/ 7 BLS. http://www.bls.gov/news.release/archives/srgune_03042015.pdf 8 EIA-923 Report. 9 Nebraska state energy office, data from 2015. Comparison chart available here: http://www.neo.ne.gov/stat- shtml/204.htm 10 BEA, GDP by State. Available at: http://www.bea.gov/regional/ 11 BLS. http://www.bls.gov/news.release/archives/srgune_03042015.pdf 12 EIA-923 Report. 13 BEA, GDP by State. Available at: http://www.bea.gov/regional/ 14 BLS. http://www.bls.gov/news.release/archives/srgune_03042015.pdf 15 EIA-923 Report. 16 BEA, GDP by State. Available at: http://www.bea.gov/regional/ 17 BLS. http://www.bls.gov/news.release/archives/srgune_03042015.pdf 18 EIA-923 Report. 19 The Ohio Manufacturers’Association, 2014 Manufacturing Counts. Available at: http://www.ohiomfg.com/ ManufacturingCounts2014.pdf 20 BEA, GDP by State. Available at: http://www.bea.gov/regional/ 21 BLS. http://www.bls.gov/news.release/archives/srgune_03042015.pdf 22 EIA, Marcellus, Utica Provide 85% of U.S. Shale Gas Production Growth Since Start of 2012. Available at: http://www.eia.gov/todayinenergy/detail.cfm?id=22252 23 BEA, GDP by State. Available at: http://www.bea.gov/regional/ 24 BLS. http://www.bls.gov/news.release/archives/srgune_03042015.pdf 25 EIA-923 Report. 26 National Association of Manufacturers, Wisconsin Manufacturing Facts, available at: http://www.nam. org/Data-and-Reports/State-Manufacturing-Data/State-Manufacturing-Data/March-2016/Manufactur- ing-Facts--Wisconsin/ 27 Wisconsin job creation rank falls to 38th in U.S.. (2016). Jsonline.com. Retrieved 19 May 2016, from http:// www.jsonline.com/business/wisconsin-job-creation-rank-falls-to-38th-in-us-b99464770z1-296876421.html
  • 48. 40 This technical appendix describes the economic impact modeling data, assumptions, and methodology for both our Residential and Industrial sector analysis. Gasoline prices on the cover were calculated by comparing the U.S. average price for regular unleaded gasoline on 9-28-16 ($2.21 per gallon) with an average of price for Super 95 unleaded gasoline in each of the 28 European Union countries in mid-September (1.24 €/liter = $5.24/gallon). Assumes a 20-gallon gas tank. RESIDENTIAL MODELING ASSUMPTIONS & DATA To model the overall macroeconomic impact of higher energy prices, we use annual data for the year 2014. We model 2014 because it is the year in which all data is available. We rely on the following data for the analysis: • US Energy Prices — Energy Information Administration (EIA).1 Data tables include: • Average Electricity Price by State by Provider2 — We use “Residential” and “Industrial” (for industrial analysis) columns under the “Total Electric Industry” Industry Sector Category for prices. • Natural gas price delivered to residential consumers3 • Natural gas industrial price4 (for industrial analysis) • All grades all formulations retail gasoline prices5 • No 2 Diesel prices6 • European Energy Prices • European Commission’s Eurostat.7 We use data for the EU 28 countries throughout the analysis because it is the most consistent aggregate. Data tables include: • Electricity prices by type of user8 - the data is broken down by “Medium size household” and “Medium size industrial” (for industrial analysis) • Natural gas prices by type er9 - the data is broken down by “Medium size household” and “Medium size industrial” (for industrial analysis) • European Environment Agency (EEA).10 • This data provides motor fuel prices. We use the “All petrol, unleaded equivalent (nominal)” column for gasoline prices. We use the “Diesel (nominal)” column for diesel prices. • Historical Exchange Rates: U.S. Internal Revenue Service (IRS).11 • US Residential Energy Spending: Bureau of Labor Statistics (BLS) Consumer Expenditure Survey for year 2014.12 Data tables include:
  • 49. 41 • “Income before taxes”13 and “Higher income before taxes”.14 From these two data sets, we rely on the following: • Average (mean) natural gas expenditures by income level • Average (mean) electricity expenditures by income level • Average (mean) gasoline and motor oil expenditures by income level CALCULATIONS & ASSUMPTIONS To run our IMPLAN model, we assume that the additional energy costs come in the form of lost consumer income. Our approach took the following steps: 1. Calculate the price difference between EU and U.S. prices for electricity, natural gas, and motor fuels. a. Because the BLS data aggregates “Gasoline and motor oil” as an expenditure line item, we use a weighted average of the Gasoline and Diesel percent difference. The weighted average is based on EIA data for “product supplied for finished gasoline” and “No 2 diesel fuel sales/ deliveries to On-highway customers” consumption figures.15 b. TA-Table 1 shows the difference in prices: TA-Table 1: Residential Energy Price Differential Impacts, 2014 2. We apply the values in the table above to the average annual expenditre by energy type for each income level in the BLS survey data described above. For example, consumers in the <$5,000 income bracket spent an average of $201 on natural gas in 2014. For this analysis, we multiply this expenditure amount by the 227 percent difference from the table above to calculate a new expenditure value of $457 for this income bracket. a. We assume that under the higher price scenario, consumption would stay constant. Implicitly, we are assuming that Americans would continue to have the same lifestyle (i.e., large homes, road miles traveled, etc.) under higher energy prices. Of course, demand isn’t completely inelastic, but for simplicity and the purposes of this analysis, we assume it is. 3. After running the calculation above for each of the BLS income levels, we then group the income levels to match the income level breakdown in PLEXOS.16 TA-Table 2 shows the final results of this calculation. US Price (USD/unit) EU Price (USD/unit) % Difference Industrial Electricity (MWh) $71.00 $116.96 165% Natural Gas (mcf) $5.55 $13.50 243%
  • 50. 42 TA-Table 2: Average Residential Electricity, Natural Gas, and Motor Fuel Expenditure by Income Level, 2014, ($ Billions) 4. Finally, once we calculate how much additional consumer expenditures would have been under energy prices that mirror those of the EU, we are able to run IMPLAN. The values in the table above are input into the U.S. national IMPLAN model for the year 2014 as a change in Household Income. INDUSTRIAL MODELING ASSUMPTIONS & DATA We relied on the following data to model the Industrial sector: • US Energy Prices — Energy Information Administration (EIA) as described in Residential section.17 • European Energy Prices — European Commission’s Eurostat as described in Residential section.18 • Historical Exchange Rates: U.S. Internal Revenue Service (IRS).19 • US Industrial Energy Spending: • Used the US Census Annual Survey of Manufacturers (ASM)20 data from 2014 to identify electricity spending and fuel spending for each of the manufacturing industry codes in IMPLAN. • Matching was done by industry name; which corresponds to NAICS codes at the 4-, 5- and 6-digit levels. • Used the EIA’s Manufacturing Energy Consumption Survey (MECS) to determine the percentage of total fuel spending that natural gas represents.21 • Data is from 2010 (most recent year available) Income Bracket 2014 Actual Expenditure Increased Price Scenario Difference Less than $10k $25.5 $53.3 -$27.8 10k to 15k $20.1 $42.1 -$22.0 15k to $25k $48.8 $102.0 -$53.3 $25 to $35k $76.2 $159.4 -$55.8 $35k to $50k $73.3 $153.4 -$80.1 $50k to $75k $102.4 $214.2 -$111.8 $75k to $100k $71.7 $150.1 -$78.4 $100k to $150k $88.9 $186.1 -$97.2 $150k and more $76.0 $159.4 -$83.4 Total $582.8 $1,219.9 -$609.7
  • 51. 43 • MECS data is aggregated for some industries. Where data were not available for detailed industries (5-digit or 6-digit NAICS), more aggregated data were used. For example, MECS data were not available for Plastics Packaging Materials (NAICS 32611), so we used data for Plastics and Rubber Products (NAICS 326). CALCULATIONS & ASSUMPTIONS To calculate the impact of higher energy prices in the industrial sector, we took the following steps: 1. We ranked the top 25 industries based on total electricity and fuel spend from the ASM. 2. We increased the electricity and natural gas spend for the 25 industries by the percentage increase calculated for the Industrial sector. a. We use the EIA data described above for prices (see Residential Data section above). We run the same calculation to compare US and EU prices. The results of this calculation are shown in TA-Table 3. TA-Table 3: Industrial Energy Price Differential Impacts, 2014 3. For each industry we reduced the Proprietor Income in IMPLAN to reflect the increase in energy expenses. US Price (USD/unit) EU Price (USD/unit) % Difference Residential Electricity (MWh) $125.2 $259.31 207% Natural Gas (mcf) $10.97 $24.94 227% Motor Fuels (gallons) Gasoline $3.44 $7.42 216% Diesel $3.83 $6.77 177% Wtd. Gas & Diesel 207%
  • 52. 44 Notes 1 See http://www.eia.gov/ 2 https://www.eia.gov/electricity/data/state/avgprice_annual.xls 3 https://www.eia.gov/dnav/ng/ng_pri_sum_a_EPG0_PRS_DMcf_a.htm 4 https://www.eia.gov/dnav/ng/ng_pri_sum_a_EPG0_PIN_DMcf_a.htm 5 https://www.eia.gov/dnav/pet/pet_pri_gnd_a_epm0_pte_dpgal_a.htm 6 https://www.eia.gov/dnav/pet/pet_pri_gnd_a_epd2d_pte_dpgal_a.htm 7 http://ec.europa.eu/eurostat 8 See http://ec.europa.eu/eurostat/tgm/table.do?tab=table&init=1&plugin=1&language=en&pcode=ten00117 and http://ec.europa.eu/eurostat/tgm/table.do?tab=table&init=1&plugin=1&language=en&pcode=ten00117 9 See http://ec.europa.eu/eurostat/tgm/table.do?tab=table&init=1&plugin=1&language=en&p- code=ten00118 and http://ec.europa.eu/eurostat/tgm/table.do?tab=table&init=1&plugin=1&lan- guage=en&pcode=ten00118 10 http://www.eea.europa.eu/data-and-maps/daviz/nominal-and-real-fuel-prices-2#tab-chart_1 11 https://www.irs.gov/Individuals/International-Taxpayers/Yearly-Average-Currency-Exchange-Rates 12 http://www.bls.gov/cex/csxcombined.htm 13 http://www.bls.gov/cex/2014/combined/income.xlsx 14 http://www.bls.gov/cex/2014/combined/higherincome.xlsx 15 See https://www.eia.gov/dnav/pet/pet_cons_psup_a_EPM0F_VPP_mbbl_a.htm and https://www.eia.gov/ dnav/pet/PET_CONS_821USE_A_EPD2D_VHN_MGAL_A.htm 16 For example, the BLS survey data has income levels broken down (for the most part) by $5,000 increments (e.g., $15,000-$19,999). Some of the increments fit within the income levels described in Table 2, but others do not. As an example, the BLS survey has expenditure data for the $15,000-$19,999 and $20,000-$29,999 ranges. To get the total expenditure into the IMPLAN bucket of $15-$25k, we take all of the expenditures from the $15,000-$19,999 range plus half of the expenditures in the $20,000-$29,999 range. 17 See http://www.eia.gov/ 18 http://ec.europa.eu/eurostat 19 https://www.irs.gov/Individuals/International-Taxpayers/Yearly-Average-Currency-Exchange-Rates 20 http://factfinder.census.gov/bkmk/table/1.0/en/ASM/2014/31GS101 21 https://www.eia.gov/consumption/manufacturing/data/2010/xls/Table3_3.xls
  • 53. Institute for 21st Century Energy U.S. Chamber of Commerce 1615 H Street, NW Washington, DC 20062 Phone: (202) 463-5558 Fax: (202) 887-3457 energyinstitute@uschamber.com www.energyxxi.org AN AFFILIATE OF THE U.S. CHAMBER OF COMMERCE