Insurers' journeys to build a mastery in the IoT usage
4qfy23-results-presentation.pdf
1. May 02 2023
Tata Steel Results
Fourth quarter and Financial year
Ended March 31, 2023
Presentation
Fourth quarter and Financial year
Ended March 31, 2023
Preferred option
May 02, 2023
Tata Steel Results
Presentation
Fourth quarter and Financial year ended March 31, 2023
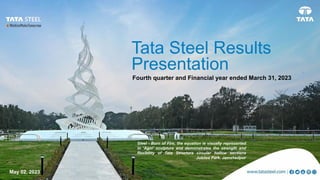
Steel - Born of Fire, the equation is visually represented
in ‘Agni’ sculpture and demonstrates the strength and
flexibility of Tata Structura circular hollow sections
Jubilee Park, Jamshedpur
2. Safe harbour statement
Statements in this presentation describing the
Company’s performance may be “forward
looking statements” within the meaning of
applicable securities laws and regulations.
Actual results may differ materially from those
directly or indirectly expressed, inferred or
implied. Important factors that could make a
difference to the Company’s operations
include, among others, economic conditions
affecting demand/supply and price conditions
in the domestic and overseas markets in which
the Company operates, changes in or due to
the environment, Government regulations,
laws, statutes, judicial pronouncements and/or
other incidental factors.
Fibre Reinforced Polymer for poles / structures at a park in Jamshedpur, India
4. 0
250
500
750
Mar-21 Sep-21 Mar-22 Sep-22 Mar-23
EU Steel spot spread EU spread (w Energy, Carbon)
HRC spot gross spreads ($/t)
Steel prices and spot spreads were volatile on global uncertainties and policy
dynamics
4
China Steel spot spreads (Domestic, Export) EU Steel spread including energy, carbon costs
▪ Global steel prices have been recovering on improved
expectations about economic activity in western markets
and China
▪ However, uncertainty abounds driven by confluence of
factors ranging from geopolitics to concerns about global
financial markets
▪ Coking coal and Iron ore prices were up while energy costs
moderated. Coking coal prices were close to $300/t levels
on tight supply and since have moderated
▪ Steel spot spreads improved in 4QFY23. Currently, China
and EU spreads are above FY2023 but below FY2022
levels
1,000
0
125
250
375
500
Mar-21 Sep-21 Mar-22 Sep-22 Mar-23
China domestic Spreads China export Spread
HRC spot gross spreads ($/t)
Sources: World Steel Association, IMF, Bloomberg, Steelmint; China HRC export spread = China HRC export FOB – 1.65x Iron Ore (62% Fe CFR) - 1x Coal (Premium HCC CFR); China HRC domestic spot spread is with China HRC domestic prices; EU
HRC spot spreads = HRC (Germany) - 1.6x iron ore (fines 65%, R’dam) - 0.8x premium hard coking coal (Aus) - 0.1x scrap (HMS, R’dam) ; EU spot spread incl. energy = EU HRC spot spread – Carbon cost – 0.5 x NG ($/Mwh) – 0.15 x Electricity ($/Mwh)
5. India steel demand grew on government spending; Inflationary pressures
weighed on fundamentals in EU
5
5
5
Note : All data is on consolidated basis; 1. FY20 and FY21 incl. Southeast Asia Operations which is reclassified as continuing operations; 2. Interest Coverage Ratio: EBITDA / Interest, LTM basis 5
▪ Apparent steel consumption in India was up 14% on YoY
basis in 4QFY23 and was up 13% on YoY basis for
FY2023
▪ Infrastructure / Construction continued to improve while
auto production was down 4% QoQ during 4QFY23
▪ Inflationary pressures and sustained volatility weighed on
steel fundamentals during the year. Concerns about
banking sector in Jan – Mar quarter added to the mix
▪ ECB has hiked rates by 350 bps between June – March
2023. Inflation is presently around 7%
Sources: Bloomberg, SIAM, Joint Plant Committee, MOSPI, CMIE, Eurostat and Tata Steel, *Figures of Industrial Production for Capital Goods, Infrastructure/Construction, consumer durables and railways are rebased to Nov'18=100 using FY12 index based
sector weights; number of units produced as per SIAM; growth of key steel consuming sector is calculated by removing sub-segments which do not consume steel, ECB – European Central Bank
5
India Europe
Key steel consuming sectors* Key steel consuming sectors (%, YoY growth)
0
50
100
150
Jan-20 Jul-20 Jan-21 Jul-21 Jan-22 Jul-22 Jan-23
Capital Goods Infrastructure/ construction goods Automotive
-50%
0%
50%
100%
Jan-20 Jul-20 Jan-21 Jul-21 Jan-22 Jul-22 Jan-23
Machinery Construction Vehicles (units)
6. 6
FY23 : A year of strategic progress
Sustainability at core
▪Best in Class CO2 footprint in all
geographies
▪Multiple initiatives underway to
reduce emissions
▪Net Zero by 2045
Portfolio alignment with India growth story
65%
▪Highest annual crude steel
production of ~19.9 mn tons
▪Ongoing capacity expansion at
multiple locations
▪Amalgamation progressing
Financial performance
▪Consolidated EBITDA of
Rs 32,698 crores
▪Cash flow from operations of
Rs 21,683 crores
▪Net debt to EBITDA at 2.07x
Capital Returns
▪Dividend recommended of
Rs 3.60 per fully paid-up equity
share
▪Dividend payout ratio at 54%
India production
as % of total
Note : Dividend Payout ratio = Dividend / Profit After Tax 6
7. Some milestones we are proud of
36 million tons of
Iron ore mined
Global Diversity, Equity
& Inclusion lighthouse
68 new products
developed
500+ kt slag used for
road construction
60 transgender
employees onboarded
130+ patents filed
and granted
1st in India with Responsible
Steel certification
Rs 1,730 crores sales,
>18% YoY growth
Rs 275 crores spent
on R&D
1st in India to receive license
for weather resistant steel
Improvement savings
of Rs 6,500+ crores
Dream Click Build
Note : World Economic Forum recognised Tata Steel as Global Diversity, Equity & Inclusion lighthouse, R&D - Research and Development, Slag is a by-product in steel making process
Fibre reinforced composites
for Vande Bharat coaches
7
8. 8
Focused on creating sustainable value
Consolidate
position as
global
cost leader
Robust financial
health
Leadership in
Sustainability
Leadership
position in
technology
& digital
Leadership
in India
Become future
ready
9. Net Zero by 2045
Pursuing sustainability through multiple pathways
9
Initiatives
Note : CCU – Carbon Capture & Utilisation, EAF – Electric Arc Furnace, TSLP – Tata Steel Long Products, TEG - Thermo-Electric Generator , CO2 – Carbon dioxide, H2 - Hydrogen
Higher scrap
charge
Reducing
ash in Coal
Cleaner fuel
i.e., Natural
gas etc.
Progress on
Hydrogen
usage
Adoption of
HIsarna
Multilocation
EAF Lower
Alumina in
Iron ore
Higher
Renewable
energy use
Upscaling
CCU pilots
Partnering with
Academia
Nature based
solutions –
biomass etc.
FY23 progress Various pilots by R&D
▪Improvement in Blast
furnace fuel rates esp. at
Jamshedpur and TSLP
▪Increase in steel scrap
usage across locations
▪Reduced dependence on
coal at TSLP
▪Super Absorbent Polymer
to reduce moisture in
coke
▪Trial for injecting H2 into
blast furnace to reduce
coke usage
▪Pilot to convert captured
CO2 to polycarbonate
▪Trial of 1 kWh TEG to
convert low grade waste
to Electricity
▪10 tons per day pilot plant
to produce methanol from
blast furnace flue gases
10. Focus on ‘Zero harm’
Committed towards excellence in Safety & Health of employees1
Integrated Command Center
Focus on Health of employees
Safety remains a top priority
*Lost Time Injury Frequency Rate per million-man hours worked, for Tata
Steel Group
71% LTIFR*
In the last 15 years
Fatalities
10
FY08
FY09
FY10
FY11
FY12
FY13
FY14
FY15
FY16
FY17
FY18
FY19
FY20
FY21
FY22
FY23
4
7
4 4
5
FY19 FY20 FY21 FY22 FY23
Integrated Command Center
Integrated Command Center to monitor Integrated Command Center
Safety Leadership Development Center
Integrated Command Center
“FELT Leadership” to drive risk perception
Note : 1. Employees refers to Permanent and Contract workforce
11. Improving quality of life of our communities
Social capital and scalable change models to enable deep societal impact
11
~Rs 1,600 crores
spent2 since FY19
1 Cumulative as on FY23
2 CSR Spending by Tata Steel Standalone
315
193
222
406
481
FY19 FY20 FY21 FY22 FY23
Strengthening tomorrow : Reached out to 6.7 lakh + children via
signature education programs and >56,000 brought back to school
31.5 Lakh+
Lives Impacted1
Rural & Urban
Education
Household Health &
Nutrition
Tribal Cultural
Heritage
Grassroots Rural
Governance
Women & Youth
Empowerment
Dignity for the
Disabled
Household
Livelihoods
Water
Resources
Grassroots
Sports
Public
Infrastructure
12. Growth in India to consolidate market leadership
Future investments set to drive sector leading returns
12
Leadership in India
Note : TSK – Tata Steel Kalinganagar, EAF – Electric Arc Furnace, TSM – Tata Steel
Meramandali, NINL – Neelachal Ispat Nigam Limited and DI – Ductile Iron
2023 2030
~16 MTPA
~5 MTPA
~21 MTPA
~27 MTPA
~13 MTPA
40 MTPA
Flats
Flats
Longs
Crude Steel
Longs
Crude Steel
Upstream 36 MTPA ~60 - 65 MTPA
Iron ore
1 MTPA ~4 MTPA
Tubes
0.45 MTPA ~1 MTPA
Wires
0.38 MTPA ~1 MTPA
Tinplate
0.20 MTPA ~1 MTPA
DI Pipe
Downstream
16
40
5
5
0.75
2023 TSK Ph 2 EAF TSK / TML /
NINL Ph 1
NINL Ph 2 /
EAF
2030
2x
India Crude Steel
production by 2030
TSK
Ph 2
EAF
TSK /
TSM /
NINL
NINL /
EAF
MTPA
~21
MTPA
13. Flats: 5 MTPA expansion progressing at Kalinganagar
Value added growth to maintain a future ready portfolio
13
1st FHCR coil produced from PLTCM TSK 5 MTPA expansion progressing
Note: PLTCM – Pickling Line and Tandem Cold Mill, CAL – Continuous Annealing Line, CGL – Continuous Galvanising Line, TSK – Tata Steel Kalinganagar, FHCR – Full Hard Cold Rolled
2.2 MTPA CRM complex : CAL & CGL
to be progressively commissioned
Pellets being produced from 6 MTPA plant
14. Longs: Well-placed to more than double the market share
Multilocational growth plans under execution
14
Note : NINL - Neelachal Ispat Nigam Limited: EAF - Electric Arc Furnace; LRPC: Low Relaxation Pre-Stressed concrete; MTB: Motor Tyre Bead ; GI : Galvanised Iron
Existing
capacity
~1 MTPA
EAF of
0.75 MTPA
in Punjab
Combi
Mill of
0.5 MTPA
Wire capacity
expansion by
0.1 MTPA
NINL, a strategic
acquisition,
ramping up well
Business model
innovation through EAF
based Mini Mill
State-of-the-art facility
to deepen play in
Specialty steel
▪ NINL operating at 1 MTPA
on annualised basis
▪ Detailed Project Report for
Ph1 expansion to around
5 MTPA under progress
Augmenting
downstream capacity
▪ Land acquisition done, site
work under progress
▪ Key components and main
technology ordered from
leading global supplier
▪ Combi → Special bar and
Wire rod mill
▪ Order placement & Detail
engineering completed.
Utilities work has started
▪ De-bottlenecking and new
LRPC line being added
▪ Addition of thick MTB and
new GI lines is under
progress
15. Downstream: Value added growth for product mix enrichment
Tubes, Tinplate and Tata Metaliks
15
▪ Tubes capacity to reach 4 million
tons by FY30
o Asset light growth along with Tube
Manufacturing Partners
o Investment in technology to further
market share
o Scaling up of services & solutions
offerings
▪ Tinplate capacity to reach ~0.7
million tons by 2025
o Tinplate demand is less cyclic than
that for hot rolled coils
o Application in growing packaging
industry
o One of the higher value-added
product in downstream portfolio
▪ Ductile Iron Pipe expansion
underway
o Progressing towards ~0.4 MTPA
finished product capacity by FY24
o End use demand to grow at 1.5x
GDP
o Application in pipes for drinking
water, irrigation etc.
100 years of leading
tinplate revolution
Application of tubes in
a structure at Kolkata
Tata Ductura, designed
to last for years
16. 16
India1
Tata Steel caters to ~87% of domestic market
Domestic deliveries up 11% on record sales across our chosen segments
mn tons
Note: 1 India incl. Tata Steel Standalone and Tata Steel Long Products, BPR – Branded
Products and Retail, IPP – Industrial Products and Projects
Automotive BPR IPP Downstream
3.66 2.64 1.61
1.17
1.41
1.46
5.71 6.38 7.25
4.77 5.29 5.85
2.00
2.56 2.69
FY21 FY22 FY23
17.3
18.9
18.3
Exports
Auto and
ancillaries
3.3 3.8 4.2
FY21 FY22 FY23
Business Verticals End use sectors
2.2 2.5 2.8
FY21 FY22 FY23
Retail : Individual
housebuilders Packaging
0.4 0.5 0.5
FY21 FY22 FY23
3.7 4.2 4.6
FY21 FY22 FY23
Construction &
Infrastructure Energy
Consumer
Durables
0.5 0.5 0.6
FY21 FY22 FY23
0.5 0.6 0.6
FY21 FY22 FY23
Engineering
goods
Trade &
Commercial Exports
1.6 1.8 2.0
FY21 FY22 FY23
1.5 1.7 1.9
FY21 FY22 FY23
3.7
2.6
1.6
FY21 FY22 FY23
Note : FY2021 and FY2022 are estimates, Auto and ancillaries includes B2B and ECA sales, Wire and Specialty steel sales; Retail
is B2C includes Tiscon, Shaktee, Galvanised Plain Retail, Tubes and Wires; Packaging incl. Tinplate, High Tensile steel strapping
,LPG, Drums & Barrels, Construction & Infra is B2B sales to construction companies; Energy incl. Oil & Gas, Wind, Solar etc.;
Consumer Durables is sales to Furniture, Appliances; Engineering incl. Shipbuilding, Railways and Capital Goods etc.; and Trade &
Commercial is sales to rerollers, fabrication etc. B2B – Business to Business, ECA – Emerging Corp. accounts, B2C – Business
to Consumer and LPG – Liquefied Petroleum Gas
20. Value accretive consolidation with multiple benefits
Note : TSLP – Tata Steel Long Products, TCIL – Tinplate Company of India Limited, TS Mining – Tata Steel Mining, S&T Mining – Joint Venture between SAIL & Tata Steel, Swap ratio is the number of
Tata Steel’s shares that will be offered in exchange for one share of merging entity
TSLP TCIL Tata Metalliks
TS Mining S&T Mining Indian Steel &
Wire Products
TRF Ltd.
Swap ratio 7.9
Swap ratio 3.3
Swap ratio 6.7 Swap ratio 1.7
Listed
Unlisted
Reduced corporate and
compliance costs
Optimal resource use,
lower royalty
Faster growth, stronger
balance sheet
Provide greater liquidity
to shareholders
20
21. 2
1
Tata Steel Consolidated
(All figures are in Rs. Crores
unless stated otherwise)
4QFY23 3QFY23 4QFY22
Production (mn tons)1
7.80 7.56 7.62
Deliveries (mn tons) 7.78 7.15 8.01
Total revenue from operations 62,962 57,084 69,324
Raw material cost2
25,988 28,231 24,873
Change in inventories 2,668 1,791 2,757
Employee benefits expenses 5,795 5,342 6,056
Other expenses 21,291 17,671 20,607
EBITDA 7,225 4,154 15,174
Adjusted EBITDA3
7,225 2,727 15,891
Adjusted EBITDA per ton (Rs.) 9,288 3,812 19,832
Other income 170 271 292
Finance cost 1,794 1,768 1,099
Pre exceptional PBT 3,309 243 12,139
Exceptional items (gain)/loss (12) (160) 274
Tax expenses 1,755 2,905 2,030
Reported PAT 1,566 (2,502) 9,835
Other comprehensive income (195) (3,629) 519
1. Production Numbers: Standalone & Tata Steel Long Products - Crude Steel Production, Europe - Liquid Steel Production; SEA - Saleable Steel Production. 2. Raw material cost includes raw material
consumed, and purchases of finished and semi-finished products. 3. Adjusted for changes on account of FX movement on intercompany debt / receivables. BSPS - British Steel Pension Scheme
Key drivers for QoQ change:
▪ Revenues: increased by 10% primarily driven by India
performance. Higher deliveries in Europe were partly
offset by drop in realisations
▪ Raw Material cost: decreased across geographies
including India and Europe
▪ Change in inventories: primarily driven by drawdown
in India. In 3Q, there was NRV loss at Europe
▪ Other expenses: increased on higher consumables,
royalty, repairs and maintenance across entities
▪ Tax expenses: decreased upon lower deferred tax
component. In 3Q, there was £186 million non-cash
deferred tax charge relating to BSPS
▪ Other comprehensive income: increased mainly due
to remeasurement gains on defined benefit plans
21
22. 1 EBITDA adjusted for changes on account of FX movement on intercompany debt / receivables, NINL – Neelachal Ispat Nigam Limited
▪ Selling Result: Drop in realisation in Europe
partly offset by rise in India
▪ Cost Changes: due to decline in raw material
costs especially coking coal and operating
efficiencies
▪ Volume/Mix: primarily driven by higher
deliveries in India
▪ Indian subsidiaries: stronger operating
performance incl. NINL
in Rs crores
Consolidated 4QFY23 EBITDA1 stood at Rs 7,225 crores
EBITDA margin improved from 5% in 3Q to 11% in 4Q primarily driven by India
22
2,727
7,225
1,332
3,753
1,088
710
279
Adjusted
EBITDA
3QFY23
Selling
Result
Cost
Changes
Volume/Mix Indian
subsidiaries
Others Adjusted
EBITDA
4QFY23
23. 2
3
Tata Steel Consolidated
1. Production Numbers: Standalone & Tata Steel Long Products - Crude Steel Production, Europe - Liquid Steel Production; SEA - Saleable Steel Production. 2. Raw material cost includes raw material
consumed, and purchases of finished and semi-finished products. 3. Adjusted for changes on account of FX movement on intercompany debt / receivables. BSPS - British Steel Pension Scheme
(All figures are in Rs. Crores
unless stated otherwise)
FY2023 FY2022
Production (mn tons)1
30.65 31.03
Deliveries (mn tons) 28.79 29.52
Total revenue from operations 2,43,353 2,43,959
Raw material cost2
1,16,597 91,077
Change in inventories (3,359) (7,598)
Employee benefits expenses 22,419 23,264
Other expenses 75,395 73,726
EBITDA 32,698 63,830
Adjusted EBITDA3
30,117 65,483
Adjusted EBITDA per ton (Rs.) 10,462 22,186
Other income 1,037 785
Finance cost 6,299 5,462
Pre exceptional PBT 18,122 50,361
Exceptional items (gain)/loss (113) 134
Tax expenses 10,160 8,478
Reported PAT 8,075 41,749
Other comprehensive income (13,849) 1,305
Key drivers for YoY change:
▪ Revenues: were broadly stable as increase at Tata
Steel India was offset by lower revenues at SE Asia
following divestment of NatSteel in FY2022
▪ Raw Material cost: increased due to higher costs
especially relating to coking coal
▪ Change in inventories: primarily driven by Europe,
where there was built up of slab inventory to be
consumed during relining of one of the blast furnaces
▪ Other expenses: increased on higher consumables,
repairs & maintenance and power charges partly offset
by lower royalty related expenses
▪ Tax expenses: were higher due to non-cash deferred
taxes, primarily relating to movement in BSPS
23
24. 65,483
30,117
-
38,070
- 208 377
2,633
656
Adjusted
EBITDA
FY22
Selling
Result
Cost
Changes
Volume/Mix Indian
subsidiaries
Others Adjusted
EBITDA
FY23
1 EBITDA adjusted for changes on account of FX movement on intercompany debt / receivables
▪ Selling Result: Primarily due to elevated
steel realisations in Europe esp. in 1HFY23
▪ Cost Changes: increased due to higher
material costs especially coking coal
▪ Volume/Mix: driven by higher deliveries in
India partly offset by Europe
▪ Indian subsidiaries: primarily relates to
operating performance at NINL
in Rs crores
Consolidated FY23 EBITDA1 stood at Rs 30,117 crores
Margin compression primarily due to higher material costs
24
25. Net debt stood at Rs 67,810 crores
Decreased by ~Rs. 3,900 crores during the quarter
25
25
25
Note : All data is on consolidated basis; 1. FY20 and FY21 incl. Southeast Asia Operations which is reclassified as continuing operations; 2. Interest Coverage Ratio: EBITDA / Interest, LTM basis 25
87,649
84,893
67,810
3,682
17,083
893
33
Gross Debt
Dec'22
Addition of
new leases
Loan
movement
FX Impact
and Others
Gross Debt
Mar'23
Cash, Bank &
Current
Investments
Net Debt
Mar'23
in Rs crores
25
27. 2
7
Tata Steel Standalone
Note : CO2 emission intensity calculated as per worldsteel methodology, In FY22 and FY23 Standalone figures include performance of the amalgamated erstwhile business of Tata Steel BSL Limited
Continued focus
on operational efficiencies and minimizing environmental impact
363
355
356
353
344
FY19 FY20 FY21 FY22 FY23
Coke Rate (kg/thm)
5.84
5.80
5.79
5.67
5.58
FY19 FY20 FY21 FY22 FY23
Specific Energy Consumption (Gcal/tcs)
3.50
3.10
2.70
2.71
2.62
FY19 FY20 FY21 FY22 FY23
Specific Fresh Water
Consumption (m3/tcs)
2.35
2.31
2.32
2.43
2.38
FY19 FY20 FY21 FY22 FY23
CO2 Emission Intensity (tCO2/tcs)
0.42
0.38
0.34
0.39
0.34
FY19 FY20 FY21 FY22 FY23
Specific Dust Emission (kg/tcs)
100
100
99
100
FY20 FY21 FY22 FY23
Solid Waste Utilisation (%)
Specific Fresh Water Consumption (m3/tcs)
Good Good Good
Good Good Good
27
28. 2
8
Tata Steel Standalone
(All figures are in Rs. Crores
unless stated otherwise)
4QFY23 3QFY23 4QFY22
Production (mn tons) 4.82 4.77 4.73
Deliveries (mn tons) 4.98 4.59 4.97
Total revenue from operations 34,275 30,465 36,681
Raw material cost1
13,209 14,598 12,647
Change in inventories 1,471 451 1,826
Employee benefits expenses 1,820 1,610 1,723
Other expenses 9,646 8,647 8,251
EBITDA 8,089 5,334 12,363
Adjusted EBITDA2
8,318 4,763 11,766
Adjusted EBITDA per ton (Rs.) 16,719 10,379 23,690
Other income 665 907 506
Finance cost 1,038 1,073 646
Pre exceptional PBT 6,386 3,623 10,715
Exceptional items (gain)/loss 699 6 76
Tax expenses 1,666 912 2,799
Reported PAT 4,021 2,705 7,839
Other comprehensive income 66 (43) 348
1. Raw material cost includes raw material consumed, and purchases of finished and semi-finished products 2. Adjusted for changes on account of FX movement on intercompany debt / receivables
Key drivers for QoQ change:
▪ Revenues: increased on improved volumes and higher
net realisations
▪ Raw Material cost: primarily decreased due to lower
coking coal consumption cost, operating efficiencies and
lower purchases at profit centers
▪ Other expenses: increased on FX impact, royalty and
higher conversion charges partly offset by lower freight
and handling charges
▪ Other Income: was lower on reduced dividend income
and mark to market movement
▪ Exceptional items: relates to impairment at TSUK
partly offset by gain on portfolio restructuring among
wholly owned subsidiaries
▪ Tax expenses: increased inline with profitability
28
29. 2
9
Note : TSUK and TSN report KPIs on a calendar basis aligned to regulatory requirements in their geographies, CO2 emission intensity as per worldsteel methodology, TSUK over last 12 months has
engaged in an exercise to harmonize reporting methodology with broader group and this led to revision in Specific Fresh Water Consumption, Dust emission and Solid Waste, *CY23YTD is an estimate
Key operating parameters
29
TSUK TSN
Specific Fresh Water Consumption (m3/tcs)
322
317
311
324
337
275
275
279
291
300
FY19 FY20 FY21 FY22 FY23
Coke Rate (kg/thm)
24.2
23.9
22.8
23.1
23.3
20.0
19.8
20.2
20.4
19.5
FY19 FY20 FY21 FY22 FY23
Specific Energy Consumption (GJ/tcs)
6.5
8.7
8.7
9.8
12.8
4.9
5.2
4.8
5.2
5.2
CY19 CY20 CY21 CY22 CY23YTD
2.23
2.25
2.14
2.16
2.18
1.77
1.76
1.77
1.78
1.76
FY19 FY20 FY21 FY22 FY23
CO2 Emission Intensity (tCO2/tcs)
99
99
99
99
99
78
79
75
74
72
CY19 CY20 CY21 CY22 CY23YTD
Solid Waste Utilisation (%)
Good Good Good
Good Good
Good 0.3
0.4
0.3
0.3
0.3
0.3
0.3
0.2
0.2
0.2
CY19 CY20 CY21 CY22 CY23YTD
Specific Dust Emission (kg/tcs)
* * *
30. 3
0
Key drivers for QoQ change:
▪ Revenues: were higher driven by improved volumes,
this was partly offset by drop in realisations
▪ Raw Material cost: was broadly stable as decline in
coking coal consumption cost was offset by rise in iron
ore consumption cost
▪ Change in Inventories was driven by drawdown in
inventories during the quarter. Lower QoQ given the
NRV loss ~£55 million in 3Q
▪ Other Expenses: increased on rise in bulk gas related
costs and emission rights related costs
▪ Employee benefits expenses: increased at Tata Steel
Netherlands due to actuarial movement
30
Tata Steel Europe
(All figures are in Rs. Crores
unless stated otherwise)
4QFY23 3QFY23 4QFY22
Liquid Steel production (mn tons) 2.27 2.24 2.31
Deliveries (mn tons) 2.16 1.99 2.40
Total revenue from operations 22,036 20,745 26,389
Raw material cost1 10,132 10,025 9,364
Change in inventories 1,148 1,455 902
Employee benefits expenses 3,448 3,196 3,855
Other expenses 8,942 7,629 7,939
EBITDA (1,641) (1,551) 4,349
EBITDA per ton (Rs.) (7,610) (7,810) 18,135
1. Raw material cost includes raw material consumed, and purchases of finished and semi-finished products
31. 3
1
Note : CO2 emission intensity calculated as per worldsteel methodology
Key operating parameters
31
Tata Steel Long Products
81.9
82.6
82.9
83.0
FY20
FY21
FY22
FY23
Crude Steel Yield (%)
4.5
4.3
4.4
4.0
FY20
FY21
FY22
FY23
Carbon Emission (tCO2/tcs)
486
474
500
503
FY20
FY21
FY22
FY23
Coke rate (kg/thm)
111
128
116
114
FY20
FY21
FY22
FY23
PCI rate (kg/thm)
655
601
671
643
FY20
FY21
FY22
FY23
Power consumption (kVAh/tcs)
1.3
1.5
2.4
2.5
FY20
FY21
FY22
FY23
Electrode consumption (kg/tcs)
Good
Good Good
Good
Good
Good
32. 3
2
Key drivers for QoQ change:
▪ Revenues: increased driven by ramp up at NINL during
the quarter. NINL is presently operating at run rate of
around 1 MTPA (incl. pig iron ) on annualised basis
▪ Raw Material cost: was broadly stable despite higher
production at NINL
▪ Employee benefit expenses: increased primarily at
NINL operations
▪ Other Expenses: increased due to rise in power and
fuel related expenses
▪ EBITDA: turned positive in 4Q vs. loss of Rs 352 crores
in 3QFY23
32
Tata Steel Long Products (Consolidated with NINL)
(All figures are in Rs. Crores
unless stated otherwise)
4QFY231 3QFY231 4QFY22
Total revenue from operations 3,016 2,113 1,799
Raw material cost2 1,922 1,908 1,132
Change in inventories 25 (365) (13)
Employee benefits expenses 117 107 54
Other expenses 995 835 462
EBITDA 2 (352) 177
EBITDA per ton (Rs.)3 46 (18,184) 11,186
EBITDA Margin (%) - - 9.8%
Reported PAT (524) (787) 60
1. Post acquistion of NINL, figures for 4QFY23 and 3QFY23 are on consolidated basis
2. Raw material cost includes raw material consumed, and purchases of finished and semi-finished products
3. EBITDA/Steel deliveries
33. Note : CRM – Cold Rolled Mill, tFP – ton of finished product, CO2 emission intensity calculated as per worldsteel methodology
Key operating parameters
33
Tinplate Company of India Limited
0.64
0.66
0.71
0.62
0.65
FY19
FY20
FY21
FY22
FY23
CO2 Emission Intensity (tCO2/tFP)
12.1
13.0
13.7
12.2
12.4
FY19
FY20
FY21
FY22
FY23
Fresh Water Consumption (m3/tFP)
416
429
449
407
422
FY19
FY20
FY21
FY22
FY23
Power consumption (kWh/tFP) 89
89
89
89
88
FY19
FY20
FY21
FY22
FY23
CRM Material Yield (%)
Good Good
Good Good
Tinplate
34. 3
4
Key drivers for QoQ change:
▪ Revenues: increased on higher sales volumes on QoQ
basis
▪ Raw Material cost: were broadly stable
▪ Change in Inventories: increased due to drawdown of
inventories
▪ Other Expenses: were marginally lower on QoQ basis
due to lower duties
▪ EBITDA: margin improved from 6% to 9% to stand at
Rs 88 crores
34
1. Raw material cost includes raw material consumed
2. EBITDA/Steel deliveries
Tinplate Company of India Limited
(All figures are in Rs. Crores
unless stated otherwise)
4QFY23 3QFY23 4QFY22
Total revenue from operations 1,033 960 1,227
Raw material cost1 672 688 757
Change in inventories 51 (18) 93
Employee benefits expenses 38 40 40
Other expenses 190 198 178
EBITDA 88 59 165
EBITDA per ton (Rs.)2 8,385 6,202 16,251
EBITDA Margin (%) 9% 6% 13%
Reported PAT 57 36 114
35. Note : tFP – ton of finished product, CO2 emission intensity calculated as per worldsteel methodology
Key operating parameters
35
Tata Metaliks
1.95
1.87
1.73
1.75
1.83
FY19
FY20
FY21
FY22
FY23
Carbon Emission (tCO2/thm)
0.6
0.63
0.61
0.53
0.48
FY19
FY20
FY21
FY22
FY23
Carbon Emission (tCO2/tFP)
Pig
Iron
business
Ductile
Iron
Pipe
business
2.2
2.4
2.3
1.97
1.8
FY19
FY20
FY21
FY22
FY23
Energy Consumption Intensity (GJ/tFP)
19.6
18.7
17.8
17.8
18.5
FY19
FY20
FY21
FY22
FY23
Energy Consumption Intensity (GJ/thm)
Ductile Iron Pipes, Tata Metalliks
Good
Good
Good
Good
36. 3
6
Key drivers for QoQ change:
▪ Revenues: increased driven by higher deliveries of
Ductile Iron Pipe (+33%) and improved realisations
▪ Raw Material cost: was higher inline with production
and rise in iron ore consumption cost
▪ Employee benefit expenses: Increased upon
recruitment and wage revision
▪ Other Expenses: Increased driven by rise in fuel costs
and higher consumables
▪ EBITDA: margin improved primarily driven by higher
realisations and improved product mix
36
1. Raw material cost includes raw material consumed
2. EBITDA = PBT + Interest + Depreciation
3. EBITDA/Steel deliveries
Tata Metaliks Limited
Tata Metaliks Limited
(All figures are in Rs. Crores
unless stated otherwise)
4QFY23 3QFY23 4QFY22
Total revenue from operations 930 792 815
Raw material cost1 574 536 543
Change in inventories 12 (1) 18
Employee benefits expenses 47 41 40
Other expenses 200 176 151
EBITDA2 97 41 62
EBITDA per ton (Rs.)3 6,430 2,921 4,122
EBITDA Margin (%) 10% 5% 8%
Reported PAT 56 9 52
37. 3
7
Key drivers for QoQ change:
▪ Deliveries: were slightly higher on QoQ basis
▪ Revenues: increased on higher volumes and improved
steel realisations
▪ EBITDA: increased on QoQ basis driven by margin
expansion
37
1. Raw material cost includes raw material consumed, and purchases of finished and semi-finished products
Tata Steel Thailand
(All figures are in Rs. Crores
unless stated otherwise)
4QFY23 3QFY23 4QFY22
Saleable Steel production (mn tons) 0.31 0.27 0.34
Deliveries (mn tons) 0.31 0.29 0.34
Total revenue from operations 1,786 1,584 1,982
Raw material cost1 1,171 1,138 1,420
Change in inventories 76 1 (5)
Employee benefits expenses 51 56 93
Other expenses 430 393 371
EBITDA 57 1 102
EBITDA per ton (Rs.) 1,827 25 3,004