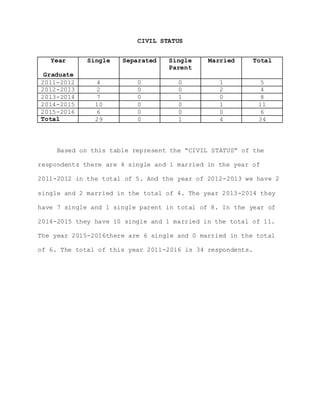
SlideShare a Scribd company logo
1 of 23
CIVIL STATUS
Based on this table represent the “CIVIL STATUS” of the
respondents there are 4 single and 1 married in the year of
2011-2012 in the total of 5. And the year of 2012-2013 we have 2
single and 2 married in the total of 4. The year 2013-2014 they
have 7 single and 1 single parent in total of 8. In the year of
2014-2015 they have 10 single and 1 married in the total of 11.
The year 2015-2016there are 6 single and 0 married in the total
of 6. The total of this year 2011-2016 is 34 respondents.
Year
Graduate
Single Separated Single
Parent
Married Total
2011-2012 4 0 0 1 5
2012-2013 2 0 0 2 4
2013-2014 7 0 1 0 8
2014-2015 10 0 0 1 11
2015-2016 6 0 0 0 6
Total 29 0 1 4 34
LOCATION
Base on this table represent region of location of
residence/place of work of BS-Business Administration Graduates
year 2011-2016. The researcher found out that all of the
respondents are located in municipality and all of their place
of work is local.
Year
Graduate
City Municipality TOTAL
2011-2012 0 5 5
2012-2013 0 4 4
2013-2014 0 8 8
2014-2015 0 11 11
2015-2016 0 6 6
Total 0 34 34
SEX
Year
Graduate
Female Male Total
2011-2012 2 4 6
2012-2013 2 1 3
2013-2014 7 1 8
2014-2015 8 3 11
2015-2016 6 0 6
Total 25 9 34
Based on this table represent the gender/sex distribution of
the respondents BS-Business Administration Graduates year 2011-
2016. There are 2 female and 4 male in the year of 2011-2012 in
the total of 6. In the year 2012-2013 has the lowest number of
graduates, there are 2 female and 1 male in the total of 3. The
year 2013-2014 there are 7 female and 1 male in the total of 8. In
the year 2014-2015 has the highest number of graduates, there are
8 female and 3 male in the total of 11. And in the year 2015-2016
there are only 6 female.
HOW LONG DID YOU STAY IN YOUR FIRST JOB?
Year
Graduate
2011-
2012
2012-
2013
2013-
2014
2014-
2015
2015-
2016
Total
Less
than a
month
1 0 1 0 2 4
1 year
to less
than 2
years
0 0 2 2 3 7
1to 6
months
5 0 0 4 0 9
2 years
to less
than 3
years
0 2 3 1 0 6
7 to 11
months
0 0 0 1 1 2
3 years
to less
than 4
years
0 0 2 2 0 4
Other,
please
specify
0 1 0 1 0 2
Total 6 3 8 11 6 34
WHAT WERE YOUR REASON(S) FOR STAYING THE JOB?
Year
Graduate
2011-
2012
2012-
2013
2013-
2014
2014-
2015
2015-
2016
Total
Salaries&
benefits
1 0 2 1 2 6
Career
challenge
0 0 1 1 1 3
Related &
Special
skill
4 3 4 9 3 23
Proximity
To
Residence
0 0 0 0 0 0
Other
Reason
1 0 1 0 0 2
Total 6 3 8 11 6 34
Based on thiS table represent the reason of the respondents why
they are accepting the job. The researchers found out that in the year
of 2011-2012 there are 1 who said that it is because of the salaries
and benefits, 4 who said that it is because of the related and special
skills, and 1 has another reason in a toatal of 6. In the year of
2012-2013 there are 2 who said that its because of the salaries and
benefits, and 1 who said that its because of the career challenge in
a total of 3. In the year of 2013-2014 there are 3 who said that its
because of the salaries and benefits, 1 who said that its because of
the career challenge, and 4 who said that it is because of the related
and special skills in a total of 8. In the year of 2014-2015 there are
6 who said that it is because of the salaries and benefits, and 4 who
said that its because of the related and special skills in a total of
10. And the year of 2015-2016 there are 2 who siad that its because
of the salaries and benefits, 5 who said that it is because of the
related and special skills in a total of 7. In the year of 2011-2016
there are 14 who said that it is because of salaries and benefits, 2
who said that it is because of the career chellenge, 17 who said that
it is because of the related and specil skills and 1 who said that
there’s another reason in a total of 34.
WHAT WERE YOUR REASONS FOR ACCEPTING THE JOB?
Year
Graduate
2011-
2012
2012-
2013
2013-
2014
2014-
2015
2015-
2016
Total
Salaries &
Benefits
1 2 3 6 2 14
Career
challenge
0 1 1 0 0 2
Related &
special
skiill
4 0 4 4 5 17
Proximity
to
residence
0 0 0 0 0 0
Other
reason(s)
pleas
specify
1 0 0 0 0 1
TOTAL 6 3 8 10 7 34
Based on thi table represent the reason of the respondents why
they are accepting the job. The researchers found out that in the year
of 2011-2012 there are 1 who said that it is because of the salaries
and benefits, 4 who said that it is because of the related and special
skills, and 1 has another reason in a toatal of 6. In the year of
2012-2013 there are 2 who said that its because of the salaries and
benefits, and 1 who said that its because of the career challenge in
a total of 3. In the year of 2013-2014 there are 3 who said that its
because of the salaries and benefits, 1 who said that its because of
the career challenge, and 4 who said that it is because of the related
and special skills in a total of 8. In the year of 2014-2015 there are
6 who said that it is because of the salaries and benefits, and 4 who
said that its because of the related and special skills in a total of
10. And the year of 2015-2016 there are 2 who siad that its because
of the salaries and benefits, 5 who said that it is because of the
related and special skills in a total of 7. In the year of 2011-2016
there are 14 who said that it is because of salaries and benefits, 2
who said that it is because of the career chellenge, 17 who said that
it is because of the related and specil skills and 1 who said that
there’s another reason in a total of 34.
MAJOR LINE OF BUSINESS OF THE COMPANY YOU ARE PRESENTLY EMPLOYED
IN.
Year
Graduate
2011-
2012
2012-
2013
2013-
2014
2014-
2015
2015-
2016
TOTAL
Agriculture,
hunting and
forestry
0 0 1 0 1 2
Fishing 0 0 0 0 0 0
Mining and
Quarrying
0 0 0 0 0 0
Manufacturing 1 0 1 0 0 2
Electricity, gas
and water supply
0 0 0 0 0 0
Construction 0 0 0 0 0 0
Wholesale and
retail trade,
repair of motor
vehicles, motor
cycle and personal
and household
goods
2 2 0 2 1 7
Hotels and
restaurants
0 0 0 0 0 0
Transport storage
and communication
0 0 0 3 1 4
Financial
intermediation
3 0 6 2 0 11
Real state,
renting and
business
activities
0 0 0 0 0 0
Public
administration and
defense;
compulsory social
security
0 1 0 1 2 4
Education 0 0 0 0 0 0
Health and social
work
0 1 0 1 0 2
Other community,
social and
personal service
activities
0 0 1 0 0 1
Private households
with employed
persons
0 0 0 0 1 1
Extra territorial
organizations and
bodies
0 0 0 0 0 0
TOTAL 6 4 9 9 6 34
WHAT IS YOUR INITIAL GROSS MONTHLY EARNING IN YOUR FIRST JOB?
Based on this table represent the initial gross income of
monthly earnings of BS- business administration graduates SY
2011-2016. The researchers found out below 5,000.00 in 2011-2012
they have 1.in there we have a 1 in 15,000.00 to less than
10,000.00 in then we have 3 on 5,000.00 to less than 10,000.00
and they we have 1 in 10,000.00n to less than 15,000.00 the
total of 6 respondents into 2011-2012
Year
Graduate
2011-2012 2012-2013 2013-2014 2014-2015 2015-2016 Total
Below
P5,000.00
1 0 2 0 1 4
P15,000.00
To less
than
P10,000.00
1 1 1 2 0 5
P5,000.00
To less
than
P10,000.00
3 0 4 6 3 16
P20,000.00
to less
than
P25,000.00
0 1 0 0 0 1
P10,000.00
to less
than
P15,000.00
1 1 1 3 2 8
P25,000.00
and above
0 0 0 0 0 0
Total 6 3 8 11 6 34
HOW LONG DID IT TAKE YOU TO LAND YOUR FIRST JOB?
Year
Graduate
2011-
2012
2012-
2013
2013-
2014
2014-
2015
2015-
2016
Total
Less
than a
month
1 1 3 4 3 12
1 year
to less
than 2
years
0 0 0 1 1 2
1to 6
months
5 1 4 6 1 17
2 years
to less
than 3
years
0 1 1 0 0 2
7 to 11
months
0 0 0 0 1 1
3 years
to less
than 4
years
0 0 0 0 0 0
Other. 0 0 0 0 0 0
Total 6 3 8 11 6 34
HOW DID YOU FIND YOUR FIRST JOB?
Year
Graduate
2011-
2012
2012-
2013
2013-
2014
2014-
2015
2015-
2016
Total
Response to
an
advertisement
0 0 0 0 0 0
Arranged by
school’s job
placement
officer
0 0 0 0 0 0
As-walk-in
applicant
4 1 5 9 5 24
Family
business
0 0 0 1 0 1
Recommended
by someone
1 2 3 1 1 8
Job fair or
public
employment
service
office (PESO)
0 0 0 0 0 0
Information
from friends
1 0 0 0 0 1
Other, please
specify
0 0 0 0 0 0
TOTAL 6 3 8 11 6 34
Based on this table shown how respondents find their job? The
researcher found out that in the year of 2011-2012 there are 4
who said that it is because as walk-in applicant, 1 said that
its because he/she recommended by someone, and 1 said that it is
because of the information from his/her friends in a total of 6.
In the year
WAS THE CURRICULUM YOU HAD IN COLLEGE RELEVANT TO YOUR FIRST
JOB?
Year
Graduate
YES NO TOTAL
2011-2012 5 1 6
2012-2013 3 0 3
2013-2014 7 1 8
2014-2015 9 2 11
2015-2016 4 2 7
TOTAL 28 6 34
Based on this table shown if the course of respondents they took
up in college are related to their job. The researcher found out that
in the year 2011-2012 there are 5 respondents who said YES and 1 who
said NO in a total of 6. In the year 2012-2013 there are only 3 who
siad YES. In the year 2013-2014 there are 7 who said YES and there are
1 who said NO in a total of 8. In the year 2014-2015 there are 7 who
said YES and there are 4 who said NO in a total of 11. And in the year
20-15-2016 there are 6 who said YES. And when we will add all in all
there are 28 who sais YES and there are 6 who said NO in a total of 34
in the year of 2011-2016
IF YES, WHAT COMPETENCIES LEARNED IN COLLEGE DID YOU FIND VERY
USEFUL IN YOUR FIRST JOB?
Year
Graduate
2011-
2012
2012-
2013
2013-
2014
2014-
2015
2015-
2016
Total
Communication
skills
0 0 0 2 0 2
Human relation
skills
6 3 8 6 6 29
Entrepreneural
skills
0 0 0 1 0 1
Information
technology
skills
0 0 0 2 0 2
Problem-
solving skills
0 0 0 0 0 0
Critical
thinking
skills
0 0 0 0 0 0
Others, please
specify
0 0 0 0 0 0
TOTAL 6 3 8 11 6 34
Chapter 3
Interpretation of Data
This chapter deals with the interpretation of data in
conjunction to the problems of study is seeks to answer.
Number of Graduates
For the academic years covered by this study SY 2011-
2016, which is six (6) years, the aggregate total of graduate is
34 distributed as shown in the table:
Course
YEAR
Total
Per
Course
2011-
2012
2012-
2013
2013-
2014
2014-
2015
2015-
2016
BS
Business
Administr
ation
5 4 8 11 6 34
TOTAL 5 4 8 11 6 34
The respondents to the GTS were thirty four (34) BSBA
Graduates. Data shows that the year of 2014-2015 is the highest
numbers of graduates.
Table 1
Total Number of Respondents
BSBA Graduates
2011-2014
Course
YEAR
Total
%
Distribution
2011-
2012
2012-
2013
2013-
2014
2014-
2015
2015-
2016
BS Business
Administration
5 4 8 11 6 34 100%
Total/Year 5 4 8 11 6 34 100%
Based on this table represent the total number of
respondents. There are 5 graduates for the SY 2011-2012, 4
graduates for the SY 2012-2013, 8 graduates for the SY 2013-
2014, 11 graduates for the SY 2014-2015, and 6 graduates for the
SY 2015-2016 in the total of 34 graduates.
IS THIS YOUR FIRST JOB AFTER COLLEGE?
YEAR
Graduate
2011-
2012
2012-
2013
2013-
2014
2014-
2015
2015-
2016
TOTAL
Yes 3 3 3 7 1 17
No 3 0 5 4 5 17
TOTAL 6 3 8 11 6 34
.
Based on this table represent the first job after
college. to first job year graduate of 2011-2016. The
researchers found out that tere are 3 respondents who said YES
and there 3 who said NO of the year 2011-2012 in a total of 6.
And there are 3 who said YES of the year of 2012-2013. In the
year 2013-2014 there are 3 who said YES and there are 5 who said
NO in a total of 8. There are 7 who said YES and there are 4 who
said NO in the year of 2014-2015 in a total of 11. There’s 1
who said YES and there are 5 who said NO in the year of 2015-
2016 in a total of 6. And in the year 2011-2016 there are 17 who
said YES and there are also 17 who said NO in the total of 34.
PRESENT EMPLOYMENT STATUS
Year
Graduate
2011-
2012
2012-
2013
2013-
2014
2014-
2015
2015-
2016
TOTAL
Regular 3 3 6 6 2 20
Contractual 1 0 2 3 2 8
Temporary 2 0 0 1 2 5
Self-
employment
0 0 0 1 0 1
Casual 0 0 0 0 0 0
TOTAL 6 3 8 11 6 34
Based on this table represents the employment status of BS
-Business Administration Graduates Year 2011-2016. The
researchers found out that in the year 2011-2012 there are 3 in
the regular/permanent, 1 in the contractual, 2 in the temporary
in the total of 6. In the year 2012-2013 there are only 3 in the
regular/ permanent. In the year 2013-2014 there are 6 in the
regular/permanent, 2 in the contractual 1 in the temporary the
same as the self-employed in the total of 8. In the year 2014-
2015 there are 6 in the regular/permanent, 3 in the contractual,
1 in the temporary and 1 in the self-employed in the total of
11. And in the year 2015-2016 there are 2 in the
regular/permanent, 2 in the contractual and 2 in the temporary
in the total of 6. In the year 2011-2016 there are 20 in the
regular/ permanent, 8 in the contractual, 5 in the temporary and
1 in self-employed in the total of 34.
ARE YOU EMPLOYED?
Year
Graduate
2011-
2012
2012-
2013
2013-
2014
2014-
2015
2015-
2016
TOTAL
YES 4 4 7 8 5 28
NO 1 0 1 3 1 6
TOTAL 5 4 8 11 6 34
Base on this table for that are you employed or not. In
the SY 2011-2012 there are 4 yes and 1 no, for the SY 2012-2013
there are 4 yes and o no, for the SY 2013-2014 there are 7 yes
and 1 no, for the SY 2014-2015 there are 8 yes and 3 no, and for
the SY 2015-2016 there are 5 yes and 1 no and the total of yes
is 28band no is 6 in the total of 34.
PLACE OF WORK
Year
Graduate
2011-
2012
2012-
2013
2013-
2014
2014-
2015
2015-
2016
TOTAL
Local 5 4 8 11 5 33
Abroad 0 0 0 0 1 1
TOTAL 5 4 8 11 6 34
Based on this represent of resident place of work of
bachelor of science in business administration graduates year
2011-2016. The researcher found out that all of the respondents
are located in abroad and all of place of work.
IS YOUR FIRST JOB RELATED TO THE COURSE YOU TOOK UP IN COLLEGE?
Year
Graduate
YES NO TOTAL
2011-2012 5 1 6
2012-2013 3 0 3
2013-2014 7 1 8
2014-2015 7 4 11
2015-2016 6 0 6
TOTAL 28 6 34
Based on this table represent that the course of respondents they
took up in college are related to their job. The researcher found out
that in the year 2011-2012 there are 5 respondents who said YES and 1
who said NO in a total of 6. In the year 2012-2013 there are only 3
who siad YES. In the year 2013-2014 there are 7 who said YES and there
are 1 who said NO in a total of 8. In the year 2014-2015 there are 7
who said YES and there are 4 who said NO in a total of 11. And in the
year 20-15-2016 there are 6 who said YES. And when we will add all in
all there are 28 who sais YES and there are 6 who said NO in a total
of 34 in the year of 2011-2016.

More Related Content

Similar to thesis.docx

Why Workers are leaving
Why Workers are leavingWhy Workers are leaving
Why Workers are leaving
Kelly Services
 

Similar to thesis.docx (20)

Facebook Targeting By The Numbers
Facebook Targeting By The NumbersFacebook Targeting By The Numbers
Facebook Targeting By The Numbers
 
Universum Student Survey 2013 Singapore
Universum Student Survey 2013 SingaporeUniversum Student Survey 2013 Singapore
Universum Student Survey 2013 Singapore
 
School to Work Survey - Regionally specific feedback from students.
School to Work Survey - Regionally specific feedback from students.School to Work Survey - Regionally specific feedback from students.
School to Work Survey - Regionally specific feedback from students.
 
B&A consumer confidence tracker july 2014
B&A consumer confidence tracker july 2014B&A consumer confidence tracker july 2014
B&A consumer confidence tracker july 2014
 
Job search skills 16 february 2015
Job search skills 16 february 2015Job search skills 16 february 2015
Job search skills 16 february 2015
 
Check yourenglishvocabularyfortoeic
Check yourenglishvocabularyfortoeicCheck yourenglishvocabularyfortoeic
Check yourenglishvocabularyfortoeic
 
my_future_profession._ryzhova_nastya.pptx
my_future_profession._ryzhova_nastya.pptxmy_future_profession._ryzhova_nastya.pptx
my_future_profession._ryzhova_nastya.pptx
 
Week 5 presentation
Week 5 presentationWeek 5 presentation
Week 5 presentation
 
Singapore Malay/Muslim Community in Figures (2016)
Singapore Malay/Muslim Community in Figures (2016)Singapore Malay/Muslim Community in Figures (2016)
Singapore Malay/Muslim Community in Figures (2016)
 
Networking 101 - Building Relationships
Networking 101 - Building RelationshipsNetworking 101 - Building Relationships
Networking 101 - Building Relationships
 
Career opportunities for next generations in india
Career opportunities for next generations in indiaCareer opportunities for next generations in india
Career opportunities for next generations in india
 
Why Workers are leaving
Why Workers are leavingWhy Workers are leaving
Why Workers are leaving
 
Potato public agm 2014
Potato public agm 2014Potato public agm 2014
Potato public agm 2014
 
Law School and Legal Job Prospects in 2015
Law School and Legal Job Prospects in 2015Law School and Legal Job Prospects in 2015
Law School and Legal Job Prospects in 2015
 
Is Worker Confidence Making a Comeback?
Is Worker Confidence Making a Comeback?Is Worker Confidence Making a Comeback?
Is Worker Confidence Making a Comeback?
 
Class 4 7 summary 2013
Class 4   7  summary 2013Class 4   7  summary 2013
Class 4 7 summary 2013
 
Wheel of life booklet
Wheel of life bookletWheel of life booklet
Wheel of life booklet
 
Mehmet Çeli̇kel High school presentation
Mehmet Çeli̇kel High school presentationMehmet Çeli̇kel High school presentation
Mehmet Çeli̇kel High school presentation
 
Danai mushayandebvu
Danai mushayandebvuDanai mushayandebvu
Danai mushayandebvu
 
2015 Edelman Trust Barometer Japan
2015 Edelman Trust Barometer Japan2015 Edelman Trust Barometer Japan
2015 Edelman Trust Barometer Japan
 

Recently uploaded

出售伯明翰大学毕业证研究生文凭证书原版质量
出售伯明翰大学毕业证研究生文凭证书原版质量出售伯明翰大学毕业证研究生文凭证书原版质量
出售伯明翰大学毕业证研究生文凭证书原版质量
kthcah
 
一比一原版(CCA毕业证书)加利福尼亚艺术学院毕业证成绩单原件一模一样
一比一原版(CCA毕业证书)加利福尼亚艺术学院毕业证成绩单原件一模一样一比一原版(CCA毕业证书)加利福尼亚艺术学院毕业证成绩单原件一模一样
一比一原版(CCA毕业证书)加利福尼亚艺术学院毕业证成绩单原件一模一样
zovambe
 
一比一原版(UC毕业证书)加拿大卡尔加里大学毕业证成绩单原件一模一样
一比一原版(UC毕业证书)加拿大卡尔加里大学毕业证成绩单原件一模一样一比一原版(UC毕业证书)加拿大卡尔加里大学毕业证成绩单原件一模一样
一比一原版(UC毕业证书)加拿大卡尔加里大学毕业证成绩单原件一模一样
rgthdgf
 
一比一原版北雷克斯学院毕业证成绩单原件一模一样
一比一原版北雷克斯学院毕业证成绩单原件一模一样一比一原版北雷克斯学院毕业证成绩单原件一模一样
一比一原版北雷克斯学院毕业证成绩单原件一模一样
CC
 
一比一定制加拿大安大略理工大学毕业证(UOIT毕业证书)学位证书
一比一定制加拿大安大略理工大学毕业证(UOIT毕业证书)学位证书一比一定制加拿大安大略理工大学毕业证(UOIT毕业证书)学位证书
一比一定制加拿大安大略理工大学毕业证(UOIT毕业证书)学位证书
egfdgfd
 
一比一原版(McMaste毕业证书)加拿大麦克马斯特大学毕业证成绩单原件一模一样
一比一原版(McMaste毕业证书)加拿大麦克马斯特大学毕业证成绩单原件一模一样一比一原版(McMaste毕业证书)加拿大麦克马斯特大学毕业证成绩单原件一模一样
一比一原版(McMaste毕业证书)加拿大麦克马斯特大学毕业证成绩单原件一模一样
AD
 
原版定制英国格鲁斯特大学毕业证原件一模一样
原版定制英国格鲁斯特大学毕业证原件一模一样原版定制英国格鲁斯特大学毕业证原件一模一样
原版定制英国格鲁斯特大学毕业证原件一模一样
AS
 
一比一原版曼彻斯特城市大学毕业证成绩单原件一模一样
一比一原版曼彻斯特城市大学毕业证成绩单原件一模一样一比一原版曼彻斯特城市大学毕业证成绩单原件一模一样
一比一原版曼彻斯特城市大学毕业证成绩单原件一模一样
fsdfdsgf
 
一比一原版(Cumbria毕业证书)英国坎布里亚大学毕业证成绩单学位证书
一比一原版(Cumbria毕业证书)英国坎布里亚大学毕业证成绩单学位证书一比一原版(Cumbria毕业证书)英国坎布里亚大学毕业证成绩单学位证书
一比一原版(Cumbria毕业证书)英国坎布里亚大学毕业证成绩单学位证书
AD
 
一比一原版(Auburn毕业证书)奥本大学毕业证原件一模一样
一比一原版(Auburn毕业证书)奥本大学毕业证原件一模一样一比一原版(Auburn毕业证书)奥本大学毕业证原件一模一样
一比一原版(Auburn毕业证书)奥本大学毕业证原件一模一样
AS
 
mechanical vibrations pebbles.pptbbbbbbbbx
mechanical vibrations pebbles.pptbbbbbbbbxmechanical vibrations pebbles.pptbbbbbbbbx
mechanical vibrations pebbles.pptbbbbbbbbx
joshuaclack73
 
Vina Score and Vin Min for almost all the models 2024
Vina Score and Vin Min for almost all the models 2024Vina Score and Vin Min for almost all the models 2024
Vina Score and Vin Min for almost all the models 2024
jipohal318
 
一比一定制加拿大新喀里多尼亚学院毕业证(UofL毕业证书)学位证书
一比一定制加拿大新喀里多尼亚学院毕业证(UofL毕业证书)学位证书一比一定制加拿大新喀里多尼亚学院毕业证(UofL毕业证书)学位证书
一比一定制加拿大新喀里多尼亚学院毕业证(UofL毕业证书)学位证书
egfdgfd
 

Recently uploaded (20)

出售伯明翰大学毕业证研究生文凭证书原版质量
出售伯明翰大学毕业证研究生文凭证书原版质量出售伯明翰大学毕业证研究生文凭证书原版质量
出售伯明翰大学毕业证研究生文凭证书原版质量
 
一比一原版(CCA毕业证书)加利福尼亚艺术学院毕业证成绩单原件一模一样
一比一原版(CCA毕业证书)加利福尼亚艺术学院毕业证成绩单原件一模一样一比一原版(CCA毕业证书)加利福尼亚艺术学院毕业证成绩单原件一模一样
一比一原版(CCA毕业证书)加利福尼亚艺术学院毕业证成绩单原件一模一样
 
一比一原版(UC毕业证书)加拿大卡尔加里大学毕业证成绩单原件一模一样
一比一原版(UC毕业证书)加拿大卡尔加里大学毕业证成绩单原件一模一样一比一原版(UC毕业证书)加拿大卡尔加里大学毕业证成绩单原件一模一样
一比一原版(UC毕业证书)加拿大卡尔加里大学毕业证成绩单原件一模一样
 
一比一原版北雷克斯学院毕业证成绩单原件一模一样
一比一原版北雷克斯学院毕业证成绩单原件一模一样一比一原版北雷克斯学院毕业证成绩单原件一模一样
一比一原版北雷克斯学院毕业证成绩单原件一模一样
 
Access to Rural Charging by David Skakel
Access to Rural Charging by David SkakelAccess to Rural Charging by David Skakel
Access to Rural Charging by David Skakel
 
一比一定制加拿大安大略理工大学毕业证(UOIT毕业证书)学位证书
一比一定制加拿大安大略理工大学毕业证(UOIT毕业证书)学位证书一比一定制加拿大安大略理工大学毕业证(UOIT毕业证书)学位证书
一比一定制加拿大安大略理工大学毕业证(UOIT毕业证书)学位证书
 
一比一原版(McMaste毕业证书)加拿大麦克马斯特大学毕业证成绩单原件一模一样
一比一原版(McMaste毕业证书)加拿大麦克马斯特大学毕业证成绩单原件一模一样一比一原版(McMaste毕业证书)加拿大麦克马斯特大学毕业证成绩单原件一模一样
一比一原版(McMaste毕业证书)加拿大麦克马斯特大学毕业证成绩单原件一模一样
 
5 Signs Your VW Key Fob Battery Needs Replacement
5 Signs Your VW Key Fob Battery Needs Replacement5 Signs Your VW Key Fob Battery Needs Replacement
5 Signs Your VW Key Fob Battery Needs Replacement
 
Microscope of ppt for botany major this is a project
Microscope of ppt for botany major this is a projectMicroscope of ppt for botany major this is a project
Microscope of ppt for botany major this is a project
 
原版定制英国格鲁斯特大学毕业证原件一模一样
原版定制英国格鲁斯特大学毕业证原件一模一样原版定制英国格鲁斯特大学毕业证原件一模一样
原版定制英国格鲁斯特大学毕业证原件一模一样
 
一比一原版曼彻斯特城市大学毕业证成绩单原件一模一样
一比一原版曼彻斯特城市大学毕业证成绩单原件一模一样一比一原版曼彻斯特城市大学毕业证成绩单原件一模一样
一比一原版曼彻斯特城市大学毕业证成绩单原件一模一样
 
一比一原版(Cumbria毕业证书)英国坎布里亚大学毕业证成绩单学位证书
一比一原版(Cumbria毕业证书)英国坎布里亚大学毕业证成绩单学位证书一比一原版(Cumbria毕业证书)英国坎布里亚大学毕业证成绩单学位证书
一比一原版(Cumbria毕业证书)英国坎布里亚大学毕业证成绩单学位证书
 
一比一原版(Auburn毕业证书)奥本大学毕业证原件一模一样
一比一原版(Auburn毕业证书)奥本大学毕业证原件一模一样一比一原版(Auburn毕业证书)奥本大学毕业证原件一模一样
一比一原版(Auburn毕业证书)奥本大学毕业证原件一模一样
 
mechanical vibrations pebbles.pptbbbbbbbbx
mechanical vibrations pebbles.pptbbbbbbbbxmechanical vibrations pebbles.pptbbbbbbbbx
mechanical vibrations pebbles.pptbbbbbbbbx
 
How Do I Know If My Volvo Has Throttle Position Sensor Problems
How Do I Know If My Volvo Has Throttle Position Sensor ProblemsHow Do I Know If My Volvo Has Throttle Position Sensor Problems
How Do I Know If My Volvo Has Throttle Position Sensor Problems
 
Why Is The Glow Plug Light Flashing In My VW & What Does It Indicate
Why Is The Glow Plug Light Flashing In My VW & What Does It IndicateWhy Is The Glow Plug Light Flashing In My VW & What Does It Indicate
Why Is The Glow Plug Light Flashing In My VW & What Does It Indicate
 
EV Charging Resources and Technical Assistance for Rural Communities and Trib...
EV Charging Resources and Technical Assistance for Rural Communities and Trib...EV Charging Resources and Technical Assistance for Rural Communities and Trib...
EV Charging Resources and Technical Assistance for Rural Communities and Trib...
 
AI for Smart Vehicles - A quick overview
AI for Smart Vehicles - A quick overviewAI for Smart Vehicles - A quick overview
AI for Smart Vehicles - A quick overview
 
Vina Score and Vin Min for almost all the models 2024
Vina Score and Vin Min for almost all the models 2024Vina Score and Vin Min for almost all the models 2024
Vina Score and Vin Min for almost all the models 2024
 
一比一定制加拿大新喀里多尼亚学院毕业证(UofL毕业证书)学位证书
一比一定制加拿大新喀里多尼亚学院毕业证(UofL毕业证书)学位证书一比一定制加拿大新喀里多尼亚学院毕业证(UofL毕业证书)学位证书
一比一定制加拿大新喀里多尼亚学院毕业证(UofL毕业证书)学位证书
 

thesis.docx

  • 1. CIVIL STATUS Based on this table represent the “CIVIL STATUS” of the respondents there are 4 single and 1 married in the year of 2011-2012 in the total of 5. And the year of 2012-2013 we have 2 single and 2 married in the total of 4. The year 2013-2014 they have 7 single and 1 single parent in total of 8. In the year of 2014-2015 they have 10 single and 1 married in the total of 11. The year 2015-2016there are 6 single and 0 married in the total of 6. The total of this year 2011-2016 is 34 respondents. Year Graduate Single Separated Single Parent Married Total 2011-2012 4 0 0 1 5 2012-2013 2 0 0 2 4 2013-2014 7 0 1 0 8 2014-2015 10 0 0 1 11 2015-2016 6 0 0 0 6 Total 29 0 1 4 34
  • 2. LOCATION Base on this table represent region of location of residence/place of work of BS-Business Administration Graduates year 2011-2016. The researcher found out that all of the respondents are located in municipality and all of their place of work is local. Year Graduate City Municipality TOTAL 2011-2012 0 5 5 2012-2013 0 4 4 2013-2014 0 8 8 2014-2015 0 11 11 2015-2016 0 6 6 Total 0 34 34
  • 3. SEX Year Graduate Female Male Total 2011-2012 2 4 6 2012-2013 2 1 3 2013-2014 7 1 8 2014-2015 8 3 11 2015-2016 6 0 6 Total 25 9 34 Based on this table represent the gender/sex distribution of the respondents BS-Business Administration Graduates year 2011- 2016. There are 2 female and 4 male in the year of 2011-2012 in the total of 6. In the year 2012-2013 has the lowest number of graduates, there are 2 female and 1 male in the total of 3. The year 2013-2014 there are 7 female and 1 male in the total of 8. In the year 2014-2015 has the highest number of graduates, there are 8 female and 3 male in the total of 11. And in the year 2015-2016 there are only 6 female.
  • 4. HOW LONG DID YOU STAY IN YOUR FIRST JOB? Year Graduate 2011- 2012 2012- 2013 2013- 2014 2014- 2015 2015- 2016 Total Less than a month 1 0 1 0 2 4 1 year to less than 2 years 0 0 2 2 3 7 1to 6 months 5 0 0 4 0 9 2 years to less than 3 years 0 2 3 1 0 6 7 to 11 months 0 0 0 1 1 2 3 years to less than 4 years 0 0 2 2 0 4 Other, please specify 0 1 0 1 0 2 Total 6 3 8 11 6 34
  • 5. WHAT WERE YOUR REASON(S) FOR STAYING THE JOB? Year Graduate 2011- 2012 2012- 2013 2013- 2014 2014- 2015 2015- 2016 Total Salaries& benefits 1 0 2 1 2 6 Career challenge 0 0 1 1 1 3 Related & Special skill 4 3 4 9 3 23 Proximity To Residence 0 0 0 0 0 0 Other Reason 1 0 1 0 0 2 Total 6 3 8 11 6 34 Based on thiS table represent the reason of the respondents why they are accepting the job. The researchers found out that in the year of 2011-2012 there are 1 who said that it is because of the salaries and benefits, 4 who said that it is because of the related and special skills, and 1 has another reason in a toatal of 6. In the year of 2012-2013 there are 2 who said that its because of the salaries and benefits, and 1 who said that its because of the career challenge in a total of 3. In the year of 2013-2014 there are 3 who said that its because of the salaries and benefits, 1 who said that its because of the career challenge, and 4 who said that it is because of the related and special skills in a total of 8. In the year of 2014-2015 there are 6 who said that it is because of the salaries and benefits, and 4 who said that its because of the related and special skills in a total of 10. And the year of 2015-2016 there are 2 who siad that its because
  • 6. of the salaries and benefits, 5 who said that it is because of the related and special skills in a total of 7. In the year of 2011-2016 there are 14 who said that it is because of salaries and benefits, 2 who said that it is because of the career chellenge, 17 who said that it is because of the related and specil skills and 1 who said that there’s another reason in a total of 34.
  • 7. WHAT WERE YOUR REASONS FOR ACCEPTING THE JOB? Year Graduate 2011- 2012 2012- 2013 2013- 2014 2014- 2015 2015- 2016 Total Salaries & Benefits 1 2 3 6 2 14 Career challenge 0 1 1 0 0 2 Related & special skiill 4 0 4 4 5 17 Proximity to residence 0 0 0 0 0 0 Other reason(s) pleas specify 1 0 0 0 0 1 TOTAL 6 3 8 10 7 34 Based on thi table represent the reason of the respondents why they are accepting the job. The researchers found out that in the year of 2011-2012 there are 1 who said that it is because of the salaries and benefits, 4 who said that it is because of the related and special skills, and 1 has another reason in a toatal of 6. In the year of 2012-2013 there are 2 who said that its because of the salaries and benefits, and 1 who said that its because of the career challenge in a total of 3. In the year of 2013-2014 there are 3 who said that its because of the salaries and benefits, 1 who said that its because of the career challenge, and 4 who said that it is because of the related and special skills in a total of 8. In the year of 2014-2015 there are 6 who said that it is because of the salaries and benefits, and 4 who
  • 8. said that its because of the related and special skills in a total of 10. And the year of 2015-2016 there are 2 who siad that its because of the salaries and benefits, 5 who said that it is because of the related and special skills in a total of 7. In the year of 2011-2016 there are 14 who said that it is because of salaries and benefits, 2 who said that it is because of the career chellenge, 17 who said that it is because of the related and specil skills and 1 who said that there’s another reason in a total of 34.
  • 9. MAJOR LINE OF BUSINESS OF THE COMPANY YOU ARE PRESENTLY EMPLOYED IN. Year Graduate 2011- 2012 2012- 2013 2013- 2014 2014- 2015 2015- 2016 TOTAL Agriculture, hunting and forestry 0 0 1 0 1 2 Fishing 0 0 0 0 0 0 Mining and Quarrying 0 0 0 0 0 0 Manufacturing 1 0 1 0 0 2 Electricity, gas and water supply 0 0 0 0 0 0 Construction 0 0 0 0 0 0 Wholesale and retail trade, repair of motor vehicles, motor cycle and personal and household goods 2 2 0 2 1 7 Hotels and restaurants 0 0 0 0 0 0 Transport storage and communication 0 0 0 3 1 4 Financial intermediation 3 0 6 2 0 11 Real state, renting and business activities 0 0 0 0 0 0 Public administration and defense; compulsory social security 0 1 0 1 2 4 Education 0 0 0 0 0 0 Health and social work 0 1 0 1 0 2 Other community, social and personal service activities 0 0 1 0 0 1
  • 10. Private households with employed persons 0 0 0 0 1 1 Extra territorial organizations and bodies 0 0 0 0 0 0 TOTAL 6 4 9 9 6 34
  • 11. WHAT IS YOUR INITIAL GROSS MONTHLY EARNING IN YOUR FIRST JOB? Based on this table represent the initial gross income of monthly earnings of BS- business administration graduates SY 2011-2016. The researchers found out below 5,000.00 in 2011-2012 they have 1.in there we have a 1 in 15,000.00 to less than 10,000.00 in then we have 3 on 5,000.00 to less than 10,000.00 and they we have 1 in 10,000.00n to less than 15,000.00 the total of 6 respondents into 2011-2012 Year Graduate 2011-2012 2012-2013 2013-2014 2014-2015 2015-2016 Total Below P5,000.00 1 0 2 0 1 4 P15,000.00 To less than P10,000.00 1 1 1 2 0 5 P5,000.00 To less than P10,000.00 3 0 4 6 3 16 P20,000.00 to less than P25,000.00 0 1 0 0 0 1 P10,000.00 to less than P15,000.00 1 1 1 3 2 8 P25,000.00 and above 0 0 0 0 0 0 Total 6 3 8 11 6 34
  • 12. HOW LONG DID IT TAKE YOU TO LAND YOUR FIRST JOB? Year Graduate 2011- 2012 2012- 2013 2013- 2014 2014- 2015 2015- 2016 Total Less than a month 1 1 3 4 3 12 1 year to less than 2 years 0 0 0 1 1 2 1to 6 months 5 1 4 6 1 17 2 years to less than 3 years 0 1 1 0 0 2 7 to 11 months 0 0 0 0 1 1 3 years to less than 4 years 0 0 0 0 0 0 Other. 0 0 0 0 0 0 Total 6 3 8 11 6 34
  • 13. HOW DID YOU FIND YOUR FIRST JOB? Year Graduate 2011- 2012 2012- 2013 2013- 2014 2014- 2015 2015- 2016 Total Response to an advertisement 0 0 0 0 0 0 Arranged by school’s job placement officer 0 0 0 0 0 0 As-walk-in applicant 4 1 5 9 5 24 Family business 0 0 0 1 0 1 Recommended by someone 1 2 3 1 1 8 Job fair or public employment service office (PESO) 0 0 0 0 0 0 Information from friends 1 0 0 0 0 1 Other, please specify 0 0 0 0 0 0 TOTAL 6 3 8 11 6 34 Based on this table shown how respondents find their job? The researcher found out that in the year of 2011-2012 there are 4 who said that it is because as walk-in applicant, 1 said that its because he/she recommended by someone, and 1 said that it is because of the information from his/her friends in a total of 6. In the year
  • 14. WAS THE CURRICULUM YOU HAD IN COLLEGE RELEVANT TO YOUR FIRST JOB? Year Graduate YES NO TOTAL 2011-2012 5 1 6 2012-2013 3 0 3 2013-2014 7 1 8 2014-2015 9 2 11 2015-2016 4 2 7 TOTAL 28 6 34 Based on this table shown if the course of respondents they took up in college are related to their job. The researcher found out that in the year 2011-2012 there are 5 respondents who said YES and 1 who said NO in a total of 6. In the year 2012-2013 there are only 3 who siad YES. In the year 2013-2014 there are 7 who said YES and there are 1 who said NO in a total of 8. In the year 2014-2015 there are 7 who said YES and there are 4 who said NO in a total of 11. And in the year 20-15-2016 there are 6 who said YES. And when we will add all in all there are 28 who sais YES and there are 6 who said NO in a total of 34 in the year of 2011-2016
  • 15. IF YES, WHAT COMPETENCIES LEARNED IN COLLEGE DID YOU FIND VERY USEFUL IN YOUR FIRST JOB? Year Graduate 2011- 2012 2012- 2013 2013- 2014 2014- 2015 2015- 2016 Total Communication skills 0 0 0 2 0 2 Human relation skills 6 3 8 6 6 29 Entrepreneural skills 0 0 0 1 0 1 Information technology skills 0 0 0 2 0 2 Problem- solving skills 0 0 0 0 0 0 Critical thinking skills 0 0 0 0 0 0 Others, please specify 0 0 0 0 0 0 TOTAL 6 3 8 11 6 34
  • 16. Chapter 3 Interpretation of Data This chapter deals with the interpretation of data in conjunction to the problems of study is seeks to answer. Number of Graduates For the academic years covered by this study SY 2011- 2016, which is six (6) years, the aggregate total of graduate is 34 distributed as shown in the table: Course YEAR Total Per Course 2011- 2012 2012- 2013 2013- 2014 2014- 2015 2015- 2016 BS Business Administr ation 5 4 8 11 6 34 TOTAL 5 4 8 11 6 34 The respondents to the GTS were thirty four (34) BSBA Graduates. Data shows that the year of 2014-2015 is the highest numbers of graduates.
  • 17. Table 1 Total Number of Respondents BSBA Graduates 2011-2014 Course YEAR Total % Distribution 2011- 2012 2012- 2013 2013- 2014 2014- 2015 2015- 2016 BS Business Administration 5 4 8 11 6 34 100% Total/Year 5 4 8 11 6 34 100% Based on this table represent the total number of respondents. There are 5 graduates for the SY 2011-2012, 4 graduates for the SY 2012-2013, 8 graduates for the SY 2013- 2014, 11 graduates for the SY 2014-2015, and 6 graduates for the SY 2015-2016 in the total of 34 graduates.
  • 18. IS THIS YOUR FIRST JOB AFTER COLLEGE? YEAR Graduate 2011- 2012 2012- 2013 2013- 2014 2014- 2015 2015- 2016 TOTAL Yes 3 3 3 7 1 17 No 3 0 5 4 5 17 TOTAL 6 3 8 11 6 34 . Based on this table represent the first job after college. to first job year graduate of 2011-2016. The researchers found out that tere are 3 respondents who said YES and there 3 who said NO of the year 2011-2012 in a total of 6. And there are 3 who said YES of the year of 2012-2013. In the year 2013-2014 there are 3 who said YES and there are 5 who said NO in a total of 8. There are 7 who said YES and there are 4 who said NO in the year of 2014-2015 in a total of 11. There’s 1 who said YES and there are 5 who said NO in the year of 2015- 2016 in a total of 6. And in the year 2011-2016 there are 17 who said YES and there are also 17 who said NO in the total of 34.
  • 19. PRESENT EMPLOYMENT STATUS Year Graduate 2011- 2012 2012- 2013 2013- 2014 2014- 2015 2015- 2016 TOTAL Regular 3 3 6 6 2 20 Contractual 1 0 2 3 2 8 Temporary 2 0 0 1 2 5 Self- employment 0 0 0 1 0 1 Casual 0 0 0 0 0 0 TOTAL 6 3 8 11 6 34 Based on this table represents the employment status of BS -Business Administration Graduates Year 2011-2016. The researchers found out that in the year 2011-2012 there are 3 in the regular/permanent, 1 in the contractual, 2 in the temporary in the total of 6. In the year 2012-2013 there are only 3 in the regular/ permanent. In the year 2013-2014 there are 6 in the regular/permanent, 2 in the contractual 1 in the temporary the same as the self-employed in the total of 8. In the year 2014- 2015 there are 6 in the regular/permanent, 3 in the contractual, 1 in the temporary and 1 in the self-employed in the total of
  • 20. 11. And in the year 2015-2016 there are 2 in the regular/permanent, 2 in the contractual and 2 in the temporary in the total of 6. In the year 2011-2016 there are 20 in the regular/ permanent, 8 in the contractual, 5 in the temporary and 1 in self-employed in the total of 34. ARE YOU EMPLOYED? Year Graduate 2011- 2012 2012- 2013 2013- 2014 2014- 2015 2015- 2016 TOTAL YES 4 4 7 8 5 28 NO 1 0 1 3 1 6 TOTAL 5 4 8 11 6 34 Base on this table for that are you employed or not. In the SY 2011-2012 there are 4 yes and 1 no, for the SY 2012-2013 there are 4 yes and o no, for the SY 2013-2014 there are 7 yes and 1 no, for the SY 2014-2015 there are 8 yes and 3 no, and for the SY 2015-2016 there are 5 yes and 1 no and the total of yes is 28band no is 6 in the total of 34.
  • 21. PLACE OF WORK Year Graduate 2011- 2012 2012- 2013 2013- 2014 2014- 2015 2015- 2016 TOTAL Local 5 4 8 11 5 33 Abroad 0 0 0 0 1 1 TOTAL 5 4 8 11 6 34 Based on this represent of resident place of work of bachelor of science in business administration graduates year 2011-2016. The researcher found out that all of the respondents are located in abroad and all of place of work.
  • 22. IS YOUR FIRST JOB RELATED TO THE COURSE YOU TOOK UP IN COLLEGE? Year Graduate YES NO TOTAL 2011-2012 5 1 6 2012-2013 3 0 3 2013-2014 7 1 8 2014-2015 7 4 11 2015-2016 6 0 6 TOTAL 28 6 34 Based on this table represent that the course of respondents they took up in college are related to their job. The researcher found out that in the year 2011-2012 there are 5 respondents who said YES and 1 who said NO in a total of 6. In the year 2012-2013 there are only 3 who siad YES. In the year 2013-2014 there are 7 who said YES and there are 1 who said NO in a total of 8. In the year 2014-2015 there are 7 who said YES and there are 4 who said NO in a total of 11. And in the year 20-15-2016 there are 6 who said YES. And when we will add all in
  • 23. all there are 28 who sais YES and there are 6 who said NO in a total of 34 in the year of 2011-2016.