Outlook for Week of July 10, 2023
•
0 likes•229 views

Free weekly newsletter with outlook and brief comments for world stock markets. Weekly reversal levels for stocks, gold, crypto currencies and forex. This method was designed to keep you on the right side of the market most of the time, letting the winners run while keeping losses small.

Recommended
Recommended
More Related Content
More from LunaticTrader
More from LunaticTrader (17)
Recently uploaded
Recently uploaded (20)
Outlook for Week of July 10, 2023
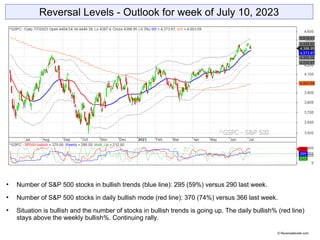
- 1. Reversal Levels - Outlook for week of July 10, 2023 Number of S&P 500 stocks in bullish trends (blue line): 295 (59%) versus 290 last week. Number of S&P 500 stocks in daily bullish mode (red line): 370 (74%) versus 366 last week. Situation is bullish and the number of stocks in bullish trends is going up. The daily bullish% (red line) stays above the weekly bullish%. Continuing rally. © Reversallevels.com
- 2. ELC: up | BMO: up | Blue snake: up | Repellor: up Indicators keep pointing up and the rally continues. BMO is starting to reach higher regions, which means a correction or significant pause becomes more likely. © Reversallevels.com S&P 500 Weekly chart
- 3. SwX is green - bullish. Weekly MoM is going up. The bull market is on as long as that red channel stays on. © Reversallevels.com S&P 500 - Weekly
- 4. SwX is green – bullish, but slowing down. Weekly MoM keeps going down. Weekly MoM testing the zero line with the $1900 level is still holding. © Reversallevels.com Gold - Weekly
- 5. SwX is green - bullish. Weekly MoM is going up. Looks like a bullish continuation, but the $30k level is still offering resistance. © Reversallevels.com Bitcoin - Weekly
- 6. Sell signal for France CAC40 and Switzerland SMI. Bullish divergence for Malaysia KLCI and Dow Utilities. Partial profits signal for India SENSEX. Argentina Merval is our current best performer. It is up 300% since its Buy signal 52 weeks ago. World markets © Reversallevels.com
- 7. Partial profits signal for USDCNY. Note for daytraders or swing traders: if you do your trading in the direction of the weekly trend you are likely to do well in the long run. So, try to buy the pullbacks in currencies pairs that are in bullish trends and sell the rallies during bearish trends. Forex & Crypto © Reversallevels.com
- 8. On Twitter: https://twitter.com/lunatictrader1 On Stocktwits: https://stocktwits.com/LunaticTrader Blog 1: Reversallevels.com Blog 2: LunaticTrader.com For daily comments and questions you can find us here: © Reversallevels.com Disclaimer Investing in stocks, forex or commodities is risky. No guarantee can be given that the opinions or predictions given in this presentation will be correct. Reversallevels.com cannot in any way be responsible for eventual losses you may incur if you trade based on the given information. Simulated trading programs in general are designed with the benefit of hindsight. No representation is being made that any account will or is likely to achieve profits or losses similar to those shown. Trade at your own risk and responsibility. Subscription service Daily reversal levels for over 3000 stocks and ETFs are available for subscribers. Our method shows you how to become a more efficient investor: 1 Month ($22) 6 Months ($110) 1 Year ($199) Comes with instructions and strategies for using the reversal levels and MoM indicator in your own trading. Example trades and mentoring. This is an honest method with limited risk, not a get rich quick formula. Give it a try.