1. Is Nanoceria the Building Block of the Future?
By Luke Moore, lm464
Year: 2015/2016
Subject: Physics
University of Kent, Canterbury
Supervisor: Dr. Dean Sayle
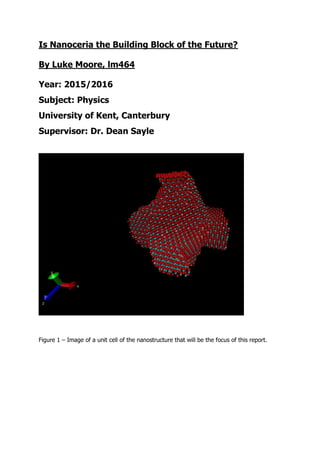
Figure 1 – Image of a unit cell of the nanostructure that will be the focus of this report.
2. Luke Moore, lm464 PH700, Physics, MPhys
1
Abstract
Nanoceria is a material which has seen widespread usage in many different areas of science
in recent years, this is because it has a wide variety of potential uses from catalysis to
Biomedicine. An area which has not been as extensively investigated is the mechanical
strength of nanoceria structures. This project has investigated the effect of; increasing the
number of atoms in a structure, vacancies in the structure and irradiating the structure. To
determine what factors improve the mechanical strength of Ceria nanostructures. The results
were; increasing the number of atoms in the structure increases the mechanical strength of
the structure, the presence of vacancies in the structure decreases the mechanical strength
of the structure and irradiating the structure decreases the mechanical strength of the
structure.
Acknowledgements
I would like to take this opportunity to thank all of the people that assisted me with my work
on this project. Firstly, special thanks to my project supervisor Dr. Dean Sayle, without the
guidance of my supervisor the project would not have progressed as far as it has. Secondly,
thanks to my class mates that proof read my report and offered advice, most notable Hannah
Keogh.
4. Luke Moore, lm464 PH700, Physics, MPhys
3
Introduction, Background and Method
A simulation was run of the compression of a nanostructure made of a material known as
Ceria. A nanostructure is a structure which is a structure whose size is on the atomic scale,
the order of nanometres. Ceria is the more commonly used name of the substance cerium
oxide (CeO2). The material Nanoceria will be the primary focus of this report, the mechanical
strength of 4 different structures of nanoceria will be examined and will be discussed later in
this report. The mechanism of how the structures of nanoceria collapse will be analysed as
well, additionally the results of this project will then be discussed with respect to how they
could be applied to other work.
Figure 2: shows how the original nanoceria structure shown in the top left, deforms as a result
of increasing pressure, the size of the arrows has been used to indicate increasing levels of
pressure acting on the structure. Top left is the original structure before pressure is acting on
it. Top right is the structure with a small amount of pressure acting on it, not enough pressure
to permanently deform the structure. Bottom left is the structure when it has a level of
pressure acting on it such that it has now been deformed permanently. Bottom right is the
structure when it has a very high level of pressure acting on it, much more than was required
to deform it permanently, it has been flattened into a sheet of ions. The bottom right images
5. Luke Moore, lm464 PH700, Physics, MPhys
4
level of pressure is possibly an unphysical prediction, as the pressure is very high and new
physics may be involved in scenarios such as these.
Why is Nanoceria important/Interesting?
[1] “Nanoceria is an exceptionally versatile, commercially valuable catalytic material whose
properties vary dramatically from that of the bulk material. Nanoceria has redox properties,
the 2 oxidation states of the cerium element in the lattice make it possible to form oxygen
vacancies which are what help to give the material such high reactivity. It can also be used
as a catalyst in both oxidation and reduction reactions. Ceria has commercial utility in catalytic
converters and diesel oxidation catalysts, it could also be used in solid oxide fuel cells. It even
has prospects as a therapeutic agent for the treatment of certain human diseases“.
The reason nanoceria could be seeing use as a method of treating human diseases is [2]“many
disorders are associated with oxidative stress and inflammation, cerium oxide nanoparticles
may be a tool for the treatment of these pathologies”. In fact, [3] “cerium oxide (ceria) is
currently finding widespread use in the treatment of medical disorders caused by the reactive
oxygen intermediates (ROI). The radical-scavenging role of Ceria nanoparticles (nanoceria)
have been well established, as well as the autocatalytic ability of nanoceria to regenerate
under various environmental conditions”.
Nanoceria could also has a promising future in the next generation of catalytic converters, [4]
“the Ceria nanoparticles that were studied have much better performance, higher chemical
reactivity, than the bulk form of Ceria currently used in catalytic converters. Thus, this research
holds promise for more-efficient catalytic converters — and cleaner air.”
Nanostructures have also been seeing usage in an engineering context as well, [5] Carbon
nanotubes were used by “embedding them into Hydrogel sheets for the purpose of creating
cardiac patches which provide structural support to replace damaged heart tissue, the
resulting structures showed significantly improved mechanical integrity”. This shows that
nanostructures have a role to play in engineering applications as well
The main application being researched in this project is mechanical strength. The mechanical
strength of nanoceria will be measured by running a simulation of the compression of
nanoceria, this simulation will yield results on the pressure required to cause permanent
deformation of nanoceria, thereby giving an estimate of the mechanical strength of the
structure.
6. Luke Moore, lm464 PH700, Physics, MPhys
5
Crystal Defects
There are a number of different types of defect that naturally occur in real crystals, however
the only ones which will be discussed are the ones which are the most relevant to this project,
such as;
Schottky defects
Frenkel defects
Dislocations
Slip planes
[6] “Both Schottky and Frenkel defects are called equilibrium atomic defects, and are both
examples of inherent thermodynamic defects.
Diagram 1: This shows an example of Schottky defects
Diagram 1 shows an example of schottky defects for a lattice composed of a compound MX,
M+
and X-
ions. A Schottky defect consists of a vacant cation lattice site and a vacant anion
lattice site. Schottky defects arise effectively by ions leaving their normal lattice positions and
moving to somewhere else in the crystal. Vacant sites must occur equally to preserve the
overall electrical neutrality of the structure.
7. Luke Moore, lm464 PH700, Physics, MPhys
6
Diagram 2: This shows an example of Frenkel defects
Diagram 2 shows an example of Frenkel defects for a lattice composed of a compound MX,
M+
and X-
ions. A Frenkel defect consists of an interstitial ion and a vacant lattice site. Frenkel
defects are formed by ions leaving their normal lattice sites to take up interstitial positions.”
8. Luke Moore, lm464 PH700, Physics, MPhys
7
[7]
Diagram 3: This shows two images the top image shows a type of dislocation known as an
edge dislocation in terms of a cubic lattice, the dislocation lies along the line E-E’. Whereas
the lower image shows the same dislocation in terms of atom positions in the crystal. In fact,
the top image also indicates a slip plane, the plane indicated by PQRT is a slip plane over
which the top layer in the image is moving relative to the lower layer, this is what has caused
this dislocation in this specific case. [Pages 199, 200, [7]]
[Page 198 [7]] A slip plane can cause a dislocation this happens because all the atoms above
the slip plane do not move simultaneously over the atoms below the slip plane. At any given
time some of the atoms have moved into their new positions while others have not yet done
so and the displacement of the upper block in the top image of diagram 3 relative to the lower
9. Luke Moore, lm464 PH700, Physics, MPhys
8
block varies from one region to another. Lines in the crystal separating regions where slip has
occurred from those where it has not are called dislocations.
Interactions between the ions
There are forces acting between ions in the structure which need to be taken into account in
the simulation. These forces are electrostatic forces and gravitational forces. However, the
only forces being taken into account in the simulation are electrostatic forces. It has been
assumed that the gravitational forces are negligible in comparison with the electrostatic forces
acting between the ions.
Equation 1
The Gravitational force acting between two bodies is given by;
𝐹 =
𝐺𝑚𝑀
𝑟2
Where G = the gravitational constant in Nm2
kg-2
, m = mass of body 1 in kg, M =mass of body
2 in kg, r = distance between the centres of 2 bodies in m, F = force of gravity acting between
the 2 bodies in N
G = 6.673 x 10⁻¹¹
Nm2
kg-2
Equation 2
The Electrostatic force acting between two bodies is given by;
𝐹 =
𝑞𝑄
4𝜋𝜀𝑟2
Where F = electrostatic force acting between the two bodies, in N, q = electric charge of body
1 in C, Q = electric charge of body 2 in C, r = distance between the centres of the two bodies
in m, ε = Electric constant
ε = 8.854 x 10⁻¹²
C2
N-1
m-2
Equation 3
The electrostatic interaction energy between ions is given by the equation;
𝐸 = −
𝑞𝑄
4𝜋𝜀𝑟
Where E = interaction energy, J, q = electric charge of body 1 in C, Q = electric charge of
body 2 in C, r = distance between the centres of the two bodies in m, ε = Electric constant
10. Luke Moore, lm464 PH700, Physics, MPhys
9
ε = 8.854 x 10⁻¹²
C2
N-1
m-2
To demonstrate why the gravitational forces have been neglected the following calculation
will be performed using both formulas to show that the electrostatic forces are far stronger
than the gravitational forces.
Consider 2 cerium 4+ ions
Mass of Cerium = 140.116 atomic mass units = 2.327 x 10⁻²⁵
kg
Change of Cerium 4+ = + 4e
e = 1.602 x 10⁻¹⁹
C
The value of r is approximately 10-10
m
Force of Gravity acting between 2 cerium ions
F = 2.64 x 10-41
N
Electrostatic force acting between 2 cerium ions
F = 2.70 x 10⁻⁸
N
The electrostatic forces acting between the ions are of the order of 1033
x larger than the
gravitational forces acting between the same two ions over the same distance. Therefore the
gravitational forces have been neglected, as they have very little influence in comparison with
the electrostatic forces acting within the system.
Equation 4
The potential energy involved in the interaction between two ions is given by the Leonard-
Jones Potential, this is an equation which describes the interaction between ions.
𝑉(𝑟) =
𝐴
𝑟12
−
𝐵
𝑟6
Where A and B are constants.
The graph of equation 9 looks like the image below. Where the equilibrium separation distance
r0 between ions is the value r takes when the potential energy between the ions is at its
minimum value, illustrated on the image below.
11. Luke Moore, lm464 PH700, Physics, MPhys
10
[8]http://chemwiki.ucdavis.edu/Core/Physical_Chemistry/Physical_Properties_of_Matter/Ato
mic_and_Molecular_Properties/Intermolecular_Forces/Specific_Interactions/Lennard-
Jones_Potential
Diagram 4: This shows the Leonard-Jones inter-ionic potential energy curve
Ions in a structure will naturally tend to separate themselves by the distance which minimizes
the intermolecular potential energy of the structure, thereby maximizing the stability of the
structure. In a compression the pressure acting on the structure is forcing the ions to move
closer together, closer than the equilibrium distance which is shown in the diagram above.
This smaller separation distance results in a repulsive interaction between neighbouring ions
in the structure. This causes the intermolecular potential energy of the structure to increase,
making this particular arrangement of ions less energetically favourable, and therefore less
stable. This continues until a critical point is reached at which the intermolecular potential
energy for the ions to remain in this specific arrangement is too large to maintain the
arrangement. The structure then undergoes a deformation to initiate a collapse of the
structure, allowing the ions to arrange themselves into a more energetically favourable
configuration, thereby reducing the intermolecular potential energy of the structure.
12. Luke Moore, lm464 PH700, Physics, MPhys
11
The Simulation
The simulation works on principles of Classical Mechanics, it uses formulae which apply to the
motion of physical, everyday objects, such as Tennis balls for example. The simulation
calculates the position of ions in the structure by using the pressure acting on the structure
to determine forces acting on individual particles and calculate their resulting trajectory from
there. Classical mechanics is valid only when the system is large, for small systems such as
the one being researched in this project it would not necessarily be valid. However, this system
is composed of ions and ions do not behave in exactly the same way as objects such as Tennis
balls. For things the size of ions and smaller to be represented correctly by a simulation
quantum mechanics must be taken into account. The reason for this is that particles can
exhibit wave like properties such as diffraction when placed under certain conditions. [Page
1174, [9]] “If the wavelength of a particle is small when compared to the distances from the
edges of objects diffraction effects are negligible”. However when the wavelength is longer,
comparable to the distance from the edges of objects then these diffraction effects are not
negligible, they become quite significant.
It will now be demonstrated that this produces a potential source of error in the simulation.
For QM to be necessary the wavelength of ions must be approximately equal to the distance
between ions;
De Broglie wavelength equation: 𝜆 =
ℎ
𝑝
Equation 5
Where λ = wavelength of particle in m, p = momentum of particle in kgms-1
and h = 6.626 x
10-34
Js = Planck’s constant
Average Kinetic energy of an ion: 𝐾. 𝐸 =
1
2
𝑚𝑣2
=
3
2
𝑘 𝐵 𝑇 Equation 6
Where K.E = Average Kinetic Energy of particle in J, m = mass of particle in kg, v = velocity
of particle in ms-1
, T = temperature of system in Kelvin and KB = Boltzmann’s constant =
1.3807 x 10⁻²³
JK-1
Assume inter-ionic distance is of the order of 1 ion size, approximately 10-10
m
Temperature approximately equal to 300 Kelvin (room temperature)
Rearrange Equation 6 to determine an equation for the Average velocity of ions
Equation 7
13. Luke Moore, lm464 PH700, Physics, MPhys
12
𝑉 = √
3𝐾 𝐵 𝑇
𝑚
Equation 8
𝑃 = 𝑚𝑉
Substitute Equation 7 into Equation 8
𝑃 = √3𝐾 𝐵 𝑇𝑚
P = Average Momentum
This is Equation 9
Substitute Equation 9 into Equation 7 to get Equation 10
𝜆 =
ℎ
√3𝐾 𝐵 𝑇𝑚
This is equation 10
T = 300 K
KB = 1.3807 x 10⁻²³
JK-1
h = 6.626 x 10⁻³⁴
Js
1 atomic mass unit = 1.6605 x 10⁻²⁷
kg
Mass of Oxygen = 15.994 atomic mass units = 2.657 x 10⁻²⁶
kg
Mass of Cerium = 140.116 atomic mass units = 2.327 x 10⁻²⁵
kg
Using Equation 6 and these values, the wavelength of cerium and oxygen can be determined
Wavelength of Oxygen = 3.65 x 10⁻¹¹
m
Wavelength of Cerium = 1.23 x 10⁻¹¹
m
Wavelength of ions in the structure at this temperature is approximately 10-11
m
Inter-ionic distance approximately 10-10
m
Therefore wavelength is approximately 1/10th
the inter-ionic distance
The wavelength and inter-ionic distances being this close together would suggest that
Quantum mechanical effects would be occurring at this temperature, this would result in errors
14. Luke Moore, lm464 PH700, Physics, MPhys
13
in the simulation which is based solely on classical mechanics. However, the reason the
simulation does not incorporate quantum mechanics is that if quantum mechanics is used in
the simulation then the computational work involved with the simulation increases by a very
large amount, in fact when the simulation takes into account quantum mechanical effects the
system size must be very small to compensate for this. Classical mechanics can simulate
thousands of ions whereas, if quantum mechanics were involved the system size would be
orders of magnitude smaller, current supercomputers do not have the computing power
necessary to calculate all the quantum effects in a system the size of the one researched in
this project. So, in order to simulate a large number of ions in the structure classical mechanics
was used and quantum mechanics was neglected.
The simulation uses a computational model of nanoceria as a starting point, a program was
then run on a supercomputer which takes this model and then applies increasing pressure to
it. The program works using classical physics, only electrostatic interactions are used in the
calculations of the molecular dynamics resulting from increasing the pressure acting on the
structure.
The value of the electrostatic interaction between an ion and all the other ions in the structure
is calculated by the supercomputer, however, it cannot simply use equation 3 to sum the
interaction energy between every ion in the structure as there are thousands of ions in the
structure, even for a supercomputer this work load is far too large. So an approximation is
required, this approximation is called the Ewald summation. The Ewald summation is an
approximation used in computational molecular dynamics simulations to calculate the value
of long range interactions such as the electrostatic interaction. The Ewald summation works
in the following way, it does calculate the interaction using equation 3 to sum between ions
up to a certain distance, but once this distance is reached it stops and approximates the rest
of the structure by a constant.
So, basically this is a rough idea of what the Ewald summation does
𝐸 = − (
𝑞𝑄
4𝜋𝜀𝑟
)
Where r is the distance between an ion and any other ion within a distance of R, where R is
the specified cut off radius of the ewald summations use of equation 3. Once the summation
between all ions within this radius using equation 3 is complete, a constant is then added to
this value which then gives an approximation of the value of the interaction energy you would
expect to get if you had used equation 3 to sum over the entire structure.
15. Luke Moore, lm464 PH700, Physics, MPhys
14
The compression starts with zero pressure then increases the pressure exerted on the
structure in small increments and computes the resultant motion of the ions in the model for
a short time after each increment in pressure. Once the resultant motion from each increment
is calculated the model is then saved to be the starting point for the next pressure increment.
Then the pressure is increased by a small increment and the resultant motion is computed
once again. This cycle repeats until the pressure reaches a certain stopping value which is
well above the pressure required for mechanical failure.
After each step in the compression certain values are recorded by the supercomputer, such
as the pressure, the strain on the structure in the direction of the x, y and z coordinate axes
as well as many others. However, the main focus of this project was on the pressure acting
on the structure and the strain acting on the structure. These two values were then plotted
on a graph in order to get an idea of the dependence of the strain on the structure with
respect to the stress (pressure) acting on the structure.
The stress vs. strain graphs were then used to find the Young’s modulus of the structures.
The Stress vs. Strain graphs of the compression were expected to indicate a linear dependence
for low values of the strain and then a non-linear dependence for larger strains. This
assumption about the appearance of the stress vs. strain relationship is based on Hooke’s law.
[10]“Hooke’s law of elasticity states that, for relatively small deformations of an object,
the displacement or size of the deformation is directly proportional to the deforming force or
load. Mathematically, Hooke’s law states that the applied force F equals a constant k multiplied
by the displacement or change in length x, or F = kx. The value of k depends not only on the
kind of elastic material under consideration but also on its dimensions and shape”. The value
of k in the mathematical expression for Hooke’s law is the Young’s modulus of the material,
this is the main value of interest and it will be determined from the stress vs. strain graphs of
each of the structures being evaluated.
4 different structures will be analysed in this project; the first structure is composed of
approximately 16,000 ions and is pure ceria, cerium Ce4+
ions in a regular arrangement with
oxygen O2-
ions to form a lattice which can then be used in the compression program. The
second structure is the 16,000 ion structure of Ceria but with a certain % of oxygen vacancies
in the lattice. Naturally occurring Ceria has oxygen vacancies in the lattice and this results in
the presence of some ions of Ce3+
in the structure as well as the Ce4+
which is the more
common cerium ion present in the structure. The presence of Ce3+
ions in this structure means
that this is the most like real Ceria nanostructures. The reason why the presence of oxygen
vacancies results in ions of Ce3+
being present in the lattice, as opposed to only Ce4+
being
16. Luke Moore, lm464 PH700, Physics, MPhys
15
present in the lattice is that the structure as a whole must be electrically neutral. Therefore if
an O2-
ion is vacant the overall structure will be slightly positively charged with a positive 2+
charge, therefore one O2-
being vacant results in 2 Ce4+
ions becoming Ce3+
this re-balances
the charge of the structure and means that the structure is electrically neutral. The third
structure is composed of approximately 64,000 ions and is pure ceria, cerium Ce4+
ions in a
regular arrangement with oxygen O2-
ions to form a lattice which can then be used in the
compression program. The fourth structure is composed of approximately 64,000 ions and is
pure ceria, cerium Ce4+
ions in a regular arrangement with oxygen O2-
ions to form a lattice,
however, this structure has been irradiated prior to the compression. The fourth structure was
irradiated so the effect of irradiation on the strength of the structure can be determined.
The irradiation was modelled by imparting a large velocity to a random ion in the structure,
this ion then moves at high velocity to disrupt the structure. This models a photon of radiation
by using an ion moving in a random direction, with the same energy as that photon would
have. One reason why this method may not be an accurate representation of an irradiation is
that a photon of radiation has no mass, whereas an ion does. The ion has a greater momentum
than the photon of radiation would have. This fast moving ion then transfers more momentum
to different ions within the structure than would be expected from an actual irradiation. This
would result in a higher level of disruption to the ions within the structure, than a single
photon of radiation would.
Assume Energy of photon = Energy of ion
Assume Energy corresponds to X-ray photon Energy approximately 20keV, Frequency of this
photon is approximately 4.8 x 10¹⁸
Hz, wavelength of this photon is approximately 6.3 x 10-
11
m
Assume mass of ion = mass of a cerium ion = 2.3 x 10⁻²⁵
kg
Energy of photon is given by equation 11;
𝐸 = ℎ𝑓
Where h = Planck’s constant = 6.626 x 10⁻³⁴
Js and f = frequency of the photon of radiation
in Hz, E = energy of photon in J
Energy of ion is given by equation 12;
𝐸 =
1
2
𝑚𝑣2
=
𝑃𝑖𝑜𝑛
2
2𝑚
17. Luke Moore, lm464 PH700, Physics, MPhys
16
Where E = energy of ion in J, m = mass of ion in kg, v = velocity of ion in ms-1
, p = momentum
of ion in kgms-1
Momentum of photon is given by equation 13;
𝑃𝑝ℎ𝑜𝑡𝑜𝑛 =
ℎ
𝜆
=
ℎ𝑓
𝑐
Where p = momentum of photon in kgms-1
, h = Planck’s constant = 6.626 x 10⁻³⁴
Js, λ =
wavelength in m, f = frequency of photon in Hz and c = the speed of light = 3 x 10⁸
ms-1
Using these equations and the values stated above Pion is approximately equal to 3.8 x 10⁻²⁰
kgms-1
Whereas, Pphoton is approximately equal to 1.1 x 10⁻²³
kgms-1
.
Therefore if the simulation was used to approximate an X-ray of energy 20keV, then there
would be a difference in momentum of a factor of 103
. This would lead to a significant source
of inaccuracy in the simulation of the irradiation.
After the graphs had been plotted an effort was made to examine the mechanism of the
collapse of the structures in greater detail, as how the structures undergo the collapse could
give important information regarding what properties of the structure may be affected as a
result of the pressure acting on the structure. This was done by viewing the collapse using
molecular dynamics simulators such as VMD and Materials Studio.
18. Luke Moore, lm464 PH700, Physics, MPhys
17
Results, Analysis and Discussion
The line graphs for each individual line can be found in the Appendix section, Graphs 6 - 15.
Graph 1 – This graph shows how the compression of the 16,000 ion structure with no oxygen
vacancies in the lattice varies as the pressure acting on the structure is increased.
An approximate average of the linear section of each of the three lines for the compression in
the x, y and z directions is displayed on the graph. This is an approximate line, however a
computer was used to analyse the gradient of the linear section of each of the lines. Each of
the lines displayed on this graph except for the average gradient line, took 1 week to calculate
on a supercomputer. The value of the average gradient for the 16,000 ion structure with no
oxygen vacancies was approximately, -54 GPa. This is the Young’s modulus of the structure
and provides a measure of the strength of the structure under compression. The graph shows
that the structure deforms elastically until a strain of approximately 6 - 7% is reached. When
this level of strain is experienced by the structure the elastic limit of the structure has been
reached, this is the point at which the structure will begin undergoing plastic deformation.
This is a permanent deformation of the structure and the structure will not return to its original
shape when the pressure is no longer acting on the structure.
0
0.5
1
1.5
2
2.5
3
3.5
4
-0.08 -0.07 -0.06 -0.05 -0.04 -0.03 -0.02 -0.01 0
Pressure(GPa)
Compression (%/100)
16,000 pure (x,y,z)
19. Luke Moore, lm464 PH700, Physics, MPhys
18
Graph 2 – This graph shows how the compression of the 16,000 ion structure with oxygen
vacancies in the lattice varies as the pressure acting on the structure is increased.
An approximate average of the linear section of each of the three lines for the compression in
the x, y and z directions is displayed on the graph. This is an approximate line, however a
computer was used to analyse the gradient of the linear section of each of the lines. Each of
the lines displayed on this graph except for the average gradient line, took 1 week to calculate
on a supercomputer. The value of the average gradient for the 16,000 ion structure with
oxygen vacancies was approximately, -45 GPa. This is the Young’s modulus of the structure
and provides a measure of the strength of the structure under compression. The graph shows
that the structure deforms elastically until a strain of approximately 5 - 6% is reached. When
this level of strain is experienced by the structure the elastic limit of the structure has been
reached, this is the point at which the structure will begin undergoing plastic deformation.
This is a permanent deformation of the structure and the structure will not return to its original
shape when the pressure is no longer acting on the structure.
0
0.5
1
1.5
2
2.5
3
3.5
4
-0.08 -0.07 -0.06 -0.05 -0.04 -0.03 -0.02 -0.01 0
Pressure(GPa)
compression (%/100)
16,000 o vac (x,y,z)
20. Luke Moore, lm464 PH700, Physics, MPhys
19
Graph 3 – This graph shows how the compression of the 64,000 ion structure with no oxygen
vacancies in the lattice varies as the pressure acting on the structure is increased.
An approximate average of the linear section of each of the three lines for the compression in
the x, y and z directions is displayed on the graph. This is an approximate line, however a
computer was used to analyse the gradient of the linear section of each of the lines. Each of
the lines displayed on this graph except for the average gradient line, took 1 week to calculate
on a supercomputer. The value of the average gradient for the 64,000 ion structure with no
oxygen vacancies was approximately, -70 GPa. This is the Young’s modulus of the structure
and provides a measure of the strength of the structure under compression. The graph shows
that the structure deforms elastically until a strain of approximately 7% is reached. When this
level of strain is experienced by the structure the elastic limit of the structure has been
reached, this is the point at which the structure will begin undergoing plastic deformation.
This is a permanent deformation of the structure and the structure will not return to its original
shape when the pressure is no longer acting on the structure.
0
1
2
3
4
5
-0.08 -0.07 -0.06 -0.05 -0.04 -0.03 -0.02 -0.01 0
Pressure(GPa)
Compression (%/100)
64,000 pure (x,y,z)
21. Luke Moore, lm464 PH700, Physics, MPhys
20
Graph 4 – This graph shows how the compression of the irradiated 64,000 ion structure with
no oxygen vacancies in the lattice varies as the pressure acting on the structure is increased.
A line showing an approximation to the linear section of the graph is shown on the graph.
This line took 1 week to calculate on a supercomputer. The value of the gradient of the linear
section of the line for the irradiated 64,000 ion structure with no oxygen vacancies was
approximately, -38 GPa. This is the Young’s modulus of the structure and provides a measure
of the strength of the structure under compression. The graph shows that the structure
deforms elastically until a strain of approximately 5% is reached. When this level of strain is
experienced by the structure the elastic limit of the structure has been reached, this is the
point at which the structure will begin undergoing plastic deformation. This is a permanent
deformation of the structure and the structure will not return to its original shape when the
pressure is no longer acting on the structure.
0
0.5
1
1.5
2
2.5
3
-0.08 -0.07 -0.06 -0.05 -0.04 -0.03 -0.02 -0.01 0
Pressure(GPa)
Compression (%/100)
64,000 irradiated x
22. Luke Moore, lm464 PH700, Physics, MPhys
21
Graph 5 – This graph shows the average graphs for each of the 4 data sets; 64,000 irradiated
structure, 64,000 pure structure, 16,000 pure structure and 16,000 with oxygen vacancies.
This graph displays the data from graphs 1-4, in a more qualitative way, so it is easier to
compare the strengths of the structures with one another. The steeper the gradient, the
stronger the structure. This shows that irradiating a structure weakens it considerably, as it
was the weakest structure of them all. It also shows that vacancies in a structure weakens
the structure as well. Additionally, the final thing this graph shows is that increasing the size
of the structure while maintaining the same shape, increases the strength of the structure. All
the structures had an elastic limit corresponding to a strain of between 5 and 7%. The
structure with the highest strain corresponding to the elastic limit was the 64,000 ion structure
with no oxygen vacancies. Whereas, the structure with the lowest strain corresponding to the
elastic limit was the irradiated 64,000 ion structure with no oxygen vacancies. Additionally,
the 16,000 ion structure with no oxygen vacancies showed an elastic limit corresponding to a
strain of between 6 and 7%. Whereas, the 16,000 ion structure with oxygen vacancies showed
a strain corresponding to the elastic limit of between 5 and 6%. This shows that by introducing
vacancies or radiation to these structures the maximum strain they are able to experience
before deforming plastically is greatly reduced. The relative reduction in strain associated with
introducing vacancies into the structure is approximately 15%, whereas the reduction in strain
associated with introducing radiation is approximately 30%. The reason for radiation having
a greater effect on both the Young’s modulus and the maximum strain before plastic
deformation occurs may be due to how the irradiation of the structure was modelled. The
irradiation was modelled by imparting a large velocity to a random ion in the structure. This
Comparison of gradients of each of the average graphs
64,000 irradiated
16,000 pure
16,000 o vac
64,000 pure
23. Luke Moore, lm464 PH700, Physics, MPhys
22
fast moving ion then moves through the structure transferring momentum to ions within the
structure as it moves, this causes a disruption to the ordered arrangement of ions. However,
this disruption is greater than would be expected from an actual photon of radiation. Leading
to a source of inaccuracy in the simulation. An actual irradiation may not be as damaging to
the structure as the results from this simulation would suggest. An improvement to the
simulation would possibly be to equalize the momenta of the photon of radiation and the ion.
This way although the ion has less energy than the photon, the momenta would still be the
same, this may give more accurate results regarding the level of disruption that would be
expected from an irradiation. Potentially improving the quality of the results obtained from
the simulation.
Potential applications based on results
Some of the potential applications of nanoceria were mentioned earlier in this report, the main
ones which will now be discussed are; structural engineering, biomedicine, catalysis.
Structural engineering applications
The gradients of the lines from graph 5 show the Young’s modulus of each of the structures.
The Young’s modulus is a very important value for the analysis of materials for use in different
engineering roles. For example, the Young’s modulus of concrete is approximately 17 GPa,
whereas the Young’s modulus for wood is approximately 11 GPa. The Young’s modulus of
steel used in construction is roughly 200 GPa.[11] These values show that the nanostructures
investigated in this project are stronger than concrete or wood, however the strongest
structure examined was only approximately 1/3 the strength of steel. As the nanoceria
structures have been shown to be stronger than concrete or wood, both of which are materials
which are regularly used in construction of buildings it could be worth considering a future for
nanoceria structures in areas such as engineering. Potential benefits of the use of these
structures instead of the current materials could be; a longer life time for the structures due
to a lack of corrosion from weather. However, the structures are approximately only a third
the strength of the steel being used in large buildings, this would suggest that the nanoceria
structures may be less viable in larger constructions. Although, the nanostructures could still
see a future in smaller construction projects, examples could include; houses and small
bridges.
The project described in [12] employed the same method as that used in this report, therefore
any errors that are present in the work in this report are also present in this work as well. The
mechanical properties of mesoporous nanoceria were investigated this was done by testing
24. Luke Moore, lm464 PH700, Physics, MPhys
23
different mesoporous nanostructures. The structures included 1 dimensional channels/pores
through the material. The first structure had cubic pores, the second had hexagonal pores,
the third had hexagonal pores and dislocations. The results of the analysis of these structures
were then compared to known properties of bulk Ceria.
[12] “The results of this experiment showed that the structure which had cubic pores had an
average Young’s modulus of approximately 121 GPa, additionally the strain at which the
structure experienced plastic deformation was approximately 7%. The structure with
hexagonal pores and no dislocations had an average Young’s modulus of approximately 131
GPa, additionally the strain at which the structure experienced plastic deformation was
approximately 7%. The structure with hexagonal pores and dislocations had an average
Young’s modulus of approximately 121 GPa, additionally the strain at which the structure
experienced plastic deformation was approximately 7%. Whereas, bulk Ceria had a Young’s
modulus of between 175 and 287 GPa”. These values of the Young’s modulus of mesoporous
nanoceria structures with 1 dimensional channels through the structures are significantly
higher than the values calculated from work done in this report, a suggested reason for this
is that having channels through a structure in more than one direction causes the presence
of regular voids throughout the structure these voids cause structural weakness relative to a
structure with 1 dimensional channels.
The work conducted in [12] also investigated the mechanism of collapse of the structures and
found that each structure undergoes plastic deformation via a different mechanism. “The
structure with cubic pores experiences plastic deformation via a twin grain boundary. When
the compression occurs in a specific direction the twin grain boundary gives rise to a twinning
dislocation in the plane of the grain boundary, the material then deforms plastically via a
change in the cerium sub lattice. The structure with hexagonal pores and no dislocations in
the original structure experiences plastic deformation via 2 different mechanisms dependent
on the direction of the applied pressure, in one direction the plastic deformation occurs via a
slip mechanism which results in a collapse of the pores. Whereas, in a different direction the
plastic deformation occurs via the evolution of a ‘crack’ leading to a flattening of the 1
dimensional pores. The structure with hexagonal pores and dislocations in the lattice
undergoes plastic deformation via dislocation glide”.
[12] The work concerning the structures with hexagonal pores with and without dislocations
in the lattice, shows that dislocations weaken the structure under compression. It also found
that the compressive yield stress-strain is reduced from 6.9GPa/-0.04 to 3.0GPa/-0.03, the
Young’s modulus is also reduced from 138 to 114 GPa. The work conducted in this report
25. Luke Moore, lm464 PH700, Physics, MPhys
24
shows that oxygen vacancies weaken the structure, additionally irradiating the structure which
would potentially cause dislocations weakened the structure greatly therefore this work
supports the findings of this report.
[13] This project employed the same method as that used in this report, therefore any errors
that are present in the work in this report are also present in this work as well. The mechanical
properties of Ceria nanorods were investigated in this work. This simulation shows that the
compressive yield strength of Ceria nanorods with a 10nm diameter and no extended defects
are between 46 and 36 GPa, depending on the direction the nanorods were oriented in relation
to the applied pressure. These values of the Young’s modulus are almost 10% of the Young’s
modules values of bulk material and the associated strain is approximately -0.09. Plastic
deformation was found to proceed in the nanorods via slip systems.
[14] An experiment was conducted on Ceria nanoparticles to investigate stress development
and structural stability of 3nm ceria. This was done by using X-rays to analyse the structure
in fine detail. Upon compression it was found that a state of compressed nanoceria offered
highly enhanced structural stability relative to the bulk form of the material. Investigating into
ideal size of Ceria nanoparticles to determine which size offers the greatest structural stability
could be done to advance the Ceria nanostructures prospects of usage in engineering
applications. Nanoceria is not the only nanomaterial which shows an ideal nanoparticle size
with regards to structural stability. Other structures show an ideal particle size of less than or
equal to 10nm.
Biomedical applications
[2] Suggested that Ceria nanoparticles could have uses in therapy because of the property of
nanoceria to be a self-regenerative antioxidant agent. Such an agent would have applications
in therapy because there are many “Diseases associated with oxidative stress and
inflammation, oxygen radicals”. [1] “The nanoparticles are able to scavenge the oxygen
radicals as a result of the different oxidation states of the cerium element in the lattice of the
structure, which cause the presence of oxygen vacancies”. Oxygen radicals can cause cancers
in the body according to [1]. The fact that both papers reach the same conclusion that oxygen
radicals are a very serious cause of diseases in the body suggests a high level of reliability in
this claim. According to [2] one issue of the use of the nanoceria is the tendency for the
nanoparticles to agglomerate in human cells.
An extension of this research could be to see whether deforming the nanoparticles with
pressures like those applied in this project could result in improved radical scavenging. A result
26. Luke Moore, lm464 PH700, Physics, MPhys
25
of the deformation could be a greater number of oxygen vacancies present of the surface of
the nanoparticle, thereby allowing improved radical scavenging. If that were the case then
maybe there would be an optimal level of deformation which maximises the number of oxygen
vacancies on the surface of the nanoparticle. Additionally, the deformation of the nanoparticles
may also result in a reduced tendency for the nanoparticles to agglomerate in cells. There
could be an optimal pressure to produce deformation which both maximises the number of
oxygen vacancies on the surface of the nanoparticle and at the same time minimises the
tendency for the nanoparticles to agglomerate in cells. The pressure required to achieve this
optimal theoretical level of deformation could be determined from the work carried out in this
report. As the pressure required to achieve specific strains on the nanoceria could be
determined from the graphs obtained in this project.
[15] Shows that nanoceria can be used in cancer treatment, by treating human cells with
Ceria nanoparticles the cells can be protected from radiation damage. The experiment showed
that “by treating human cells with nanoceria 99% of human normal cells were protected, but
importantly tumour cells were not protected from the radiation”. This could be a very good
method of treating cancer through radiotherapy. Radiotherapy is where radiation is used to
kill cancer cells, however a major drawback of this method is that it can damage the non-
cancerous cells surrounding the tumour. If the region around the tumour can be treated like
the cells in this experiment were, then the radiation is only killing the tumour cells not the
normal human cells. An extension of this work could also involve changing the shape of the
nanoparticles being used in this treatment. Does changing the shape of the nanoparticles have
any impact on the effectiveness of the treatment? The work conducted in this report could be
applied to this area as well if the shape of the particles does have an effect on the treatment.
However, one drawback of the use of these Ceria nanoparticles is that according to [16] they
may have “potential toxicological effects, the toxicological effects are dependent on the
physical properties of the particles”. As the toxicological effects of the nanoparticles are
dependent on the structure and surface chemistry, it may be a new area of research to
determine whether it is possible to make them non-toxic as a result of changes to the shape
and surface structure of the nanoparticles. The work carried out in this project has shown the
levels of pressure which are necessary to be applied to permanently deform Ceria
nanostructures. This research could give information about how to make the Ceria
nanoparticles non-toxic, this would allow them to be used more freely in therapy.
27. Luke Moore, lm464 PH700, Physics, MPhys
26
Catalysis
[17] has shown that it is possible to create nanoceria particles with a “very narrow size range”,
additionally this work shows that by “decreasing the particle size the lattice parameter
increases”, this “provides specific control over the surface oxygen spacing’s on the particles.
A suggested use of this work is to create more efficient solid oxide fuel cells”. However, the
research conducted in this project suggests that by decreasing the size of the nanostructures
the structure is also more susceptible to undergo deformation. This is because the smaller
structures have a smaller young’s modulus value than larger structures, this is suggested by
the work from this project as the 64,000 ion structure had a larger Young’s modulus than the
16,000 ion structure of the same shape and composition. This could restrict the environments
that these particles may be used in, as it is not known what effect the deformation of the
nanoparticles may have on the ability of the nanoparticles to work effectively at catalysing
reactions.
[18] “This work could have applications for catalytic converters which use nanoceria. The
temperatures in a catalytic converter are very high this causes thermal expansion of the
nanoceria which could increase the pressure on the walls of the catalytic converter. This could
relate to work done in this project, as the work done in this project relates structural changes
with changes in pressure. The question could then be whether the nanoceria is still an effective
catalyst after this deformation has occurred, it is possible that its catalytic activity could change
as a result of structural changes, making it a less effective material for use in catalytic
converters”.
28. Luke Moore, lm464 PH700, Physics, MPhys
27
Discussion of the mechanism of collapse of the structures
Diagram 5: This shows 2 consecutive frames of the simulation as viewed on a molecular
dynamics viewing program. The top image is the last frame prior to the dislocation, and the
lower image is the first image in which the dislocation is visible. The dislocation has been
indicated by the use of circles to show the region in which the dislocation occurs.
The paper [12] states that “dislocations provide vehicles for plastic deformation. If the material
does not comprise an intrinsic dislocation, the system can only deform plastically when the
applied load is sufficiently high to evolve a dislocation”.
A dislocation such as the one shown in diagram 5 occurs when the forces acting on the
structure have reached a critical point known as the elastic limit. The dislocation shown in this
image is a movement of ions relative to one another localized to a particular region of the
structure. This movement of ions creates a weaker region within the structure, whereby the
29. Luke Moore, lm464 PH700, Physics, MPhys
28
structure is now able to cause further deformations and initiate a collapse of the entire
structure. This occurs at a strain of approximately 6 - 7%.
The plastic deformation occurring at a strain of approximately 7% is not unexpected as work
carried out in the report [12] shows that plastic deformation of all 3 mesoporous nanoceria
structures investigated in that report occurred at approximately 7%.
After the dislocation occurs the structure is then able to undergo plastic deformation, this
happens through the mechanism shown in diagram 6 below.
30. Luke Moore, lm464 PH700, Physics, MPhys
29
Diagram 6: This shows 2 images of the slip plane which forms within the structure which
allows ions to move past each other in the collapse. The top image shows the slip plane
without a line to indicate the slip plane, whereas the lower image is the same except that a
line has been placed over the image to indicate the location of the slip plane.
Diagram 6 shows a slip plane within the structure. The mechanism of the collapse of the
structures proceeds via slip planes in the structures examined in this report. Other work has
found slip planes to be the mechanism for collapse of nanoceria structures as well, for
example; work from [12] found several different collapse mechanisms for mesoporous
nanoceria structures one of which was slip planes, and [13] found that the collapse mechanism
for Ceria nanorods proceeds via slip planes as well.
31. Luke Moore, lm464 PH700, Physics, MPhys
30
Conclusions
In conclusion, this project aimed to run simulations of the compressions of 4 Ceria
nanostructures. The 4 nanostructures being investigated in this project were; 16,000 ion pure
Ceria with no oxygen vacancies, 16,000 ion Ceria with oxygen vacancies, 64,000 ion pure
Ceria with no oxygen vacancies and 64,000 ion pure Ceria irradiated. These simulations gave
data on the stress-strain characteristics of each of the structures. The stress-strain graphs
could then be used in conjunction with Hooke’s Law which is explained in [10] to determine
the Young’s modulus of each of the structures. The Young’s modulus of the structure provides
a measure of the strength of the structure under compression.
The gradients of the lines from graph 5 show the Young’s modulus of each of the structures.
Graph 5 shows the following;
Increasing the number of atoms in the structure, size of the structure, increases the
strength of the structure
Introducing oxygen vacancies into the structure weakens the structure
Irradiating a structure weakens the structure drastically.
The Young’s modulus of each of the structures as determined from graph 5 can then be
compared with the Young’s modulus of materials which are known to be used widely in
engineering. For example, the Young’s modulus of concrete is approximately 17 GPa, whereas
the Young’s modulus for wood is approximately 11 GPa. The Young’s modulus of steel used
in construction is roughly 200 GPa.[11] These values show that the nanostructures
investigated in this project are stronger than concrete or wood, however the strongest
structure investigated was only approximately 1/3 the strength of steel. As the nanoceria
structures have been shown to be stronger than concrete or wood, both of which are materials
which are regularly used in construction of buildings it could be worth considering a future for
nanoceria structures in areas such as engineering. Potential benefits of the use of these
structures instead of the current materials could be; a longer life time for the structures due
to a lack of corrosion from weather. However, the structures are approximately only a third
the strength of the steel being used in large buildings, this would suggest that the nanoceria
structures may be less viable in larger constructions. Although, the nanostructures could still
see a future in smaller construction projects, examples could include; houses and small
bridges.
32. Luke Moore, lm464 PH700, Physics, MPhys
31
[12] “The structure which had cubic pores had an average Young’s modulus of approximately
121 GPa, additionally the strain at which the structure experienced plastic deformation was
approximately 7%. The structure with hexagonal pores and no dislocations had an average
Young’s modulus of approximately 131 GPa, additionally the strain at which the structure
experienced plastic deformation was approximately 7%. The structure with hexagonal pores
and dislocations had an average Young’s modulus of approximately 121 GPa, additionally the
strain at which the structure experienced plastic deformation was approximately 7%.
Whereas, bulk Ceria had a Young’s modulus of between 175 and 287 GPa”. These values of
the Young’s modulus of mesoporous nanoceria structures with 1 dimensional channels through
the structures are significantly higher than the values calculated from work done in this report,
a suggested reason for this is that having channels through a structure in more than one
direction causes the presence of regular voids throughout the structure these voids cause
structural weakness relative to a structure with only 1 dimensional channels.
The Mechanisms of Collapse for the structures investigated in this project were found to be
the following;
Dislocation in the structure at a strain of approximately 7%
Collapse then proceeds via slip planes within the structure
Future work
Nanoceria has the potential for a very varied future in a number of different research areas,
the primary focus of this project was to evaluate the potential for structural engineering to be
a future use. However, other promising areas include Biomedicine and Catalysis, both of which
were discussed earlier in this report as well. Future work could include determining whether
deforming nanoparticles/ nanostructures for use in these areas could potentially improve their
effectiveness. An extension of the work carried out in this report could be to learn more about
the slip planes involved in the collapse of the structures, determining the miller indices
describing these slip planes.
33. Luke Moore, lm464 PH700, Physics, MPhys
32
Bibliography
[1] Exploring the properties and applications of nanoceria: is there still plenty of room at the
bottom?
Kenneth Reed, Alastair Cormack, Aniruddha Kulkarni, Mark Mayton, Dean Sayle, Fred
Klaessig and Brad Stadler
Environ. Sci.: Nano, 2014,1, 390-405
DOI: 10.1039/C4EN00079J
[2] Cerium oxide nanoparticles a promise for applications in therapy
Article in Journal OF EXPERIMENTAL THERAPEUTICS AND ONCOLOGY JANUARY 2011
Source: PubMed
Ivana Celardo, Enrico Traversa and Lina Ghibelli
Department of Biology, University of Rome “Tor Vergata”, Rome, Italy 2World Premier
International Research Center for Materials Nanoarchitectonics and National Institute for
Materials Science, Tsukuba, Japan
Accepted May 2, 2010
[3] Nanoceria as antioxidant: Synthesis and biomedical applications
A. S. Karakoti, N. A. Monteiro-RiviereAffiliated withJoint Department of Biomedical
Engineering, University of North Carolina and North Carolina State UniversityCenter for
Chemical Toxicology Research and Pharmacokinetics, North Carolina State
University, R. Aggarwal, J. P. Davis, R. J. Narayan , W. T. Self,J. McGinnis
, S. Seal
Overview Biological Materials ScienceJOM
March 2008, Volume 60, Issue 3, pp 33-37
First online: 25 March 2008
[4] Ceria Nanoparticles Catalyze Reactions For Cleaner-Fuel Future
Date: April 2, 2005
Source: Brookhaven National Laboratory
https://www.bnl.gov/newsroom/news.php?a=1282
Date accessed: 20/02/2016
[5] Carbon nanotube embedded hydrogel sheets for engineering cardiac constructs and
Bioactuators
34. Luke Moore, lm464 PH700, Physics, MPhys
33
Su Ryon Shin, Sung Mi Jung, Momen Zalabany, Keekyoung Kim, Pinar Zorlutana, Sang Bok
Kim, Mehdi Nikkhah, Mohamed Azize, Jing Kong, Kai-tak Wan, Tomas Palacios, Mehmet R.
Dokmeci, Hojae Bae, Xiaowu (Shirley) Tang and Ali Khademhosseini
Center for Biomedical Engineering, Department of Medicine, Brigham and Women's Hospital,
Harvard Medical School, 65 Landsdowne Street, Cambridge, Massachusetts 02139, United
States, Wyss Institute for Biologically Inspired Engineering, Harvard University, Boston,
Massachusetts 02115, United States, Harvard
MITDivisionofHealthSciencesandTechnologyand§DepartmentofElectricalEngineeringandComp
uterScience,MassachusettsInstituteofTechnology, Cambridge, Massachusetts 02139, United
States, Bioengineering Program and Mechanical and Industrial Engineering, Northeastern
University, Boston, Massachusetts02115,UnitedStates,
DepartmentofMaxillofacialBiomedicalEngineeringandInstituteofOralBiology,SchoolofDentistry,
KyungHeeUniversity, Seoul 130-701, Republic of Korea, and Department of Chemistry,
University of Waterloo, Waterloo, Ontario N2L 3G1, Canada
[6] Ionic crystals, lattice defects and nonstoichiometry, N.N.Greenwood, Professor of
Inorganic Chemistry, University of Newcastle upon Tyne, Chemical publishing Company INC.
New York 1970, page 64/65
Classmark at Templeman Library: QD921 gre
[7] CRYSTALLOGRAPHY AND CRYSTAL DEFECTS, A.Kelly and G.W.Groves 1970, Chapters 5-
9
Classmark at Templeman Library: QD 931 kel
[8]http://chemwiki.ucdavis.edu/Core/Physical_Chemistry/Physical_Properties_of_Matter/Ato
mic_and_Molecular_Properties/Intermolecular_Forces/Specific_Interactions/Lennard-
Jones_Potential
Accessed: 15/02/2016
[9] Physics and scientists and Engineers, Tipler Mosca, Sixth Edition, W. H Freeman and
Company New York
[10] http://www.britannica.com/science/Hookes-law
Accessed: 29/02/2016
[11] http://www.engineeringtoolbox.com/young-modulus-d_417.html
35. Luke Moore, lm464 PH700, Physics, MPhys
34
Accessed: 2/03/2016
[12] Mechanical properties of mesoporous ceria nanostructures
Thi X. T. Sayle, Beverley J. Inkson, Gunter Mobus, Stephen C.Parker, Sudipta Seal and Dean
C. Sayle
Phys.Chem.Chem.Phys., 2014, 16, 24899
Received 7th August 2014
Accepted 2nd October 2014
DOI: 10.1039/c4cp03526g
[13] Mechanical properties of ceria nanorods and nanostructures the effect of dislocation,
grain boundary and oriented attachment
Thi X. T. Sayle, Beverley J. Inkson, Ajay Karakoti, Amit Kumar, Marco Molinari, Gunter Mobus,
Stephen C.Parker, Sudipta Seal and Dean C. Sayle
Received 14th
December 2010
Accepted 9th
February 2011
DOI: 10.1039/c0nr00980f
[14] Anomalous Quasihydrostaticity and enhanced structural stability of 3nm nanoceria
Zhongwu Wang* CHESS, Wilson Laboratory, Cornell UniVersity, Ithaca, New York 14853
Sudipta Seal and Swanand Patil AdVanced Materials Processing and Analysis center,
Mechanical, Materials, and Aerospace Engineering, Nanoscience and Technology Center,
UniVersity of Central Florida, 4000 Central Florida BouleVard, Orlando, Florida 32816
Changsheng Zha
Geophysical Laboratory, Carnegie Institution of Washington, Washington, DC 20015
Qing Xue
Intel Corporation, Chandler, Arizona 85226 ReceiVed: June 23, 2007; In Final Form: July 11,
2007
[15] Vacancy engineered ceria nanostructures for protection from radiation induced cellular
damage
36. Luke Moore, lm464 PH700, Physics, MPhys
35
Roy W. Tarnuzzer, Jimmie Colon,‡ Swanand Patil, and Sudipta Seal
M. D. Anderson Cancer Center Orlando, Orlando Regional Healthcare, Orlando, Florida 32806,
and Burnett College of Biomedical Sciences and AdVanced Materials Processing and Analysis
Center, Mechanical, Materials and Aerospace Engineering, and Nanoscience and Technology
Center (NSTC), UniVersity of Central Florida, Orlando, Florida 32816
Received October 12, 2005; Revised Manuscript Received November 2, 2005
[16] Application and implication of nanoceria reactivity measurement tools and environmental
impact
Daniel Andreescu, Gonca Bulbul, Rifat Emrah Ozel, Akhtar Hayat, Naimish Sardesai and Silvana
Andreescu
Environ. Sci. Nano. 2014. 1. 445
Received 30th
April 2014
Accepted 5th
July 2014
DOI: 10.1039/c4en00075g
[17] Cerium oxide nanoparticles size selective formation and structure analysis
Feng Zhang, Siu-Wai Chan,a) Jonathan E. Spanier, Ebru Apak, Qiang Jin, Richard D. Robinson,
and Irving P. Herman Department of Applied Physics and Applied Mathematics, and Materials
Research Science and Engineering Center, Columbia University, New York, New York 10027
Received 25 June 2001; accepted for publication 6 November 2001
[18] Dr.D.C.Sayle Private conversation
37. Luke Moore, lm464 PH700, Physics, MPhys
36
Appendix
Graph 6 – stress vs. strain graph for 16,000 ion without oxygen vacancies compression in x
direction
Graph 7 – stress vs. strain graph for 16,000 ion without oxygen vacancies compression in y
direction
0
0.5
1
1.5
2
2.5
3
3.5
4
4.5
-0.1 -0.09 -0.08 -0.07 -0.06 -0.05 -0.04 -0.03 -0.02 -0.01 0
Pressure(GPa)
Compression (%/100)
16,000 pure x
0
0.5
1
1.5
2
2.5
3
-0.1 -0.09 -0.08 -0.07 -0.06 -0.05 -0.04 -0.03 -0.02 -0.01 0
Pressure(GPa)
Compression (%/100)
16,000 pure y
38. Luke Moore, lm464 PH700, Physics, MPhys
37
Graph 8 – stress vs. strain graph for 16,000 ion without oxygen vacancies compression in z
direction
Graph 9 – stress vs. strain graph for 16,000 ion with oxygen vacancies compression in x
direction
0
0.5
1
1.5
2
2.5
3
3.5
4
-0.1 -0.09 -0.08 -0.07 -0.06 -0.05 -0.04 -0.03 -0.02 -0.01 0
Pressure(GPa)
Compression (%/100)
16,000 pure z
0
0.5
1
1.5
2
2.5
3
3.5
4
-0.1 -0.09 -0.08 -0.07 -0.06 -0.05 -0.04 -0.03 -0.02 -0.01 0
Pressure(GPa)
Compression (%/100)
16,000 o vac x
39. Luke Moore, lm464 PH700, Physics, MPhys
38
Graph 10 – stress vs. strain graph for 16,000 ion with oxygen vacancies compression in y
direction
Graph 11 – stress vs. strain graph for 16,000 ion with oxygen vacancies compression in z
direction
0
0.5
1
1.5
2
2.5
3
-0.1 -0.09 -0.08 -0.07 -0.06 -0.05 -0.04 -0.03 -0.02 -0.01 0
Pressure(GPa)
Compression (%/100)
16,000 o vac y
0
0.5
1
1.5
2
2.5
3
-0.1 -0.09 -0.08 -0.07 -0.06 -0.05 -0.04 -0.03 -0.02 -0.01 0
Pressure(GPa)
Compression (%/100)
16,000 o vac z
40. Luke Moore, lm464 PH700, Physics, MPhys
39
Graph 12 – stress vs. strain graph for 64,000 ion without oxygen vacancies compression in x
direction
Graph 13 – stress vs. strain graph for 64,000 ion without oxygen vacancies compression in y
direction
0
0.5
1
1.5
2
2.5
3
3.5
4
4.5
-0.09 -0.08 -0.07 -0.06 -0.05 -0.04 -0.03 -0.02 -0.01 0
Pressure(GPa)
Compression (%/100)
64,000 pure x
0
1
2
3
4
5
-0.1 -0.09 -0.08 -0.07 -0.06 -0.05 -0.04 -0.03 -0.02 -0.01 0
Pressure(GPa)
Compression (%/100)
64,000 pure y
41. Luke Moore, lm464 PH700, Physics, MPhys
40
Graph 14 – stress vs. strain graph for 64,000 ion without oxygen vacancies compression in z
direction
Graph 15 – stress vs. strain graph for 64,000 ion without oxygen vacancies irradiated structure
compression in x direction
0
1
2
3
4
5
6
-0.1 -0.09 -0.08 -0.07 -0.06 -0.05 -0.04 -0.03 -0.02 -0.01 0
Pressure(GPa)
Compression (%/100)
64,000 pure z
0
0.5
1
1.5
2
2.5
3
-0.1 -0.09 -0.08 -0.07 -0.06 -0.05 -0.04 -0.03 -0.02 -0.01 0
Pressure(GPa)
Compression (%/100)
64,000 irradiated x