How To Reduce Costs And Improve Financial Performance using NextGen Practice ...
Marketing Analytics RM Report
1. Marketing Analytics
Group2:Logan Moore, Jennifer Eickert, MadelineRynkiewicz, LaurynJashinski
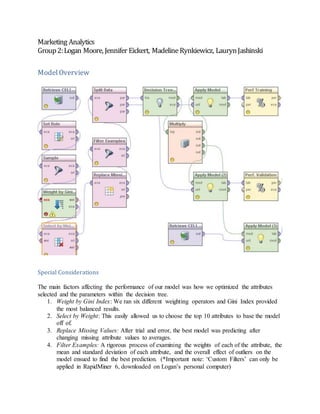
Model Overview
Special Considerations
The main factors affecting the performance of our model was how we optimized the attributes
selected and the parameters within the decision tree.
1. Weight by Gini Index: We ran six different weighting operators and Gini Index provided
the most balanced results.
2. Select by Weight: This easily allowed us to choose the top 10 attributes to base the model
off of.
3. Replace Missing Values: After trial and error, the best model was predicting after
changing missing attribute values to averages.
4. Filter Examples: A rigorous process of examining the weights of each of the attribute, the
mean and standard deviation of each attribute, and the overall effect of outliers on the
model ensued to find the best prediction. (*Important note: ‘Custom Filters’ can only be
applied in RapidMiner 6, downloaded on Logan’s personal computer)
3. 5. Decision Tree: The Gini Index was used within the decision tree. This corresponds to the
weighting measure by the Gini Index. Decision trees are the least restrictive of all models
and do not assume normal distributions. This is especially useful since some attributes
had shown that the distribution of their values was subject to skewnewss. A trial and error
process was used to maximize the parameters (shown below).
Base Optimized
4. Model1 Performance
Training
Validation
Scoring
Filters
This model has a solid performance because the ‘No’ validation is well above 40% and the ‘Yes’
Validation has a relatively high validation of 76.95%. The balanced prediction of ‘Yes’ and ‘No’
in the scoring data can be held with reasonable confidence for ‘Yes’. The validating model
actually performs better than the training data, which is an anomaly, but does further indicate its
solid all-around performance. Five filters were chosen that removed outliers of highly weighted
attributes. This process adequately scrubbed the data. More research could be conducted into
individual responses that contain outlier values, which may boost both ‘Yes’ and ‘No’ validation
performances. This is a very rigorous process, even with adequate RapidMiner operators, which
pervades the scope of this course.
5. Model2 Performance
Training
Validation
Scoring
Filters
By simply removing ‘outcalls’ from the custom filter, the performance of the model drastically
changed. This model can predict churn with 86% confidence, a 9% increase from the previous
model. However, the retention prediction drops considerably (21%). Ultimately, the marginal
gain in validation performance for churn skews this model and it appears that too many
customers are predicted to will now churn.
6. Model3 Performance
Training
Validation
Scoring
Filters
When only selecting the 6 most important attributes and filtering them for them accordingly, the
performance validation of this model reflects the higher ‘yes’ of Model 2 and the higher ‘no’ of
Model 1, in relation to whether or not a customer will churn. Once again, the validation
performance of retention seems to be too low, where the prediction is too far out of balance.
7. Profileof ChurningCustomers
Customers that churn are expected to have fewer days with their equipment and less months than
loyal customers. They will not place calls to the retention team or accept retention offers. They
are also more likely to have lower/poor credit.