SlideShare a Scribd company logo
1 of 23
          Industry OverviewGregg Carlsoncarlson.requests@gmail.comGregg Carlson<br />August 28, 2009<br />California’s Impact on the Las Vegas Strip<br />City Center’s Connection to the Port of LA<br />  <br />As the equity market looks forward to  City Center’s opening in late 2009, the  question remains,  when and will the Las Vegas Strip absorb the coming capacity increase?  The $8.4 billion City Center question  is now being  analyzed in the typical company and Wall Street bottom-up approach that deals with company model assumptions, market growth, share and segment analysis,  visitor and spend assumptions and forward booking modeling.<br />The 1989 opening of the Mirage grew the market.  In 1998 and 2005 Steve Wynn grew the  market with the opening of Bellagio and Wynn while Sheldon Adelson grew the market with the Venetian.    More recently,  Mr. Wynn and  Adelson did not grow the market with the openings of Encore and  Palazzo.  With  City Center’s late 2009 opening and openings that may follow in 2010 and beyond, the grow the LV Strip market question will persist for awhile.<br />We grapple with the question by poring through bottom-up focused company, market share and visitation models, following company comment’s and staying attuned to our channel check output.   We must admit however, that after going through the exercise our confidence level in the models and Wall Street’s consensus thinking for MGM and the Strip is less than 100%.  In an effort to gain some perspective and view the question from a different angle, we have looked 300 miles away from City Center and the Las Vegas Strip (LV Strip) to Southern California (Sou CA).  <br />The U.S., California (CA) and the LV Strip are currently mired in the worst economic downturn since the depression 60 years ago.  Due to the nature and depth of the current recession, our opinion is that broad economic factors  carry a bigger weight on 2010 – 2011 LV Strip volumes than new property opening driven visitation/volumes similar to the Mirage, Bellagio and Wynn patterns, despite the fact that City Center may be a “category killer”. <br />As a result, we have augmented our bottom-up work with  a top down view of the issue and have focused on economic conditions in the neighboring state of CA, as CA as a whole and Sou CA are the largest geographic feeder markets for the LV Strip supplying approximately 30%/25% of LV Strip traffic during 2008.  CA is also the 5th largest GNP in the world with a diverse economy tied to the balance of the U.S., Asia, Central America/Mexico and other economic regions of the world.  <br />Sou CA is also home to one of the most significant shipping lanes in the world and the busiest port in the U.S. as a significant entry point for Asian imports  and exports.  Shipping volumes have dramatically fallen off  during 2009 <br />(-20% YTD YOY) after negative YOY years in 2008 and 2007 that followed the peak positive year of 2006 as consumer spending  has cratered in the U.S..  With  60% of the port’s volume being import related and imports being significantly comprised of consumer goods, port volumes will not begin to recover until local and national retail inventories are rebuilt in front of/in response to increased consumer demand/spending.  In summary, this is the connection to the LV Strip as port volume recovery, like the LV Strip,  is dependent on increased consumer confidence and spending.  Therefore we view port volumes as a potential coincident/leading indicator for discretionary spending on the LV Strip  as volumes have fallen at similar rates on the Strip and at the LA ports, since the peak year 2006.  In summary, the economic health of CA, is not only a major direct contributor to the economic performance of the LV Strip but also a major barometer of general  overall economic health of the region, the U.S. and various international economies that drive visitation to the market.  As a result,  it is  hard to see a significant LV Strip recovery without  economic recovery in CA.  <br />This research focuses on various CA economic indicators and their relationship to LV Strip traffic and spend metrics. We have examined historical relationships in a variety of metrics and also provided the latest data points.  We have included CA economic data from a variety of sources and have also examined the latest forecasts.   While the street focuses on terms such as the high end market, mid market, economy, FIT, convention, midweek and other metrics,  we believe it is also important to take a bigger picture view of the LV Strip that is grounded in macro economics and geography and have focused on economic conditions in the largest feeder market for the LV Strip, Southern CA.  <br />The CA/Sou CA economy has suffered during the current economic crises.  Various economic measures for the state have significantly declined during the recession.  While some may be bottoming, others are continuing to descend.  In this research we used  LA Port activity as a broad indicator for CA, U.S. and International economic health as the LA shipping terminal is the busiest in the U.S. and one of the major terminals in the world as a significant amount of goods ($200 - $300+ billion per year) flow between this port,  the U.S. and Asia.  YOY port shipments have significantly declined during the current U.S./worldwide recession.  Recent metrics have remained negative as the US consumer has retrenched and Asian economies have contracted due to export declines.  The decline in port activity is also indicative of difficulties in the Southern CA economy as it is a major employer and indicator of overall local economic activity.  While the Southern CA and CA economies are diverse, during the current recession, CA has experienced a more severe economic decline than many other regions in the U.S. due to the implosion of residential real estate and and the financial services industries, among other factors.<br /> <br />As we write, the Chairman of the fed recently indicated that some level of overall economic recovery may be around the corner.  While this may be the case, our survey of recent economic CA forecasts and recent data points appear to tell a less positive story and one that indicates recovery visibility remains a bit cloudy as current economic data points are a mixed bag as some significant previously negative key consumer related indicators (e.g. CA/Sou CA unemployment) continue to deteriorate.  As a result, we a maintain a cautious view of the LV Strip looking into 2010.  Our belief is that the LV Strip will not significantly grow during 2010 until conditions in CA improve which is currently forecasted to be a back half  2010 to 2011 event.<br />Summary Findings<br />Southern CA is the most significant point of origin for LV Strip visitors. Between 2004 – 2008, 28% - 33% of LV Strip visitors originated from CA with 24% - 29% originating from Southern CA.<br />Historically, Southern CA selected general and consumer related economic statistical trends re: income, employment, and GDP have tracked LV visitation and spend data during the period examined, 2001 - 2008.<br />LV Strip YOY volume data has also tracked YOY declines in Southern CA sales of existing homes and prices for the period examined, 2003 – 2009.<br />Like the LV Strip, tribal YOY gaming revenue in CA and the Western U.S. declined during 2008.  At the same time however, CA tribes appeared to take share from the LV Strip during 2008.<br />Recent YOY LV Strip traffic and volume indicators including visitor volume, convention delegates, enplanements/deplanements, I-15 traffic and gaming revenue like various CA economic metrics, largely remain negative during 2009 for recent data points and on a YTD basis.<br />Recent Southern CA key consumer related economic data points (i.e.  income and unemployment remain largely negative while some housing related data points may be bottoming out.<br />Recent Southern CA economic survey forecasts authored by UCLA(1) and the Los Angeles County Economic Development Corporation (LAEDC)(2) remain mostly negative and point to continued challenging conditions.  Specifically, unemployment is expected to continue to rise into 2010.  General economic indicators are not forecasted to significantly improve during 2009 and possibly not before 2011 in a meaningful way.  Key recent economic data points largely remain negative.  Forecasts call for some improvement in 2009, modest CA economic improvement in 2010 with more significant growth to resume in 2011.<br />Anecdotal evidence (i.e. informal surveys of local contacts, observed theme park and restaurant volumes, etc.) recently collected in Southern CA are negative and appear to be coincident indicators that are consistent with current local negative economic headlines. <br />We surveyed economic conditions in Arizona and like California, conditions are negative.  Approximately 9% of LV Strip visitors originate in AZ, so the market is important.  Economists are forecasting that unemployment will continue to rise to the 10%+ level into 2010  and then  decline slowly with the rate not reaching more typical historic 6%ish levels, until 2012.  The overall forecast for 2010 economic growth is meager.  As a result, we are  forecasting that 2010 AZ visitation to the LV Strip will be comparable to 2009  and below recent peak year levels on the LV Strip. <br />We are betting against the build it and they will come LV Strip thesis in 2010 as we believe macro economic conditions will outweigh the new property drives visitation factor, despite that fact that City Center will attract attention and visitation.  Our thesis is that while City Center will be a must see attraction for Vegas visitors, visitation will come at the expense of existing competitor and possibly MGM properties.  Therefore we are “betting the under” and forecasting that overall market growth is less than the approximate weighted average 6ish% supply growth during 2010.  The LV Strip should do sequentially better in 2011 based on economic forecasts  we have surveyed that forecast CA 2011 economic growth.  Looking forward, additional supply likely also remains muted tied to our forecast of further  delays and potential scaling down of the  Echelon and Fontainebleau projects. <br />Risks in this forecast<br />There are many and are not limited to predicting overall market growth, operator market share and share adjustments, among others.  A significant risk is that the forecast is based on macro forecasts that are for the most part limited to approximately 40% of the market vs. 100% of the market.  Furthermore, the forecasts relied upon are potentially prone to a significant amount of error.  While the forecasts we surveyed are calling for slight incremental improvement in 2010, recent key data points we focused on in this analysis are a mixed bag with unemployment continuing to increase, port traffic and Sou CA retail sales remaining flattish at extremely negative levels with the significant risk remaining for increased mortgage delinquencies, etc.   On the positive note, signals are coming from the existing home market that  the market may be near or at a bottom in Sou CA and AZ.  In summary, a key for viewing the LV Strip looking forward will be to accurately forecast the forecasts over the next several quarters, something that will not be easy to do as actual results may very well differ greatly from the forward estimates. <br /> <br />Customer Origin for the LV Strip<br />The Las Vegas Convention and Visitors Authority (LVCVA) conducts an annual visitor survey that among other things, documents the place of residence/point of origin for LV Strip Visitors.  California is and has been the largest individual category of visitors included in the survey accounting for 28% - 33% of all LV Strip visitors during 2004 – 2008 (the survey period we reviewed).  Southern CA has contributed 24% - 29% visitors between 2004 – 2008 and remains the largest geographic submarket for the LV Strip.  See exhibits 1 & 2 below.<br />Exhibit 1: LV Strip Visitor and Visitor Origin<br />RegionConvPackageTouristCasinoGroundAirline20082007200620052004             Eastern US 11%12%7%6%3%15%8%9%8%9%10%Southern US16%16%12%11%6%21%13%13%13%13%13%Midwest US17%16%10%12%4%22%12%14%14%14%17%Southern CA24%5%25%33%39%3%24%25%27%29%27%Northern CA5%1%5%6%6%4%4%6%6%4%4%Arizona5%3%9%15%14%2%9%9%7%6%6%Other11%7%17%13%18%11%15%12%12%13%10%Foreign11%40%15%4%10%23%15%12%13%12%13%             Total100%100%100%100%100%101%100%100%100%100%100%<br />Source: LVCVA annual visitor survey<br />Exhibit 2: Geographic Origin of LV Strip Visitors<br />Source: LVCVA annual visitor survey<br />Historic Southern CA Economic Trends and LV Strip Spend and Visitation Data<br />Historic Southern CA selected general and consumer related economic statistical trends re: income, employment, and GDP have tracked LV visitation and spend data trends during the period examined, 2001 - 2009. We calculated YOY changes in key LV Strip volume metrics to compare to CA economic statistics.  Volume metrics analyzed for the LV Strip Include:<br />Visitor volume <br />I-15 auto traffic volumes<br />Air passenger volume<br />LV Strip Gaming revenue.  <br />Economic statistics for the U.S. and CA include: <br />Southern CA and CA GDP<br />Southern CA and CA per capita income<br />Total employment for CA and Southern CA<br />Southern CA and Ca unemployment<br />US unemployment<br />YOY LV Strip visitor volume and revenues grew post 911 and peaked during 2004 – 2006 due to the opening of Wynn in 2005 which grew the market and also due to a supply vs. demand environment that supported industry pricing power.  The majority of new LV Strip development projects were announced during this period of peak demand vs. supply.  During 2007, YOY growth leveled off and then went negative during the latter half of 2008 as the recession intensified.  YOY numbers remain negative during 2009 on a YTD  and most recent reported number basis.  A significant amount of new supply comes to the market during 2010 with the opening of City Center.  <br />Exhibit 3: YOY LV Strip Volume Metrics<br />Source: LVCVA and Carlson Research calculations<br />YOY CA and national economic metrics were positive during 2003 – 2006 and then began to flatten during 2007.   During the latter half of 2008, national and CA economic metrics rolled over during the economic crises and remain negative during 2009.  CA’s economy has been one of the hardest hit  in the United States.   <br />While we have not presented regressed LV Strip and Southern CA, CA and national economic data, the chart presentation appears to support the thesis that the LV Strip is not immune from  CA and national economic trends.  Recent economic forecasts for CA point to a delayed recovery and indicate that CA will recover later than other regions in the U.S.  Most recent CA economic data points largely remain negative.  Looking forward, our opinion is that the severity and depth of the current  recession and CA recession in particular, will continue to have a meaningful impact on LV Strip visitation and volume.  In summary, we believe a meaningful recovery on the LV Strip will not occur until the CA and Southern CA economy improves, therefore  muting positive overall visitation growth that may come from the late 2009 – 2010 City Center opening.<br />Exhibit 4: YOY LV Strip Volume and CA Economic Metrics<br />Source: LVCVA, LAEDC data and Carlson Research Calculations                                                                                                                                 <br />The CA/Southern CA and U.S. unemployment rate remained low and relatively steady between 2003 – 2007 as follows: 6.9 – 4.9%/6.2 – 4.5% and 6.0 – 4.6%.  The unemployment rate significantly increased in  CA/Southern CA and the US between 2007 and 2009 with the CA rate increasing faster than the national average as follows:<br />Exhibit 5: CA and US Unemployment Rate<br /> 20072008200908/07 inc09/08 incCA5.4%7.2%11.6%1.8%4.4%Sou CA5.0%7.0%11.3%2.0%4.3%US4.6%5.8%9.3%1.2%3.5%<br />Source: LAEDC data and Carlson Research calculations<br />The current high level of unemployment appears to be a current significant factor for the U.S. and CA economies.  Current CA economic forecasts include higher unemployment rate assumptions looking forward that are not forecasted to peak until mid to late 2010.  Recent data points remain incrementally negative suggesting that the bottom has yet to been reached for this economic metric.<br />Exhibit 6: YOY LV Strip Volume Metrics and Unemployment Rate Data<br />Source: LVCVA, LAEDC data and Carlson Research Calculations<br />The National and Southern CA Housing Market<br />While new home construction remains gloomy in CA (despite some signs of potential bottoming in other selected regions of the U.S. (3)), the market for existing homes in Southern CA is signaling a possible market bottom as YOY prices and sales have ticked up in recent months.  <br />Exhibit 7: Home Sales & Median Prices in Southern CA<br />Source: LAEDC, DataQuick (4) and Carlson Research calculations<br />Exhibit 8: YOY Chg in Southern CA New/Existing Home Prices and Sales<br />Source: LAEDC, DataQuick and Carlson Research calculations<br />The wildcard in the housing market in California and for the economy as a whole appears to be foreclosures as the issue appears to be an important factor that will significantly influence the consumer and overall economy looking forward.  <br />At the national level, the Mortgage Bankers Association (MBA) recently reported that at Q209, the delinquency rate on all mortgages increased sequentially from Q109 to a record high of 9.24% from 9.12% and 6.41% a year earlier.  Homes already in foreclosure increased to 4.3% of all loans, up from 3.85% during Q109 and is the highest number in three decades.  The number of loans overdue by 90 days increased to 7.97%, the highest on record, which is particularly important as the majority of 90 day past due loans typically end up in foreclosure.  In summary, past due and foreclosed loans amounted to a record of 13.16% of all outstanding U.S. mortgages at Q2.  A key issue in the report is the increasing problems in prime borrower loans that appear to be driven by declines in employment/rise in unemployment.  This appears to be a shift  from earlier periods in the cycle when problems were related to structured loans and poorly qualified borrowers.<br />Deutsche Bank (DB) recently published research forecasting that as many as 48% of all U.S. mortgage owners will end up owing more than their home is worth by 2011.  Currently 27% of all U.S. homeowners are “underwater”.  DB indicated that, this number combined with a forecast of 14% further price depreciation  potentially puts 25 million, or 48% of all mortgagors in a future negative equity position by 2011.  Furthermore, the biggest deterioration looking forward could be in  prime mortgage borrowers.  DB points out that the foreclosure wave has not stopped as serious delinquencies continue to rise with further  increases in unemployment.  DB forecasts that the resulting default rate will continue to increase as a result, as studies show that where negative equity is significant, strategic defaults increase as well.  If this were not enough, another wave of resets on adjustable rate mortgages is due to begin late this year and continue into 2010 - 2012.<br />Exhibit 9: U.S. Estimated Mortgage Resets March 2009 – 2012xxxxxxxxxxxxxxxxxxxxxxxxxxxxxxxxxxxxxxxxxxxxxxxxxxxxxxxxxxxxxx<br />Source: Credit Suisse and the Orange County Register<br />On August 20, 2009, MBA reported that California along with Arizona, Florida and Nevada continue to be the states that have a disproportionately high share of foreclosure starts.  These four states had 44% and 46% of the nations new foreclosures during Q209 and Q109.   MBA indicated that it is unlikely that we will see a meaningful reduction in foreclosures and delinquency rates until the employment situation and/or pricing environment improves (two measures that continue to head south).  For CA, the latest delinquency data regarding the first stages of foreclosure indicate  trends continued to deteriorate as about 1 in 10 CA mortgages are in default as follows:<br />                       CA        LA<br />June 09        9.5%    9.9%<br />June 08        6.0%    5.2%<br />May 09        9.2%    9.5%<br />Source: LA Times and First American Core Logic(7)<br />Local CA market experts are forecasting that these numbers will rise over at least couple of quarters as unemployment continues to rise.  CA forecasters are also predicting a prospective  increased default rate for commercial mortgages as this “shoe” has yet to drop.<br />We have included a chart that indicates 90 day delinquencies in Orange County, CA have consistently continued to increase despite government efforts and programs designed to mitigate mortgage defaults.  The author of the chart indicates that in essence a second wave of mortgage defaults does not exist as the first wave remains unabated.<br />Exhibit 10: Southern CA (Orange County) Delinquencies and ForeclosuresXXXXXXXXXXXXXXXXXXXXXXXXXXXXXXXXXXXXXXXXXXXXXXXXXXX<br />Source: First American CoreLogic and Orange County Register<br />Between 2002 – the most recent 2009 data,  LV Strip traffic and volume data have tracked CA housing data (for new and existing home sales and prices) as housing market conditions have a significant impact on consumer wealth and spending patterns.  Looking forward, there is near zero visibility that the pattern of peak positive housing market and LV Strip data points during 2004 – 2006 will repeat themselves.  At the same time, continuing difficult conditions in the CA and national housing markets are expected to be a significant drag on an economic recovery.  While the market for existing home sale may be bottoming, there is serious concern that defaults will continue to rise driven by higher unemployment rates well into 2010 and unprecedented numbers of negative loan to value mortgagors that may not peak until 2011.  As one of the hardest hit housing markets in the U.S., CA is suffering all of the major negative trends and may be a market that improves later rather than sooner from the current recession.<br />Exhibit 11: Southern CA Home Sales & YOY LV Strip Volume Data<br />Source: LVCVA, Nevada Gaming Control Board, LAEDC, DataQuick and Carlson Research data<br />Exhibit 12: Southern CA Home Sales Prices & YOY LV Strip Volume Data<br />Source: LVCVA, Nevada Gaming Control Board, LAEDC, DataQuick and Carlson Research data<br />Tribal Gaming Growth and Impact on the LV Strip<br />Tribal Gaming Revenue has significantly grown and grown at a faster rate than the LV Strip within CA, the Western U.S. and the U.S. as a whole between 2001 and 2008 (the period reviewed) at a CAGR between 2002 – 2008 as follows:<br />CA12.3%<br />AZ, CO & NM  7.7%<br />Northwest states 11.6%<br />U.S. 10.5%<br />LV Strip   4.2%<br />The tribal gaming market in CA is one of the largest gaming markets in the US in terms of gaming revenue with 59 facilities (approximately ½ located in Southern CA).  Like the LV Strip, tribal YOY gaming revenue in CA and the Western U.S. declined during 2008.  CA tribal gaming operators have become increasingly sophisticated with several offering facilities and amenities that are similar to LV Strip style casinos.<br />Exhibit 13: CA/Western U.S./U.S. Tribal Gaming/LV Strip Revenue<br />Source: National Indian Gaming Commission (NIGC)/Nevada Gaming Control Board (NGCB) data & Carlson Research calculations<br />On a regional market share basis, we believe that Western and CA tribes have taken share from the LV Strip in recent years based on our calculations using two estimation methods as follows. We summed LV Strip and CA tribal revenue and computed individual share’s of the total.  Based on this calculation, the LV Strip appears to have lost share to CA and AZ (AZ, CO & NM) tribal casino operators.  The risk in this calculation is a comparison error as LV Strip revenue includes revenue from visitors from a wider variety of origins than CA and the AZ/CO/NM regions.  While the calculation is not entirely reliable it suggests that the LV Strip has lost share to CA and AZ tribal gaming operations between 2002 – 2008 with a larger adjustment during 2008 as the regional economy weakened.<br />Exhibit 14: CA Tribal & LV Strip Market Share<br />   <br />Source: NIGC & NGCB data & Carlson Research Calculations<br />Exhibit 15: CA, AZ (AZ, NM & CO) Tribal & LV Strip Market Share<br />Source: NIGC, NGCB data & Carlson Research Calculations<br />We also estimated LV Strip revenue by geographic origin by applying LVCVA annual visitor survey point of origin data (see exhibit 1) to LV Strip revenue data to make point of origin geographic revenue estimates.  These estimates were then summed with Tribal CA and AZ (AZ, CO, NM) gaming revenue data and then compared against the total to compute overall geographic share estimates.  On this basis, the LV Strip lost share to CA and Western Tribal casinos during 2002 – 2008, with a more pronounced adjustment during 2008, as the recession intensified. <br />Exhibit 16: CA Tribal & LV Strip Region Market Share<br />Source: NIGC & NGCB data & Carlson Research Calculations<br />Exhibit 16(a): CA, AZ, CO, NM Tribal & LV Strip Region Market Share<br />Source: NIGC & NGCB data & Carlson Research Calculations<br />We also viewed CA & Western Tribal and LV Strip Gaming revenue on a YOY basis and noted that while Tribal gaming growth rolled over like LV Strip revenue during 2008, the rate of decline was approximately ½ the rate of decline of LV Strip revenue, possibly implying a  Tribal market share gain on the LV Strip owing to the improved competitive nature of the CA Tribal product and potential “staycation” consumer behavior during the recession of the Southern CA consumer. Our 2008 estimated tribal market share gain is equivalent to approximately $300 million in revenue.<br />Exhibit 17: YOY Change In Tribal and LV Strip Gaming Revenue<br />Source: NIGC & NGCB data and Carlson Research estimates<br />Exhibit 18: YOY Change in Tribal Western Region and LV Strip Gaming Revenue<br />Source: NIGC & NGCB data and Carlson Research estimates<br />In summary, while Tribal Gaming appears to have taken share from the LV Strip, neither Regional Tribal or LV Strip revenues were immune from the economic crises affecting consumers that led to a decline during 2008 and continues into 2009.  While we expect CA tribes to be a competitive threat to the LV Strip, a  bigger factor and influence on LV results is the overall economic performance for CA and economic climate in CA for consumers.  Looking forward,  resumption of GDP growth for CA and overall economic conditions for the consumer will have a bigger impact on Tribal Gaming and LV Strip revenue growth than share adjustments between the two markets.  The big question for the LV Strip looking forward is when and at what magnitude will conditions improve  for CA.<br />Recent LV Strip, CA and U.S. Data points <br />We have summarized recent and most current LV Strip volume related and CA & U.S. macro data points.  Current data points influence consensus company, industry and macro economic forecasts.  A significant current LV Strip industry issue is upcoming supply and demand and potential market share adjustments between operators, owing to the large amount of supply that is soon to enter the market.  As a result, industry volume related data points will continue to be important for investors and will continue to impact 2009, 2010 & beyond, company estimates, future enterprise value forecasts and therefore current stock prices.<br />At the macro level both nationally and for CA, unemployment/employment data is crucial as it is a current significant economic issue with plenty of news flow surrounding it.   A better/worse than expected current data point can have a meaningful impact on macro and possibly industry forecasts.  Other current crucial data points are housing related in terms of new/existing home sales & prices and foreclosure/delinquency data.  While the market does not seem to be currently focusing on gasoline prices,  we believe it is worth noting that we observed that gasoline prices have moved back up over $3.00 per gallon in Southern CA, despite the severe economic slowdown.<br />Unemployment<br />We have compared Southern CA, CA and national unemployment data to LV Strip industry volume data in graphs.  For measured data points between January 2008 – July 2009, unemployment has steadily increased while Strip volume indicators have simultaneously decreased.  The latest unemployment data points in CA continue to be incrementally and sequentially negative.  Forecasts we surveyed indicate that unemployment in CA will continue to rise from current high levels and reach peak levels sometime during the second half of 2010.  We view this as a serious issue and one that could put 2010 LV Strip estimates at risk with the possibility of of a further dampening of visitor volume and spend per visit.   As we  expect  this issue to be significant, forward monthly data points that are “less worse” than expected would be positive.<br />Exhibit 19: Southern CA unemployment & LV Strip Volume metrics<br />Source: LVCVA, NGCB, CA Employment Development Department and Carlson Research calculations<br />U.S. and California Housing Market Data<br />Recent data points (i.e. housing starts, new/used home sales and credit spreads) suggest that the U.S. housing market may be at or may have reached a bottom during the first half of the year. The Mortgage Bankers Association recently indicated however, reported a contra indicator by indicating that while home price declines appear to be moderating in more and more cities, prices may not reach bottom soon.  In regard to new national home sales trends,  Toll Brothers in a recent conference call, took more optimistic stance, reporting that several of their internal company leading indicator home building metrics in several (but not all of their national markets) have improved (CA was not included in this list).  On the negative front, mortgage foreclosure and delinquency indicators continue to throw off negative incremental signals.  Significant broadening/incremental delinquency/foreclosure risks also exist in prime borrower categories due to forecasted increased rates of unemployment and expected incremental downward adjustments in home values.  On August 21, the Mortgage Bankers Association (MBA) reported that a potential new round of foreclosures could delay the U.S. economic recovery as more than 13% of U.S. mortgage holders were delinquent on their mortgages and were in the process of having their homes repossessed during the 2nd quarter of 2009.  MBA reported that CA’s rate is the highest in the nation at 15.2%. <br />CA trends appear to be  a mixed bag and worse than national tends as the housing market is not yet out of the woods and is likely to emerge from the trees later than other regions of the U.S.  On the positive side, recent Southern CA data suggests that the existing home market may be bottoming in Southern CA as  sales and prices have ticked up in recent months while new homes sales and housing starts remain sluggish.  <br />Exhibit 20: YOY LV Strip Volume Metrics and Southern CA New/Existing Home Sales & Prices <br />Source: LVCVA, NGCB, LAEDC and Carlson Research calculations<br />Data regarding delinquencies and foreclosures remains sequentially and incrementally negative with recent CA data points throwing off scary signals.  On August 25, TransUnion (a big 3 credit reporting agency) indicated that mortgage delinquencies will continue to rise over the balance of 2009 and set record’s at year end as 60 day + delinquent mortgages skyrocket from 9.7%/10.7% at the end of June to 14%/14% (CA/Southern CA) by year end 2009.  For the Inland Empire area of Southern CA, numbers are staggering as 16.5% of mortgages in Riverside County were 60 days delinquent at June 30, 2009.  By comparison, the delinquency rate for the 1st quarter of 2007 was 2.6%, which was close to the typical normal historic national rate.<br />Exhibit 21: Mortgage Bankers Association, U.S. 2Q09 Past Due and Foreclosed Mortgages<br />Source: LA Times and Mortgage Bankers Association<br />The data described here is similar in tone to the brutally negative Deutsche Bank forecast re: potential for doubling the number of negative loan to value homes in the U.S. to 48%, which would in turn further drive incremental delinquencies in prime borrower and other categories.  As a result, we will monitor this issue plus the large prospective mortgage reset data previously mentioned in this report as they could pose a serious incremental risk to consumer discretionary spending and therefore LV Strip volumes looking forward.<br />Survey of California/Southern California Economic Forecasts<br />We surveyed CA focused recent general economic forecasts authored by UCLA, the University of CA at Santa Barbara, the University of Arizona and the Los Angeles County Economic Development Development Corporation (LAEDC)(2).  We also viewed forecasts re: CA housing and employment from DataQuick and the Mortgage Bankers Association.  We also sourced data and opinions published in the general Southern CA media including the LA Times and the Orange County Register in order to develop a current view of  consensus 2010 forecasts for CA. <br />In summary, the current look forward view is negative with unemployment and housing delinquency issues looming as larger negatives that are not forecasted to bottom out until late 2010 for employment/unemployment with the delinquency problem peaking in the future as early as late 2009 to possible 2011 as there appears to be less consensus on this issue.  Most all if not all industries are lagging in 2009 and are expected to continue to struggle during 2010 including, construction, manufacturing, retail, leisure and hospitality.  As CA struggles with it’s budget crises, we noted in recent trips significantly increased sales tax rates and government fees (beach parking for example), therefore putting incremental stress on consumer household budgets.  Over the summer of 2009, although not widely reported in the national media, we also noted an increase in gasoline prices to range of $3 - $3.25 in Southern CA. <br />We have surveyed a current forecasted unemployment rate for 2010 at 12% - 13% (2010 average).  For housing, while new home construction is expected to stay gloomy, existing home sales may have reached a bottom with some possible price stabilization?  We did not survey anyone that we believe can reliably predict the timing of a housing upturn as the risk of additional foreclosures driven by increased unemployment will remain.  While agriculture was reasonably strong in 2008, the industry has significantly weakened during 2009 owing to lower demand, pricing and exports.  The technology and aerospace industries have been a mixed bag in 2009 as demand for technology weakened offset some by military related aerospace activity.  Tourism has declined sharply during 2009 putting several well known hotels/resorts in well publicized bankruptcies or at risk for bankruptcy. <br />The commercial real estate sector is expected to continue to slow as it struggles with declining vacancies, lack of financing and falling property values therefore trigging an increase in foreclosures.  State and local governments will also remain under stress with service and staff cuts looming.<br />International trade through Sou CA two major ports weakened throughout 2008 and then declined sharply  during 2009.  Overall trade via air/rail/ships is expected to decline approximately 16% during 2009.  This is a significant measure not only for  CA’s economy but for the U.S. and Asian economies as well. Container shipments at  Sou CA’s two major port’s are off approximately 21% YTD as the ports are some of the largest and most significant in the world  and the busiest in the U.S..  As a result, they are significant  barometer of overall CA, Sou CA, U.S., Asian and worldwide economic health.  Beyond the negative YTD numbers, the latest port data points are equally negative having yet to show signs of incremental improvement.  The Port’s of Los Angeles (LA) and Long Beach (LB) recently commissioned an economic forecast provided by Tioga Group and HIS Global Insight that forecasted that port volumes would not return to 2006 peak levels anytime before 2013.  Quoting HIS, the LA Times indicated on August 17 that four more years of recovery will be needed to repair the damage caused by the worst global recession in 60 years.  The Times, quoting HIS went on to say that, “ there is no pent up consumer demand that will drive international trade as a big engine of growth it once was”. <br />Imports will bottom and begin to improve once U.S. retailers incrementally increase their Asian orders late this year while exports will not improve until global financial and economic conditions improve some.  HIS and LAEDC are forecasting single digit modest improvement in shipping (port) related trade growth in 2010.  Recent 2009 data points remain significantly negative as no bounce off the bottom has yet to be reported.<br />Exhibit  22: Latest/Recent Monthly LA Port Container Volume<br />Source: LA/LB port data & Carlson Research calculations<br /> Exhibit 23: ($’s in billions) Value of Goods through LA Ports/Rail/Air & YOY Container Volume <br />Source: LA/LB port data, LAEDC trade data & Carlson Research calculations<br />Consumer spending for the U.S. is to remain under stress due during 2009 due to rising unemployment rates, zero wage growth and weakening household balance sheets tied to declines in home equity and values of financial assets.  LAEDC and others are forecasting some recovery in late 2009 for the U.S., with modest growth in 2010 tied to tax relief and extended unemployment benefits connected with the federal stimulus program.  For CA, LAEDC is basically forecasting just above zero growth in total personal income and total per capita income for CA/Southern CA for 2010.<br />Exhibit 24 : YOY Total Personal Income by County in Southern CA & Historic Gaming Revenue<br />Source: LAEDC & Carlson Research calculations<br />Exhibit 25: YOY Total Per Capita Personal Income by County In Southern CA<br />Source: LAEDC & Carlson Research calculations<br />In summary, the near term outlook in CA is pretty bleak with some forecasts indicating a bottoming out of CA GDP (GDP goes flat) during late 2009, very modest recovery with significant GDP growth not occurring until 2011.  As the the Southern CA economy is 300 miles from the LV Strip and contributes approximately 25% of the visitation combined with the fact that  CA’s GDP is also the 5th largest in the world and home to major trade lanes, it is hard to see significant growth resume on the LV Strip without overall economic improvement there.<br />California GDP & Other Economic Metrics and Relationship to the LV Strip<br />For the U.S. as a whole, historically, there has been a relatively strong correlation between nominal GDP growth and gaming growth in terms of direction with volatility as to magnitude (6). For CA, since the peak in 2006/2007, CA gaming revenues have rolled over at a rate comparable to CA retail sales and at a significantly higher rate (at a greater magnitude) than CA nominal GDP and personal income.  Current forecasts of personal income that we reviewed range between breakeven/minimal growth (1% YOY) to potential negative growth for 2010.  Forecasts of nominal GDP we surveyed for 2010 range from just above zero  to negative 3.7% growth.  Surveyed economic forecasts for CA for 2010 and beyond generally indicate that CA will lag an overall U.S. recovery despite some possible back end 2009 smaller negative GDP forecasts.  Based on recent history and due to the nature of the current state of the recession (where unemployment in CA continues to rise and will continue to increase from current levels well into 2010), we are not forecasting that gaming industry revenue trends for CA sourced gaming revenue will significantly vary from recent relationship patterns.  As a result, we are forecasting a negative YOY growth rate for CA sourced gaming revenues for 2009 and  flattish to possibly negative growth for 2010. <br />Exhibit 26: CA GDP, Personal Income & YOY CA Sourced Gaming Revenue Growth (dollars in  billions)<br />Source: LAEDC, UC Santa Barbara economic forecast, Carlson Research calculations<br />Recent Observations from Southern CA<br />It would be wrong to judge any region as big and complex as Southern CA, solely on  anecdote’s collected during recent visits.  Yet our encounter with Southern CA was generally consistent with current negative headlines, data points and forecasts.  During a recent trip, restaurants we visited were quiet during historically peak day/hour periods.  Theme park attendance appeared to be smaller in San Diego as evidenced by shorter lines than previous years.  We also noted increases in consumer costs for gasoline plus costs  tied to budget issues as sales tax rates and various state park parking fees for example, were increased.  Individuals we talked to were generally negative as to near term personal job prospects and or income growth.  We also heard the TV & movie industries have suffered as production has been significantly decreased and possibly decreased on a permanent basis as work is being shifted outside of Southern CA.   The local news flow was consistently reporting negative current economic stories in the region.  The overall mood was generally fearful.  On the tribal gaming front, local tribal casinos appear to be using promotional techniques and other tools to draw business, such as bus programs, entertainment and amenity offerings, that are similar to Nevada.   <br />Recent Arizona (AZ) Economic Indicators<br />We also made a pass through recent AZ indicators that were compiled by the University of AZ.  According to LVCVA visitor surveys,  approximately 9% of LV Strip visitors originate from AZ.    <br />On June 1st, the University’s chief forecaster discussed 1st quarter data as Q2 data was not yet available and indicated that “green shoots”  are not yet visible at the state level.  The outlook is that the economy will stage a moderate recovery after a bottom forms sometime during Q209 – Q309.  Specifically:<br />After recent YOY losses, personal income growth will be miniscule in 2010 at .2% followed by a 4% gain in 2011.<br />AZ currently ranks 50th in job growth.  Unemployment is expected to continue to rise and reach 11% by 2009 year-end, remain high in low double digits to high single digits during  most of 2010 and then eventually decline to 6%, but not before 2012.<br />In housing, some signs of improvement are evident as existing homes sales have increased while supply has decreased from recent peaks.<br />While a robust near-term recovery is not forecasted, the forecasters expressed some confidence that recent stimulus measures will work to improve overall conditions.<br />While AZ retail sales have significantly declined, the forecasters are predicting a rebound in 2010.<br />Like CA, AZ has endured bleak conditions.  While housing may be bottoming, a key consumer related metric, unemployment, continues to decline.  The recent overall economic forecast calls for slowing overall economic decline in the latter half of 2009 with some very moderate growth during 2010.  As unemployment and wage growth will remain an issue, in a recent presentation, the University forecasters concluded by saying, “remember to tell your children that graduate school is the most respected form of unemployment.”<br />Based on this forecast, we do not expect the AZ economy to be a big driver of YOY AZ LV Strip visitation/spend during 2010.<br />MGM  Estimates on the LV Strip<br />We are not in the build it and they will come camp as we believe macro economic  challenges will trump incremental visitation that City Center may drive to the LV Strip during 2010.  In short, we are not  betting on 2010 6% - 10% market growth as we “take the under” and remain in the less than the 6ish% overall market growth camp.  Due to expected high level of interest, we expect that City Center will take share from it’s principal competitors and possibly from existing MGM LV Strip properties as well.  We expect pricing pressure to persist into 2010 with some improvement on the LV Strip in 2011 tied to a California and national economic recovery.  Based on the macro forecasts we have reviewed, and due to the fact that we are forecasting further delay’s and potential scale down of competitor projects like Fontainebleau and Echelon, we are willing to bet that 2011 will be incrementally better for MGM and others on the LV Strip than 2010.<br />Due to the high level of estimate uncertainty, we expect to continue to see a high degree of volatility in MGM quarterly street estimates looking forward.  Please contact us for additional information regarding our estimates.  <br />References:<br />UCLA is UCLA’s Anderson school quarterly CA economic forecast.<br />LAEDC is the Los Angeles Economic Development Corporation.  LAEDC is a well known CA economic forecasting and business development organization that is focused on business and job development in Southern CA.  We reviewed various LAEDC compiled historic data and their 2009 mid-year 2009 -2010 economic forecast.<br />In a recent conference call, while Toll Brothers reported some improvement in forward new home order metrics in some regions, CA was not included in the commentary.  <br />DataQuick is a nationally known real estate research organization.<br />We reviewed the latest available Arizona data, forecast  and opinion from the University of Arizona – Eller school. <br />Per Goldman Sachs, April 9, 2008 “The Essentials of Gaming Investing” report. <br />First American CoreLogic – a Southern CA real estate research organization.<br /> <br />Risks and disclosures<br />The thesis and opinions expressed in this report reflect my personal view.  No part of my compensation was directly or indirectly related to specific recommendations or views expresses in this research report.  Readers should  consider this report as only a single factor in making investment, business and/or economic decisions.  As we are not your advisor we do not take responsibility for any action you take based on this report.  This publication is provided to you for information purposes only.  The views in this publication are those of the author and are subject to change, and the author has no obligation to update  the opinion or information in this publication.  The author does not accept liability for any direct or indirect losses arising from use of this publication or it’s contents.  The author recommends that readers of this report consult with any personal  advisor’s they deem necessary before taking any actions based on this report.  Actual results may and are likely to be materially different than those indicated in this report. We have received no compensation from the companies mentioned in this report and do not have an economic and/or advisory relationship with MGM and/or other companies mentioned in this report. We currently do not own shares in any of the companies mentioned.  Finally the author does not provide tax or financial advice and nothing contained herein should be construed to be tax or financial advice.<br />City Center, Las Vegas Strip, May 2009<br />Source: Carlson photo<br />
Gregg Carlson report sample California LV Strip Sept 18

More Related Content

What's hot

Apertor california and-lv_strip
Apertor california and-lv_stripApertor california and-lv_strip
Apertor california and-lv_stripGregg Carlson
 
Get Research Resource5
Get Research Resource5Get Research Resource5
Get Research Resource5Igor Bevzenko
 
C&W MARKETBEAT- CAPITAL MARKETS Q4 2016 – #CRE #REALESTATE #CCIM #SIOR @YOURT...
C&W MARKETBEAT- CAPITAL MARKETS Q4 2016 – #CRE #REALESTATE #CCIM #SIOR @YOURT...C&W MARKETBEAT- CAPITAL MARKETS Q4 2016 – #CRE #REALESTATE #CCIM #SIOR @YOURT...
C&W MARKETBEAT- CAPITAL MARKETS Q4 2016 – #CRE #REALESTATE #CCIM #SIOR @YOURT...Guy Masse
 
Macroresearch
MacroresearchMacroresearch
Macroresearchdza1212
 
Resi View - Winter 2015
Resi View - Winter 2015Resi View - Winter 2015
Resi View - Winter 2015Lee Layton
 
Global real estate trends
Global real estate trendsGlobal real estate trends
Global real estate trendscutmytaxes
 
Commerce Real Estate Solutions 3rd Qtr 2010 Industrial Report
Commerce Real Estate Solutions 3rd Qtr 2010 Industrial ReportCommerce Real Estate Solutions 3rd Qtr 2010 Industrial Report
Commerce Real Estate Solutions 3rd Qtr 2010 Industrial ReportJessica Parrish
 
Global investor intentions survey 2016
Global investor intentions survey 2016 Global investor intentions survey 2016
Global investor intentions survey 2016 CBRE_Spain
 
Currencies and Rents Commodity Impact on SSA Real Estate 2016
Currencies and Rents Commodity Impact on SSA Real Estate 2016Currencies and Rents Commodity Impact on SSA Real Estate 2016
Currencies and Rents Commodity Impact on SSA Real Estate 2016Fadheelat Noor Mohamed
 
Building Blocks Investment Strategy Deck
Building Blocks Investment Strategy DeckBuilding Blocks Investment Strategy Deck
Building Blocks Investment Strategy DeckAniket Matharasi
 
Hong Kong's Clouded Destiny by Wu, Dingeldey & Wan, TIE, Sep 2015
Hong Kong's Clouded Destiny by Wu, Dingeldey & Wan, TIE, Sep 2015Hong Kong's Clouded Destiny by Wu, Dingeldey & Wan, TIE, Sep 2015
Hong Kong's Clouded Destiny by Wu, Dingeldey & Wan, TIE, Sep 2015Philipp Dingeldey
 
BoyarMiller Forum: Houston Commercial Real Estate Markets 2017 Outlook
BoyarMiller Forum: Houston Commercial Real Estate Markets 2017 OutlookBoyarMiller Forum: Houston Commercial Real Estate Markets 2017 Outlook
BoyarMiller Forum: Houston Commercial Real Estate Markets 2017 OutlookBoyarMiller
 
Retail Shopping Center Financial Analysis Project
Retail Shopping Center Financial Analysis ProjectRetail Shopping Center Financial Analysis Project
Retail Shopping Center Financial Analysis Projectcrac0018
 
Trump100 days- Implications for the Property Markets
Trump100 days-  Implications for the Property Markets Trump100 days-  Implications for the Property Markets
Trump100 days- Implications for the Property Markets Guy Masse
 

What's hot (20)

Apertor california and-lv_strip
Apertor california and-lv_stripApertor california and-lv_strip
Apertor california and-lv_strip
 
Get Research Resource5
Get Research Resource5Get Research Resource5
Get Research Resource5
 
C&W MARKETBEAT- CAPITAL MARKETS Q4 2016 – #CRE #REALESTATE #CCIM #SIOR @YOURT...
C&W MARKETBEAT- CAPITAL MARKETS Q4 2016 – #CRE #REALESTATE #CCIM #SIOR @YOURT...C&W MARKETBEAT- CAPITAL MARKETS Q4 2016 – #CRE #REALESTATE #CCIM #SIOR @YOURT...
C&W MARKETBEAT- CAPITAL MARKETS Q4 2016 – #CRE #REALESTATE #CCIM #SIOR @YOURT...
 
Macroresearch
MacroresearchMacroresearch
Macroresearch
 
Month in review_february_2016_residential
Month in review_february_2016_residentialMonth in review_february_2016_residential
Month in review_february_2016_residential
 
Resi View - Winter 2015
Resi View - Winter 2015Resi View - Winter 2015
Resi View - Winter 2015
 
EO_0317
EO_0317EO_0317
EO_0317
 
Global real estate trends
Global real estate trendsGlobal real estate trends
Global real estate trends
 
Commerce Real Estate Solutions 3rd Qtr 2010 Industrial Report
Commerce Real Estate Solutions 3rd Qtr 2010 Industrial ReportCommerce Real Estate Solutions 3rd Qtr 2010 Industrial Report
Commerce Real Estate Solutions 3rd Qtr 2010 Industrial Report
 
Global investor intentions survey 2016
Global investor intentions survey 2016 Global investor intentions survey 2016
Global investor intentions survey 2016
 
Currencies and Rents Commodity Impact on SSA Real Estate 2016
Currencies and Rents Commodity Impact on SSA Real Estate 2016Currencies and Rents Commodity Impact on SSA Real Estate 2016
Currencies and Rents Commodity Impact on SSA Real Estate 2016
 
Building Blocks Investment Strategy Deck
Building Blocks Investment Strategy DeckBuilding Blocks Investment Strategy Deck
Building Blocks Investment Strategy Deck
 
The Gemini Economy
The Gemini EconomyThe Gemini Economy
The Gemini Economy
 
Hong Kong's Clouded Destiny by Wu, Dingeldey & Wan, TIE, Sep 2015
Hong Kong's Clouded Destiny by Wu, Dingeldey & Wan, TIE, Sep 2015Hong Kong's Clouded Destiny by Wu, Dingeldey & Wan, TIE, Sep 2015
Hong Kong's Clouded Destiny by Wu, Dingeldey & Wan, TIE, Sep 2015
 
BoyarMiller Forum: Houston Commercial Real Estate Markets 2017 Outlook
BoyarMiller Forum: Houston Commercial Real Estate Markets 2017 OutlookBoyarMiller Forum: Houston Commercial Real Estate Markets 2017 Outlook
BoyarMiller Forum: Houston Commercial Real Estate Markets 2017 Outlook
 
Retail Shopping Center Financial Analysis Project
Retail Shopping Center Financial Analysis ProjectRetail Shopping Center Financial Analysis Project
Retail Shopping Center Financial Analysis Project
 
TREB Housing Market Charts - May 2013
TREB Housing Market Charts - May 2013TREB Housing Market Charts - May 2013
TREB Housing Market Charts - May 2013
 
TREB Housing Market Charts - March 2013
TREB Housing Market Charts - March 2013TREB Housing Market Charts - March 2013
TREB Housing Market Charts - March 2013
 
Trump100 days- Implications for the Property Markets
Trump100 days-  Implications for the Property Markets Trump100 days-  Implications for the Property Markets
Trump100 days- Implications for the Property Markets
 
Wright report2 2012
Wright report2 2012Wright report2 2012
Wright report2 2012
 

Viewers also liked

Web based control
Web based controlWeb based control
Web based controlOsama Azim
 
Non verbal communication
Non verbal communicationNon verbal communication
Non verbal communicationHasnain Baber
 
Reflective practice webcast2010
Reflective practice webcast2010Reflective practice webcast2010
Reflective practice webcast2010Gabriela Alpirez
 
Clusters and the Coordination of Private Sector Development Policies-Carlo Pi...
Clusters and the Coordination of Private Sector Development Policies-Carlo Pi...Clusters and the Coordination of Private Sector Development Policies-Carlo Pi...
Clusters and the Coordination of Private Sector Development Policies-Carlo Pi...ConectaDEL
 
Social Media &amp; Politics
Social Media &amp; PoliticsSocial Media &amp; Politics
Social Media &amp; Politicsroyalhap
 
Social media and e-politics: Reaching and engaging citizens
Social media and e-politics: Reaching and engaging citizensSocial media and e-politics: Reaching and engaging citizens
Social media and e-politics: Reaching and engaging citizensMunir Mandviwalla
 
H63ECH_1B_023799_OsamaAzim
H63ECH_1B_023799_OsamaAzimH63ECH_1B_023799_OsamaAzim
H63ECH_1B_023799_OsamaAzimOsama Azim
 
H64CSA_1B_023799_Osama
H64CSA_1B_023799_OsamaH64CSA_1B_023799_Osama
H64CSA_1B_023799_OsamaOsama Azim
 
H63ECH_1A_023799_Osama
H63ECH_1A_023799_OsamaH63ECH_1A_023799_Osama
H63ECH_1A_023799_OsamaOsama Azim
 
H64CSA_1A_023799_Osama
H64CSA_1A_023799_OsamaH64CSA_1A_023799_Osama
H64CSA_1A_023799_OsamaOsama Azim
 
Web based control of pressure loop apparatus
Web based control of pressure loop apparatusWeb based control of pressure loop apparatus
Web based control of pressure loop apparatusOsama Azim
 
Instrumentation and process control fundamentals
Instrumentation and  process control fundamentalsInstrumentation and  process control fundamentals
Instrumentation and process control fundamentalshossam hassanein
 

Viewers also liked (14)

Web based control
Web based controlWeb based control
Web based control
 
Non verbal communication
Non verbal communicationNon verbal communication
Non verbal communication
 
Reflective practice webcast2010
Reflective practice webcast2010Reflective practice webcast2010
Reflective practice webcast2010
 
Clusters and the Coordination of Private Sector Development Policies-Carlo Pi...
Clusters and the Coordination of Private Sector Development Policies-Carlo Pi...Clusters and the Coordination of Private Sector Development Policies-Carlo Pi...
Clusters and the Coordination of Private Sector Development Policies-Carlo Pi...
 
Social Media &amp; Politics
Social Media &amp; PoliticsSocial Media &amp; Politics
Social Media &amp; Politics
 
Social media and e-politics: Reaching and engaging citizens
Social media and e-politics: Reaching and engaging citizensSocial media and e-politics: Reaching and engaging citizens
Social media and e-politics: Reaching and engaging citizens
 
H63ECH_1B_023799_OsamaAzim
H63ECH_1B_023799_OsamaAzimH63ECH_1B_023799_OsamaAzim
H63ECH_1B_023799_OsamaAzim
 
H64CSA_1B_023799_Osama
H64CSA_1B_023799_OsamaH64CSA_1B_023799_Osama
H64CSA_1B_023799_Osama
 
H63ECH_1A_023799_Osama
H63ECH_1A_023799_OsamaH63ECH_1A_023799_Osama
H63ECH_1A_023799_Osama
 
H64CSA_1A_023799_Osama
H64CSA_1A_023799_OsamaH64CSA_1A_023799_Osama
H64CSA_1A_023799_Osama
 
Web based control of pressure loop apparatus
Web based control of pressure loop apparatusWeb based control of pressure loop apparatus
Web based control of pressure loop apparatus
 
Class 3 control system components
Class 3   control system componentsClass 3   control system components
Class 3 control system components
 
Class 1 need for process control & process terminology
Class 1   need for process control & process terminologyClass 1   need for process control & process terminology
Class 1 need for process control & process terminology
 
Instrumentation and process control fundamentals
Instrumentation and  process control fundamentalsInstrumentation and  process control fundamentals
Instrumentation and process control fundamentals
 

Similar to Gregg Carlson report sample California LV Strip Sept 18

"Do Current Account Deficits Matter?"
"Do Current Account Deficits Matter?""Do Current Account Deficits Matter?"
"Do Current Account Deficits Matter?"mkcrookham
 
HVS 2010 South America
HVS 2010 South AmericaHVS 2010 South America
HVS 2010 South AmericaAdeline CH
 
US Capital Trends-The Big Picture
US Capital Trends-The Big PictureUS Capital Trends-The Big Picture
US Capital Trends-The Big PictureLiberty McPartland
 
Eye on the markets
Eye on the marketsEye on the markets
Eye on the marketsAndrew Lee
 
Global Money Transfer (Remittances) Market Report: 2013 Edition – New Report ...
Global Money Transfer (Remittances) Market Report: 2013 Edition – New Report ...Global Money Transfer (Remittances) Market Report: 2013 Edition – New Report ...
Global Money Transfer (Remittances) Market Report: 2013 Edition – New Report ...Koncept Analytics
 
WINNING IN GROWTH CITIES /ACushman & Wakefield Capital Markets Research Publi...
WINNING IN GROWTH CITIES /ACushman & Wakefield Capital Markets Research Publi...WINNING IN GROWTH CITIES /ACushman & Wakefield Capital Markets Research Publi...
WINNING IN GROWTH CITIES /ACushman & Wakefield Capital Markets Research Publi...Guy Masse
 
Luxury Market Report 2020
Luxury Market Report 2020Luxury Market Report 2020
Luxury Market Report 2020FRANKLIN KNOTTS
 
Whitepaper: Latin America: Room for growth
Whitepaper: Latin America: Room for growthWhitepaper: Latin America: Room for growth
Whitepaper: Latin America: Room for growthDubaiChamber
 
Gr report global_powers_of_retailing_2016
Gr report global_powers_of_retailing_2016Gr report global_powers_of_retailing_2016
Gr report global_powers_of_retailing_2016Ethos Media S.A.
 
Jamestown Latin America | Trends + Views | Currency Analysis
Jamestown Latin America | Trends + Views | Currency AnalysisJamestown Latin America | Trends + Views | Currency Analysis
Jamestown Latin America | Trends + Views | Currency AnalysisFerhat Guven
 
Main Streets Across the World 2015-2016
Main Streets Across the World 2015-2016Main Streets Across the World 2015-2016
Main Streets Across the World 2015-2016David Bourla
 
Crisis And Economic Outlook For 2008
Crisis And Economic Outlook For 2008Crisis And Economic Outlook For 2008
Crisis And Economic Outlook For 2008guest19e4c
 
12 Cities H1 2015 (double pages lo-res)
12 Cities H1 2015 (double pages lo-res)12 Cities H1 2015 (double pages lo-res)
12 Cities H1 2015 (double pages lo-res)Josh Gorin
 
c620708e-913c-4440-b4a6-b936219f2994-150506143646-conversion-gate01
c620708e-913c-4440-b4a6-b936219f2994-150506143646-conversion-gate01c620708e-913c-4440-b4a6-b936219f2994-150506143646-conversion-gate01
c620708e-913c-4440-b4a6-b936219f2994-150506143646-conversion-gate01Marcus Arredondo
 
Multifamily - Spring 2016 (1)
Multifamily - Spring 2016 (1)Multifamily - Spring 2016 (1)
Multifamily - Spring 2016 (1)Thomas E. Dean
 
Multifamily spring 2016 (1)
Multifamily   spring 2016 (1)Multifamily   spring 2016 (1)
Multifamily spring 2016 (1)Thomas E. Dean
 

Similar to Gregg Carlson report sample California LV Strip Sept 18 (20)

"Do Current Account Deficits Matter?"
"Do Current Account Deficits Matter?""Do Current Account Deficits Matter?"
"Do Current Account Deficits Matter?"
 
HVS 2010 South America
HVS 2010 South AmericaHVS 2010 South America
HVS 2010 South America
 
US Capital Trends-The Big Picture
US Capital Trends-The Big PictureUS Capital Trends-The Big Picture
US Capital Trends-The Big Picture
 
Houston TRENDS 2014
Houston TRENDS 2014Houston TRENDS 2014
Houston TRENDS 2014
 
Eye on the markets
Eye on the marketsEye on the markets
Eye on the markets
 
Global Money Transfer (Remittances) Market Report: 2013 Edition – New Report ...
Global Money Transfer (Remittances) Market Report: 2013 Edition – New Report ...Global Money Transfer (Remittances) Market Report: 2013 Edition – New Report ...
Global Money Transfer (Remittances) Market Report: 2013 Edition – New Report ...
 
Real Estate Vacancy Factor Index April 2016
Real Estate Vacancy Factor Index April 2016Real Estate Vacancy Factor Index April 2016
Real Estate Vacancy Factor Index April 2016
 
WINNING IN GROWTH CITIES /ACushman & Wakefield Capital Markets Research Publi...
WINNING IN GROWTH CITIES /ACushman & Wakefield Capital Markets Research Publi...WINNING IN GROWTH CITIES /ACushman & Wakefield Capital Markets Research Publi...
WINNING IN GROWTH CITIES /ACushman & Wakefield Capital Markets Research Publi...
 
Beige book 20200715
Beige book 20200715Beige book 20200715
Beige book 20200715
 
Luxury Market Report 2020
Luxury Market Report 2020Luxury Market Report 2020
Luxury Market Report 2020
 
Whitepaper: Latin America: Room for growth
Whitepaper: Latin America: Room for growthWhitepaper: Latin America: Room for growth
Whitepaper: Latin America: Room for growth
 
National 1Q15
National 1Q15National 1Q15
National 1Q15
 
Gr report global_powers_of_retailing_2016
Gr report global_powers_of_retailing_2016Gr report global_powers_of_retailing_2016
Gr report global_powers_of_retailing_2016
 
Jamestown Latin America | Trends + Views | Currency Analysis
Jamestown Latin America | Trends + Views | Currency AnalysisJamestown Latin America | Trends + Views | Currency Analysis
Jamestown Latin America | Trends + Views | Currency Analysis
 
Main Streets Across the World 2015-2016
Main Streets Across the World 2015-2016Main Streets Across the World 2015-2016
Main Streets Across the World 2015-2016
 
Crisis And Economic Outlook For 2008
Crisis And Economic Outlook For 2008Crisis And Economic Outlook For 2008
Crisis And Economic Outlook For 2008
 
12 Cities H1 2015 (double pages lo-res)
12 Cities H1 2015 (double pages lo-res)12 Cities H1 2015 (double pages lo-res)
12 Cities H1 2015 (double pages lo-res)
 
c620708e-913c-4440-b4a6-b936219f2994-150506143646-conversion-gate01
c620708e-913c-4440-b4a6-b936219f2994-150506143646-conversion-gate01c620708e-913c-4440-b4a6-b936219f2994-150506143646-conversion-gate01
c620708e-913c-4440-b4a6-b936219f2994-150506143646-conversion-gate01
 
Multifamily - Spring 2016 (1)
Multifamily - Spring 2016 (1)Multifamily - Spring 2016 (1)
Multifamily - Spring 2016 (1)
 
Multifamily spring 2016 (1)
Multifamily   spring 2016 (1)Multifamily   spring 2016 (1)
Multifamily spring 2016 (1)
 

Recently uploaded

INTERNATIONAL TRADE INSTITUTIONS[6].pptx
INTERNATIONAL TRADE INSTITUTIONS[6].pptxINTERNATIONAL TRADE INSTITUTIONS[6].pptx
INTERNATIONAL TRADE INSTITUTIONS[6].pptxaymenkhalfallah23
 
2024 Q1 Crypto Industry Report | CoinGecko
2024 Q1 Crypto Industry Report | CoinGecko2024 Q1 Crypto Industry Report | CoinGecko
2024 Q1 Crypto Industry Report | CoinGeckoCoinGecko
 
Gender and caste discrimination in india
Gender and caste discrimination in indiaGender and caste discrimination in india
Gender and caste discrimination in indiavandanasingh01072003
 
Unveiling Poonawalla Fincorp’s Phenomenal Performance Under Abhay Bhutada’s L...
Unveiling Poonawalla Fincorp’s Phenomenal Performance Under Abhay Bhutada’s L...Unveiling Poonawalla Fincorp’s Phenomenal Performance Under Abhay Bhutada’s L...
Unveiling Poonawalla Fincorp’s Phenomenal Performance Under Abhay Bhutada’s L...beulahfernandes8
 
cost of capital questions financial management
cost of capital questions financial managementcost of capital questions financial management
cost of capital questions financial managementtanmayarora23
 
Financial analysis on Risk and Return.ppt
Financial analysis on Risk and Return.pptFinancial analysis on Risk and Return.ppt
Financial analysis on Risk and Return.ppttadegebreyesus
 
NO1 Certified Black Magic Specialist Expert In Bahawalpur, Sargodha, Sialkot,...
NO1 Certified Black Magic Specialist Expert In Bahawalpur, Sargodha, Sialkot,...NO1 Certified Black Magic Specialist Expert In Bahawalpur, Sargodha, Sialkot,...
NO1 Certified Black Magic Specialist Expert In Bahawalpur, Sargodha, Sialkot,...Amil baba
 
Uae-NO1 Rohani Amil In Islamabad Amil Baba in Rawalpindi Kala Jadu Amil In Ra...
Uae-NO1 Rohani Amil In Islamabad Amil Baba in Rawalpindi Kala Jadu Amil In Ra...Uae-NO1 Rohani Amil In Islamabad Amil Baba in Rawalpindi Kala Jadu Amil In Ra...
Uae-NO1 Rohani Amil In Islamabad Amil Baba in Rawalpindi Kala Jadu Amil In Ra...Amil baba
 
Financial Preparation for Millennia.pptx
Financial Preparation for Millennia.pptxFinancial Preparation for Millennia.pptx
Financial Preparation for Millennia.pptxsimon978302
 
NO1 Certified Amil Baba In Lahore Kala Jadu In Lahore Best Amil In Lahore Ami...
NO1 Certified Amil Baba In Lahore Kala Jadu In Lahore Best Amil In Lahore Ami...NO1 Certified Amil Baba In Lahore Kala Jadu In Lahore Best Amil In Lahore Ami...
NO1 Certified Amil Baba In Lahore Kala Jadu In Lahore Best Amil In Lahore Ami...Amil baba
 
Global Economic Outlook, 2024 - Scholaride Consulting
Global Economic Outlook, 2024 - Scholaride ConsultingGlobal Economic Outlook, 2024 - Scholaride Consulting
Global Economic Outlook, 2024 - Scholaride Consultingswastiknandyofficial
 
Unveiling Business Expansion Trends in 2024
Unveiling Business Expansion Trends in 2024Unveiling Business Expansion Trends in 2024
Unveiling Business Expansion Trends in 2024Champak Jhagmag
 
Banking: Commercial and Central Banking.pptx
Banking: Commercial and Central Banking.pptxBanking: Commercial and Central Banking.pptx
Banking: Commercial and Central Banking.pptxANTHONYAKINYOSOYE1
 
Introduction to Health Economics Dr. R. Kurinji Malar.pptx
Introduction to Health Economics Dr. R. Kurinji Malar.pptxIntroduction to Health Economics Dr. R. Kurinji Malar.pptx
Introduction to Health Economics Dr. R. Kurinji Malar.pptxDrRkurinjiMalarkurin
 
Money Forward Integrated Report “Forward Map” 2024
Money Forward Integrated Report “Forward Map” 2024Money Forward Integrated Report “Forward Map” 2024
Money Forward Integrated Report “Forward Map” 2024Money Forward
 
The Inspirational Story of Julio Herrera Velutini - Global Finance Leader
The Inspirational Story of Julio Herrera Velutini - Global Finance LeaderThe Inspirational Story of Julio Herrera Velutini - Global Finance Leader
The Inspirational Story of Julio Herrera Velutini - Global Finance LeaderArianna Varetto
 
Unit 4.1 financial markets operations .pdf
Unit 4.1 financial markets operations .pdfUnit 4.1 financial markets operations .pdf
Unit 4.1 financial markets operations .pdfSatyamSinghParihar2
 
NO1 Certified Black Magic Removal in Uk kala jadu Specialist kala jadu for Lo...
NO1 Certified Black Magic Removal in Uk kala jadu Specialist kala jadu for Lo...NO1 Certified Black Magic Removal in Uk kala jadu Specialist kala jadu for Lo...
NO1 Certified Black Magic Removal in Uk kala jadu Specialist kala jadu for Lo...Amil baba
 
10 QuickBooks Tips 2024 - Globus Finanza.pdf
10 QuickBooks Tips 2024 - Globus Finanza.pdf10 QuickBooks Tips 2024 - Globus Finanza.pdf
10 QuickBooks Tips 2024 - Globus Finanza.pdfglobusfinanza
 
2024-04-09 - Pension Playpen roundtable - slides.pptx
2024-04-09 - Pension Playpen roundtable - slides.pptx2024-04-09 - Pension Playpen roundtable - slides.pptx
2024-04-09 - Pension Playpen roundtable - slides.pptxHenry Tapper
 

Recently uploaded (20)

INTERNATIONAL TRADE INSTITUTIONS[6].pptx
INTERNATIONAL TRADE INSTITUTIONS[6].pptxINTERNATIONAL TRADE INSTITUTIONS[6].pptx
INTERNATIONAL TRADE INSTITUTIONS[6].pptx
 
2024 Q1 Crypto Industry Report | CoinGecko
2024 Q1 Crypto Industry Report | CoinGecko2024 Q1 Crypto Industry Report | CoinGecko
2024 Q1 Crypto Industry Report | CoinGecko
 
Gender and caste discrimination in india
Gender and caste discrimination in indiaGender and caste discrimination in india
Gender and caste discrimination in india
 
Unveiling Poonawalla Fincorp’s Phenomenal Performance Under Abhay Bhutada’s L...
Unveiling Poonawalla Fincorp’s Phenomenal Performance Under Abhay Bhutada’s L...Unveiling Poonawalla Fincorp’s Phenomenal Performance Under Abhay Bhutada’s L...
Unveiling Poonawalla Fincorp’s Phenomenal Performance Under Abhay Bhutada’s L...
 
cost of capital questions financial management
cost of capital questions financial managementcost of capital questions financial management
cost of capital questions financial management
 
Financial analysis on Risk and Return.ppt
Financial analysis on Risk and Return.pptFinancial analysis on Risk and Return.ppt
Financial analysis on Risk and Return.ppt
 
NO1 Certified Black Magic Specialist Expert In Bahawalpur, Sargodha, Sialkot,...
NO1 Certified Black Magic Specialist Expert In Bahawalpur, Sargodha, Sialkot,...NO1 Certified Black Magic Specialist Expert In Bahawalpur, Sargodha, Sialkot,...
NO1 Certified Black Magic Specialist Expert In Bahawalpur, Sargodha, Sialkot,...
 
Uae-NO1 Rohani Amil In Islamabad Amil Baba in Rawalpindi Kala Jadu Amil In Ra...
Uae-NO1 Rohani Amil In Islamabad Amil Baba in Rawalpindi Kala Jadu Amil In Ra...Uae-NO1 Rohani Amil In Islamabad Amil Baba in Rawalpindi Kala Jadu Amil In Ra...
Uae-NO1 Rohani Amil In Islamabad Amil Baba in Rawalpindi Kala Jadu Amil In Ra...
 
Financial Preparation for Millennia.pptx
Financial Preparation for Millennia.pptxFinancial Preparation for Millennia.pptx
Financial Preparation for Millennia.pptx
 
NO1 Certified Amil Baba In Lahore Kala Jadu In Lahore Best Amil In Lahore Ami...
NO1 Certified Amil Baba In Lahore Kala Jadu In Lahore Best Amil In Lahore Ami...NO1 Certified Amil Baba In Lahore Kala Jadu In Lahore Best Amil In Lahore Ami...
NO1 Certified Amil Baba In Lahore Kala Jadu In Lahore Best Amil In Lahore Ami...
 
Global Economic Outlook, 2024 - Scholaride Consulting
Global Economic Outlook, 2024 - Scholaride ConsultingGlobal Economic Outlook, 2024 - Scholaride Consulting
Global Economic Outlook, 2024 - Scholaride Consulting
 
Unveiling Business Expansion Trends in 2024
Unveiling Business Expansion Trends in 2024Unveiling Business Expansion Trends in 2024
Unveiling Business Expansion Trends in 2024
 
Banking: Commercial and Central Banking.pptx
Banking: Commercial and Central Banking.pptxBanking: Commercial and Central Banking.pptx
Banking: Commercial and Central Banking.pptx
 
Introduction to Health Economics Dr. R. Kurinji Malar.pptx
Introduction to Health Economics Dr. R. Kurinji Malar.pptxIntroduction to Health Economics Dr. R. Kurinji Malar.pptx
Introduction to Health Economics Dr. R. Kurinji Malar.pptx
 
Money Forward Integrated Report “Forward Map” 2024
Money Forward Integrated Report “Forward Map” 2024Money Forward Integrated Report “Forward Map” 2024
Money Forward Integrated Report “Forward Map” 2024
 
The Inspirational Story of Julio Herrera Velutini - Global Finance Leader
The Inspirational Story of Julio Herrera Velutini - Global Finance LeaderThe Inspirational Story of Julio Herrera Velutini - Global Finance Leader
The Inspirational Story of Julio Herrera Velutini - Global Finance Leader
 
Unit 4.1 financial markets operations .pdf
Unit 4.1 financial markets operations .pdfUnit 4.1 financial markets operations .pdf
Unit 4.1 financial markets operations .pdf
 
NO1 Certified Black Magic Removal in Uk kala jadu Specialist kala jadu for Lo...
NO1 Certified Black Magic Removal in Uk kala jadu Specialist kala jadu for Lo...NO1 Certified Black Magic Removal in Uk kala jadu Specialist kala jadu for Lo...
NO1 Certified Black Magic Removal in Uk kala jadu Specialist kala jadu for Lo...
 
10 QuickBooks Tips 2024 - Globus Finanza.pdf
10 QuickBooks Tips 2024 - Globus Finanza.pdf10 QuickBooks Tips 2024 - Globus Finanza.pdf
10 QuickBooks Tips 2024 - Globus Finanza.pdf
 
2024-04-09 - Pension Playpen roundtable - slides.pptx
2024-04-09 - Pension Playpen roundtable - slides.pptx2024-04-09 - Pension Playpen roundtable - slides.pptx
2024-04-09 - Pension Playpen roundtable - slides.pptx
 

Gregg Carlson report sample California LV Strip Sept 18

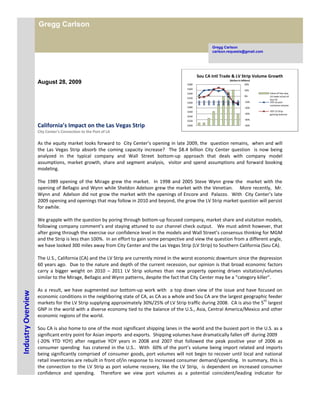
  • 1. Industry OverviewGregg Carlsoncarlson.requests@gmail.comGregg Carlson<br />August 28, 2009<br />California’s Impact on the Las Vegas Strip<br />City Center’s Connection to the Port of LA<br /> <br />As the equity market looks forward to City Center’s opening in late 2009, the question remains, when and will the Las Vegas Strip absorb the coming capacity increase? The $8.4 billion City Center question is now being analyzed in the typical company and Wall Street bottom-up approach that deals with company model assumptions, market growth, share and segment analysis, visitor and spend assumptions and forward booking modeling.<br />The 1989 opening of the Mirage grew the market. In 1998 and 2005 Steve Wynn grew the market with the opening of Bellagio and Wynn while Sheldon Adelson grew the market with the Venetian. More recently, Mr. Wynn and Adelson did not grow the market with the openings of Encore and Palazzo. With City Center’s late 2009 opening and openings that may follow in 2010 and beyond, the grow the LV Strip market question will persist for awhile.<br />We grapple with the question by poring through bottom-up focused company, market share and visitation models, following company comment’s and staying attuned to our channel check output. We must admit however, that after going through the exercise our confidence level in the models and Wall Street’s consensus thinking for MGM and the Strip is less than 100%. In an effort to gain some perspective and view the question from a different angle, we have looked 300 miles away from City Center and the Las Vegas Strip (LV Strip) to Southern California (Sou CA). <br />The U.S., California (CA) and the LV Strip are currently mired in the worst economic downturn since the depression 60 years ago. Due to the nature and depth of the current recession, our opinion is that broad economic factors carry a bigger weight on 2010 – 2011 LV Strip volumes than new property opening driven visitation/volumes similar to the Mirage, Bellagio and Wynn patterns, despite the fact that City Center may be a “category killer”. <br />As a result, we have augmented our bottom-up work with a top down view of the issue and have focused on economic conditions in the neighboring state of CA, as CA as a whole and Sou CA are the largest geographic feeder markets for the LV Strip supplying approximately 30%/25% of LV Strip traffic during 2008. CA is also the 5th largest GNP in the world with a diverse economy tied to the balance of the U.S., Asia, Central America/Mexico and other economic regions of the world. <br />Sou CA is also home to one of the most significant shipping lanes in the world and the busiest port in the U.S. as a significant entry point for Asian imports and exports. Shipping volumes have dramatically fallen off during 2009 <br />(-20% YTD YOY) after negative YOY years in 2008 and 2007 that followed the peak positive year of 2006 as consumer spending has cratered in the U.S.. With 60% of the port’s volume being import related and imports being significantly comprised of consumer goods, port volumes will not begin to recover until local and national retail inventories are rebuilt in front of/in response to increased consumer demand/spending. In summary, this is the connection to the LV Strip as port volume recovery, like the LV Strip, is dependent on increased consumer confidence and spending. Therefore we view port volumes as a potential coincident/leading indicator for discretionary spending on the LV Strip as volumes have fallen at similar rates on the Strip and at the LA ports, since the peak year 2006. In summary, the economic health of CA, is not only a major direct contributor to the economic performance of the LV Strip but also a major barometer of general overall economic health of the region, the U.S. and various international economies that drive visitation to the market. As a result, it is hard to see a significant LV Strip recovery without economic recovery in CA. <br />This research focuses on various CA economic indicators and their relationship to LV Strip traffic and spend metrics. We have examined historical relationships in a variety of metrics and also provided the latest data points. We have included CA economic data from a variety of sources and have also examined the latest forecasts. While the street focuses on terms such as the high end market, mid market, economy, FIT, convention, midweek and other metrics, we believe it is also important to take a bigger picture view of the LV Strip that is grounded in macro economics and geography and have focused on economic conditions in the largest feeder market for the LV Strip, Southern CA. <br />The CA/Sou CA economy has suffered during the current economic crises. Various economic measures for the state have significantly declined during the recession. While some may be bottoming, others are continuing to descend. In this research we used LA Port activity as a broad indicator for CA, U.S. and International economic health as the LA shipping terminal is the busiest in the U.S. and one of the major terminals in the world as a significant amount of goods ($200 - $300+ billion per year) flow between this port, the U.S. and Asia. YOY port shipments have significantly declined during the current U.S./worldwide recession. Recent metrics have remained negative as the US consumer has retrenched and Asian economies have contracted due to export declines. The decline in port activity is also indicative of difficulties in the Southern CA economy as it is a major employer and indicator of overall local economic activity. While the Southern CA and CA economies are diverse, during the current recession, CA has experienced a more severe economic decline than many other regions in the U.S. due to the implosion of residential real estate and and the financial services industries, among other factors.<br /> <br />As we write, the Chairman of the fed recently indicated that some level of overall economic recovery may be around the corner. While this may be the case, our survey of recent economic CA forecasts and recent data points appear to tell a less positive story and one that indicates recovery visibility remains a bit cloudy as current economic data points are a mixed bag as some significant previously negative key consumer related indicators (e.g. CA/Sou CA unemployment) continue to deteriorate. As a result, we a maintain a cautious view of the LV Strip looking into 2010. Our belief is that the LV Strip will not significantly grow during 2010 until conditions in CA improve which is currently forecasted to be a back half 2010 to 2011 event.<br />Summary Findings<br />Southern CA is the most significant point of origin for LV Strip visitors. Between 2004 – 2008, 28% - 33% of LV Strip visitors originated from CA with 24% - 29% originating from Southern CA.<br />Historically, Southern CA selected general and consumer related economic statistical trends re: income, employment, and GDP have tracked LV visitation and spend data during the period examined, 2001 - 2008.<br />LV Strip YOY volume data has also tracked YOY declines in Southern CA sales of existing homes and prices for the period examined, 2003 – 2009.<br />Like the LV Strip, tribal YOY gaming revenue in CA and the Western U.S. declined during 2008. At the same time however, CA tribes appeared to take share from the LV Strip during 2008.<br />Recent YOY LV Strip traffic and volume indicators including visitor volume, convention delegates, enplanements/deplanements, I-15 traffic and gaming revenue like various CA economic metrics, largely remain negative during 2009 for recent data points and on a YTD basis.<br />Recent Southern CA key consumer related economic data points (i.e. income and unemployment remain largely negative while some housing related data points may be bottoming out.<br />Recent Southern CA economic survey forecasts authored by UCLA(1) and the Los Angeles County Economic Development Corporation (LAEDC)(2) remain mostly negative and point to continued challenging conditions. Specifically, unemployment is expected to continue to rise into 2010. General economic indicators are not forecasted to significantly improve during 2009 and possibly not before 2011 in a meaningful way. Key recent economic data points largely remain negative. Forecasts call for some improvement in 2009, modest CA economic improvement in 2010 with more significant growth to resume in 2011.<br />Anecdotal evidence (i.e. informal surveys of local contacts, observed theme park and restaurant volumes, etc.) recently collected in Southern CA are negative and appear to be coincident indicators that are consistent with current local negative economic headlines. <br />We surveyed economic conditions in Arizona and like California, conditions are negative. Approximately 9% of LV Strip visitors originate in AZ, so the market is important. Economists are forecasting that unemployment will continue to rise to the 10%+ level into 2010 and then decline slowly with the rate not reaching more typical historic 6%ish levels, until 2012. The overall forecast for 2010 economic growth is meager. As a result, we are forecasting that 2010 AZ visitation to the LV Strip will be comparable to 2009 and below recent peak year levels on the LV Strip. <br />We are betting against the build it and they will come LV Strip thesis in 2010 as we believe macro economic conditions will outweigh the new property drives visitation factor, despite that fact that City Center will attract attention and visitation. Our thesis is that while City Center will be a must see attraction for Vegas visitors, visitation will come at the expense of existing competitor and possibly MGM properties. Therefore we are “betting the under” and forecasting that overall market growth is less than the approximate weighted average 6ish% supply growth during 2010. The LV Strip should do sequentially better in 2011 based on economic forecasts we have surveyed that forecast CA 2011 economic growth. Looking forward, additional supply likely also remains muted tied to our forecast of further delays and potential scaling down of the Echelon and Fontainebleau projects. <br />Risks in this forecast<br />There are many and are not limited to predicting overall market growth, operator market share and share adjustments, among others. A significant risk is that the forecast is based on macro forecasts that are for the most part limited to approximately 40% of the market vs. 100% of the market. Furthermore, the forecasts relied upon are potentially prone to a significant amount of error. While the forecasts we surveyed are calling for slight incremental improvement in 2010, recent key data points we focused on in this analysis are a mixed bag with unemployment continuing to increase, port traffic and Sou CA retail sales remaining flattish at extremely negative levels with the significant risk remaining for increased mortgage delinquencies, etc. On the positive note, signals are coming from the existing home market that the market may be near or at a bottom in Sou CA and AZ. In summary, a key for viewing the LV Strip looking forward will be to accurately forecast the forecasts over the next several quarters, something that will not be easy to do as actual results may very well differ greatly from the forward estimates. <br /> <br />Customer Origin for the LV Strip<br />The Las Vegas Convention and Visitors Authority (LVCVA) conducts an annual visitor survey that among other things, documents the place of residence/point of origin for LV Strip Visitors. California is and has been the largest individual category of visitors included in the survey accounting for 28% - 33% of all LV Strip visitors during 2004 – 2008 (the survey period we reviewed). Southern CA has contributed 24% - 29% visitors between 2004 – 2008 and remains the largest geographic submarket for the LV Strip. See exhibits 1 & 2 below.<br />Exhibit 1: LV Strip Visitor and Visitor Origin<br />RegionConvPackageTouristCasinoGroundAirline20082007200620052004             Eastern US 11%12%7%6%3%15%8%9%8%9%10%Southern US16%16%12%11%6%21%13%13%13%13%13%Midwest US17%16%10%12%4%22%12%14%14%14%17%Southern CA24%5%25%33%39%3%24%25%27%29%27%Northern CA5%1%5%6%6%4%4%6%6%4%4%Arizona5%3%9%15%14%2%9%9%7%6%6%Other11%7%17%13%18%11%15%12%12%13%10%Foreign11%40%15%4%10%23%15%12%13%12%13%             Total100%100%100%100%100%101%100%100%100%100%100%<br />Source: LVCVA annual visitor survey<br />Exhibit 2: Geographic Origin of LV Strip Visitors<br />Source: LVCVA annual visitor survey<br />Historic Southern CA Economic Trends and LV Strip Spend and Visitation Data<br />Historic Southern CA selected general and consumer related economic statistical trends re: income, employment, and GDP have tracked LV visitation and spend data trends during the period examined, 2001 - 2009. We calculated YOY changes in key LV Strip volume metrics to compare to CA economic statistics. Volume metrics analyzed for the LV Strip Include:<br />Visitor volume <br />I-15 auto traffic volumes<br />Air passenger volume<br />LV Strip Gaming revenue. <br />Economic statistics for the U.S. and CA include: <br />Southern CA and CA GDP<br />Southern CA and CA per capita income<br />Total employment for CA and Southern CA<br />Southern CA and Ca unemployment<br />US unemployment<br />YOY LV Strip visitor volume and revenues grew post 911 and peaked during 2004 – 2006 due to the opening of Wynn in 2005 which grew the market and also due to a supply vs. demand environment that supported industry pricing power. The majority of new LV Strip development projects were announced during this period of peak demand vs. supply. During 2007, YOY growth leveled off and then went negative during the latter half of 2008 as the recession intensified. YOY numbers remain negative during 2009 on a YTD and most recent reported number basis. A significant amount of new supply comes to the market during 2010 with the opening of City Center. <br />Exhibit 3: YOY LV Strip Volume Metrics<br />Source: LVCVA and Carlson Research calculations<br />YOY CA and national economic metrics were positive during 2003 – 2006 and then began to flatten during 2007. During the latter half of 2008, national and CA economic metrics rolled over during the economic crises and remain negative during 2009. CA’s economy has been one of the hardest hit in the United States. <br />While we have not presented regressed LV Strip and Southern CA, CA and national economic data, the chart presentation appears to support the thesis that the LV Strip is not immune from CA and national economic trends. Recent economic forecasts for CA point to a delayed recovery and indicate that CA will recover later than other regions in the U.S. Most recent CA economic data points largely remain negative. Looking forward, our opinion is that the severity and depth of the current recession and CA recession in particular, will continue to have a meaningful impact on LV Strip visitation and volume. In summary, we believe a meaningful recovery on the LV Strip will not occur until the CA and Southern CA economy improves, therefore muting positive overall visitation growth that may come from the late 2009 – 2010 City Center opening.<br />Exhibit 4: YOY LV Strip Volume and CA Economic Metrics<br />Source: LVCVA, LAEDC data and Carlson Research Calculations <br />The CA/Southern CA and U.S. unemployment rate remained low and relatively steady between 2003 – 2007 as follows: 6.9 – 4.9%/6.2 – 4.5% and 6.0 – 4.6%. The unemployment rate significantly increased in CA/Southern CA and the US between 2007 and 2009 with the CA rate increasing faster than the national average as follows:<br />Exhibit 5: CA and US Unemployment Rate<br /> 20072008200908/07 inc09/08 incCA5.4%7.2%11.6%1.8%4.4%Sou CA5.0%7.0%11.3%2.0%4.3%US4.6%5.8%9.3%1.2%3.5%<br />Source: LAEDC data and Carlson Research calculations<br />The current high level of unemployment appears to be a current significant factor for the U.S. and CA economies. Current CA economic forecasts include higher unemployment rate assumptions looking forward that are not forecasted to peak until mid to late 2010. Recent data points remain incrementally negative suggesting that the bottom has yet to been reached for this economic metric.<br />Exhibit 6: YOY LV Strip Volume Metrics and Unemployment Rate Data<br />Source: LVCVA, LAEDC data and Carlson Research Calculations<br />The National and Southern CA Housing Market<br />While new home construction remains gloomy in CA (despite some signs of potential bottoming in other selected regions of the U.S. (3)), the market for existing homes in Southern CA is signaling a possible market bottom as YOY prices and sales have ticked up in recent months. <br />Exhibit 7: Home Sales & Median Prices in Southern CA<br />Source: LAEDC, DataQuick (4) and Carlson Research calculations<br />Exhibit 8: YOY Chg in Southern CA New/Existing Home Prices and Sales<br />Source: LAEDC, DataQuick and Carlson Research calculations<br />The wildcard in the housing market in California and for the economy as a whole appears to be foreclosures as the issue appears to be an important factor that will significantly influence the consumer and overall economy looking forward. <br />At the national level, the Mortgage Bankers Association (MBA) recently reported that at Q209, the delinquency rate on all mortgages increased sequentially from Q109 to a record high of 9.24% from 9.12% and 6.41% a year earlier. Homes already in foreclosure increased to 4.3% of all loans, up from 3.85% during Q109 and is the highest number in three decades. The number of loans overdue by 90 days increased to 7.97%, the highest on record, which is particularly important as the majority of 90 day past due loans typically end up in foreclosure. In summary, past due and foreclosed loans amounted to a record of 13.16% of all outstanding U.S. mortgages at Q2. A key issue in the report is the increasing problems in prime borrower loans that appear to be driven by declines in employment/rise in unemployment. This appears to be a shift from earlier periods in the cycle when problems were related to structured loans and poorly qualified borrowers.<br />Deutsche Bank (DB) recently published research forecasting that as many as 48% of all U.S. mortgage owners will end up owing more than their home is worth by 2011. Currently 27% of all U.S. homeowners are “underwater”. DB indicated that, this number combined with a forecast of 14% further price depreciation potentially puts 25 million, or 48% of all mortgagors in a future negative equity position by 2011. Furthermore, the biggest deterioration looking forward could be in prime mortgage borrowers. DB points out that the foreclosure wave has not stopped as serious delinquencies continue to rise with further increases in unemployment. DB forecasts that the resulting default rate will continue to increase as a result, as studies show that where negative equity is significant, strategic defaults increase as well. If this were not enough, another wave of resets on adjustable rate mortgages is due to begin late this year and continue into 2010 - 2012.<br />Exhibit 9: U.S. Estimated Mortgage Resets March 2009 – 2012xxxxxxxxxxxxxxxxxxxxxxxxxxxxxxxxxxxxxxxxxxxxxxxxxxxxxxxxxxxxxx<br />Source: Credit Suisse and the Orange County Register<br />On August 20, 2009, MBA reported that California along with Arizona, Florida and Nevada continue to be the states that have a disproportionately high share of foreclosure starts. These four states had 44% and 46% of the nations new foreclosures during Q209 and Q109. MBA indicated that it is unlikely that we will see a meaningful reduction in foreclosures and delinquency rates until the employment situation and/or pricing environment improves (two measures that continue to head south). For CA, the latest delinquency data regarding the first stages of foreclosure indicate trends continued to deteriorate as about 1 in 10 CA mortgages are in default as follows:<br /> CA LA<br />June 09 9.5% 9.9%<br />June 08 6.0% 5.2%<br />May 09 9.2% 9.5%<br />Source: LA Times and First American Core Logic(7)<br />Local CA market experts are forecasting that these numbers will rise over at least couple of quarters as unemployment continues to rise. CA forecasters are also predicting a prospective increased default rate for commercial mortgages as this “shoe” has yet to drop.<br />We have included a chart that indicates 90 day delinquencies in Orange County, CA have consistently continued to increase despite government efforts and programs designed to mitigate mortgage defaults. The author of the chart indicates that in essence a second wave of mortgage defaults does not exist as the first wave remains unabated.<br />Exhibit 10: Southern CA (Orange County) Delinquencies and ForeclosuresXXXXXXXXXXXXXXXXXXXXXXXXXXXXXXXXXXXXXXXXXXXXXXXXXXX<br />Source: First American CoreLogic and Orange County Register<br />Between 2002 – the most recent 2009 data, LV Strip traffic and volume data have tracked CA housing data (for new and existing home sales and prices) as housing market conditions have a significant impact on consumer wealth and spending patterns. Looking forward, there is near zero visibility that the pattern of peak positive housing market and LV Strip data points during 2004 – 2006 will repeat themselves. At the same time, continuing difficult conditions in the CA and national housing markets are expected to be a significant drag on an economic recovery. While the market for existing home sale may be bottoming, there is serious concern that defaults will continue to rise driven by higher unemployment rates well into 2010 and unprecedented numbers of negative loan to value mortgagors that may not peak until 2011. As one of the hardest hit housing markets in the U.S., CA is suffering all of the major negative trends and may be a market that improves later rather than sooner from the current recession.<br />Exhibit 11: Southern CA Home Sales & YOY LV Strip Volume Data<br />Source: LVCVA, Nevada Gaming Control Board, LAEDC, DataQuick and Carlson Research data<br />Exhibit 12: Southern CA Home Sales Prices & YOY LV Strip Volume Data<br />Source: LVCVA, Nevada Gaming Control Board, LAEDC, DataQuick and Carlson Research data<br />Tribal Gaming Growth and Impact on the LV Strip<br />Tribal Gaming Revenue has significantly grown and grown at a faster rate than the LV Strip within CA, the Western U.S. and the U.S. as a whole between 2001 and 2008 (the period reviewed) at a CAGR between 2002 – 2008 as follows:<br />CA12.3%<br />AZ, CO & NM 7.7%<br />Northwest states 11.6%<br />U.S. 10.5%<br />LV Strip 4.2%<br />The tribal gaming market in CA is one of the largest gaming markets in the US in terms of gaming revenue with 59 facilities (approximately ½ located in Southern CA). Like the LV Strip, tribal YOY gaming revenue in CA and the Western U.S. declined during 2008. CA tribal gaming operators have become increasingly sophisticated with several offering facilities and amenities that are similar to LV Strip style casinos.<br />Exhibit 13: CA/Western U.S./U.S. Tribal Gaming/LV Strip Revenue<br />Source: National Indian Gaming Commission (NIGC)/Nevada Gaming Control Board (NGCB) data & Carlson Research calculations<br />On a regional market share basis, we believe that Western and CA tribes have taken share from the LV Strip in recent years based on our calculations using two estimation methods as follows. We summed LV Strip and CA tribal revenue and computed individual share’s of the total. Based on this calculation, the LV Strip appears to have lost share to CA and AZ (AZ, CO & NM) tribal casino operators. The risk in this calculation is a comparison error as LV Strip revenue includes revenue from visitors from a wider variety of origins than CA and the AZ/CO/NM regions. While the calculation is not entirely reliable it suggests that the LV Strip has lost share to CA and AZ tribal gaming operations between 2002 – 2008 with a larger adjustment during 2008 as the regional economy weakened.<br />Exhibit 14: CA Tribal & LV Strip Market Share<br /> <br />Source: NIGC & NGCB data & Carlson Research Calculations<br />Exhibit 15: CA, AZ (AZ, NM & CO) Tribal & LV Strip Market Share<br />Source: NIGC, NGCB data & Carlson Research Calculations<br />We also estimated LV Strip revenue by geographic origin by applying LVCVA annual visitor survey point of origin data (see exhibit 1) to LV Strip revenue data to make point of origin geographic revenue estimates. These estimates were then summed with Tribal CA and AZ (AZ, CO, NM) gaming revenue data and then compared against the total to compute overall geographic share estimates. On this basis, the LV Strip lost share to CA and Western Tribal casinos during 2002 – 2008, with a more pronounced adjustment during 2008, as the recession intensified. <br />Exhibit 16: CA Tribal & LV Strip Region Market Share<br />Source: NIGC & NGCB data & Carlson Research Calculations<br />Exhibit 16(a): CA, AZ, CO, NM Tribal & LV Strip Region Market Share<br />Source: NIGC & NGCB data & Carlson Research Calculations<br />We also viewed CA & Western Tribal and LV Strip Gaming revenue on a YOY basis and noted that while Tribal gaming growth rolled over like LV Strip revenue during 2008, the rate of decline was approximately ½ the rate of decline of LV Strip revenue, possibly implying a Tribal market share gain on the LV Strip owing to the improved competitive nature of the CA Tribal product and potential “staycation” consumer behavior during the recession of the Southern CA consumer. Our 2008 estimated tribal market share gain is equivalent to approximately $300 million in revenue.<br />Exhibit 17: YOY Change In Tribal and LV Strip Gaming Revenue<br />Source: NIGC & NGCB data and Carlson Research estimates<br />Exhibit 18: YOY Change in Tribal Western Region and LV Strip Gaming Revenue<br />Source: NIGC & NGCB data and Carlson Research estimates<br />In summary, while Tribal Gaming appears to have taken share from the LV Strip, neither Regional Tribal or LV Strip revenues were immune from the economic crises affecting consumers that led to a decline during 2008 and continues into 2009. While we expect CA tribes to be a competitive threat to the LV Strip, a bigger factor and influence on LV results is the overall economic performance for CA and economic climate in CA for consumers. Looking forward, resumption of GDP growth for CA and overall economic conditions for the consumer will have a bigger impact on Tribal Gaming and LV Strip revenue growth than share adjustments between the two markets. The big question for the LV Strip looking forward is when and at what magnitude will conditions improve for CA.<br />Recent LV Strip, CA and U.S. Data points <br />We have summarized recent and most current LV Strip volume related and CA & U.S. macro data points. Current data points influence consensus company, industry and macro economic forecasts. A significant current LV Strip industry issue is upcoming supply and demand and potential market share adjustments between operators, owing to the large amount of supply that is soon to enter the market. As a result, industry volume related data points will continue to be important for investors and will continue to impact 2009, 2010 & beyond, company estimates, future enterprise value forecasts and therefore current stock prices.<br />At the macro level both nationally and for CA, unemployment/employment data is crucial as it is a current significant economic issue with plenty of news flow surrounding it. A better/worse than expected current data point can have a meaningful impact on macro and possibly industry forecasts. Other current crucial data points are housing related in terms of new/existing home sales & prices and foreclosure/delinquency data. While the market does not seem to be currently focusing on gasoline prices, we believe it is worth noting that we observed that gasoline prices have moved back up over $3.00 per gallon in Southern CA, despite the severe economic slowdown.<br />Unemployment<br />We have compared Southern CA, CA and national unemployment data to LV Strip industry volume data in graphs. For measured data points between January 2008 – July 2009, unemployment has steadily increased while Strip volume indicators have simultaneously decreased. The latest unemployment data points in CA continue to be incrementally and sequentially negative. Forecasts we surveyed indicate that unemployment in CA will continue to rise from current high levels and reach peak levels sometime during the second half of 2010. We view this as a serious issue and one that could put 2010 LV Strip estimates at risk with the possibility of of a further dampening of visitor volume and spend per visit. As we expect this issue to be significant, forward monthly data points that are “less worse” than expected would be positive.<br />Exhibit 19: Southern CA unemployment & LV Strip Volume metrics<br />Source: LVCVA, NGCB, CA Employment Development Department and Carlson Research calculations<br />U.S. and California Housing Market Data<br />Recent data points (i.e. housing starts, new/used home sales and credit spreads) suggest that the U.S. housing market may be at or may have reached a bottom during the first half of the year. The Mortgage Bankers Association recently indicated however, reported a contra indicator by indicating that while home price declines appear to be moderating in more and more cities, prices may not reach bottom soon. In regard to new national home sales trends, Toll Brothers in a recent conference call, took more optimistic stance, reporting that several of their internal company leading indicator home building metrics in several (but not all of their national markets) have improved (CA was not included in this list). On the negative front, mortgage foreclosure and delinquency indicators continue to throw off negative incremental signals. Significant broadening/incremental delinquency/foreclosure risks also exist in prime borrower categories due to forecasted increased rates of unemployment and expected incremental downward adjustments in home values. On August 21, the Mortgage Bankers Association (MBA) reported that a potential new round of foreclosures could delay the U.S. economic recovery as more than 13% of U.S. mortgage holders were delinquent on their mortgages and were in the process of having their homes repossessed during the 2nd quarter of 2009. MBA reported that CA’s rate is the highest in the nation at 15.2%. <br />CA trends appear to be a mixed bag and worse than national tends as the housing market is not yet out of the woods and is likely to emerge from the trees later than other regions of the U.S. On the positive side, recent Southern CA data suggests that the existing home market may be bottoming in Southern CA as sales and prices have ticked up in recent months while new homes sales and housing starts remain sluggish. <br />Exhibit 20: YOY LV Strip Volume Metrics and Southern CA New/Existing Home Sales & Prices <br />Source: LVCVA, NGCB, LAEDC and Carlson Research calculations<br />Data regarding delinquencies and foreclosures remains sequentially and incrementally negative with recent CA data points throwing off scary signals. On August 25, TransUnion (a big 3 credit reporting agency) indicated that mortgage delinquencies will continue to rise over the balance of 2009 and set record’s at year end as 60 day + delinquent mortgages skyrocket from 9.7%/10.7% at the end of June to 14%/14% (CA/Southern CA) by year end 2009. For the Inland Empire area of Southern CA, numbers are staggering as 16.5% of mortgages in Riverside County were 60 days delinquent at June 30, 2009. By comparison, the delinquency rate for the 1st quarter of 2007 was 2.6%, which was close to the typical normal historic national rate.<br />Exhibit 21: Mortgage Bankers Association, U.S. 2Q09 Past Due and Foreclosed Mortgages<br />Source: LA Times and Mortgage Bankers Association<br />The data described here is similar in tone to the brutally negative Deutsche Bank forecast re: potential for doubling the number of negative loan to value homes in the U.S. to 48%, which would in turn further drive incremental delinquencies in prime borrower and other categories. As a result, we will monitor this issue plus the large prospective mortgage reset data previously mentioned in this report as they could pose a serious incremental risk to consumer discretionary spending and therefore LV Strip volumes looking forward.<br />Survey of California/Southern California Economic Forecasts<br />We surveyed CA focused recent general economic forecasts authored by UCLA, the University of CA at Santa Barbara, the University of Arizona and the Los Angeles County Economic Development Development Corporation (LAEDC)(2). We also viewed forecasts re: CA housing and employment from DataQuick and the Mortgage Bankers Association. We also sourced data and opinions published in the general Southern CA media including the LA Times and the Orange County Register in order to develop a current view of consensus 2010 forecasts for CA. <br />In summary, the current look forward view is negative with unemployment and housing delinquency issues looming as larger negatives that are not forecasted to bottom out until late 2010 for employment/unemployment with the delinquency problem peaking in the future as early as late 2009 to possible 2011 as there appears to be less consensus on this issue. Most all if not all industries are lagging in 2009 and are expected to continue to struggle during 2010 including, construction, manufacturing, retail, leisure and hospitality. As CA struggles with it’s budget crises, we noted in recent trips significantly increased sales tax rates and government fees (beach parking for example), therefore putting incremental stress on consumer household budgets. Over the summer of 2009, although not widely reported in the national media, we also noted an increase in gasoline prices to range of $3 - $3.25 in Southern CA. <br />We have surveyed a current forecasted unemployment rate for 2010 at 12% - 13% (2010 average). For housing, while new home construction is expected to stay gloomy, existing home sales may have reached a bottom with some possible price stabilization? We did not survey anyone that we believe can reliably predict the timing of a housing upturn as the risk of additional foreclosures driven by increased unemployment will remain. While agriculture was reasonably strong in 2008, the industry has significantly weakened during 2009 owing to lower demand, pricing and exports. The technology and aerospace industries have been a mixed bag in 2009 as demand for technology weakened offset some by military related aerospace activity. Tourism has declined sharply during 2009 putting several well known hotels/resorts in well publicized bankruptcies or at risk for bankruptcy. <br />The commercial real estate sector is expected to continue to slow as it struggles with declining vacancies, lack of financing and falling property values therefore trigging an increase in foreclosures. State and local governments will also remain under stress with service and staff cuts looming.<br />International trade through Sou CA two major ports weakened throughout 2008 and then declined sharply during 2009. Overall trade via air/rail/ships is expected to decline approximately 16% during 2009. This is a significant measure not only for CA’s economy but for the U.S. and Asian economies as well. Container shipments at Sou CA’s two major port’s are off approximately 21% YTD as the ports are some of the largest and most significant in the world and the busiest in the U.S.. As a result, they are significant barometer of overall CA, Sou CA, U.S., Asian and worldwide economic health. Beyond the negative YTD numbers, the latest port data points are equally negative having yet to show signs of incremental improvement. The Port’s of Los Angeles (LA) and Long Beach (LB) recently commissioned an economic forecast provided by Tioga Group and HIS Global Insight that forecasted that port volumes would not return to 2006 peak levels anytime before 2013. Quoting HIS, the LA Times indicated on August 17 that four more years of recovery will be needed to repair the damage caused by the worst global recession in 60 years. The Times, quoting HIS went on to say that, “ there is no pent up consumer demand that will drive international trade as a big engine of growth it once was”. <br />Imports will bottom and begin to improve once U.S. retailers incrementally increase their Asian orders late this year while exports will not improve until global financial and economic conditions improve some. HIS and LAEDC are forecasting single digit modest improvement in shipping (port) related trade growth in 2010. Recent 2009 data points remain significantly negative as no bounce off the bottom has yet to be reported.<br />Exhibit 22: Latest/Recent Monthly LA Port Container Volume<br />Source: LA/LB port data & Carlson Research calculations<br /> Exhibit 23: ($’s in billions) Value of Goods through LA Ports/Rail/Air & YOY Container Volume <br />Source: LA/LB port data, LAEDC trade data & Carlson Research calculations<br />Consumer spending for the U.S. is to remain under stress due during 2009 due to rising unemployment rates, zero wage growth and weakening household balance sheets tied to declines in home equity and values of financial assets. LAEDC and others are forecasting some recovery in late 2009 for the U.S., with modest growth in 2010 tied to tax relief and extended unemployment benefits connected with the federal stimulus program. For CA, LAEDC is basically forecasting just above zero growth in total personal income and total per capita income for CA/Southern CA for 2010.<br />Exhibit 24 : YOY Total Personal Income by County in Southern CA & Historic Gaming Revenue<br />Source: LAEDC & Carlson Research calculations<br />Exhibit 25: YOY Total Per Capita Personal Income by County In Southern CA<br />Source: LAEDC & Carlson Research calculations<br />In summary, the near term outlook in CA is pretty bleak with some forecasts indicating a bottoming out of CA GDP (GDP goes flat) during late 2009, very modest recovery with significant GDP growth not occurring until 2011. As the the Southern CA economy is 300 miles from the LV Strip and contributes approximately 25% of the visitation combined with the fact that CA’s GDP is also the 5th largest in the world and home to major trade lanes, it is hard to see significant growth resume on the LV Strip without overall economic improvement there.<br />California GDP & Other Economic Metrics and Relationship to the LV Strip<br />For the U.S. as a whole, historically, there has been a relatively strong correlation between nominal GDP growth and gaming growth in terms of direction with volatility as to magnitude (6). For CA, since the peak in 2006/2007, CA gaming revenues have rolled over at a rate comparable to CA retail sales and at a significantly higher rate (at a greater magnitude) than CA nominal GDP and personal income. Current forecasts of personal income that we reviewed range between breakeven/minimal growth (1% YOY) to potential negative growth for 2010. Forecasts of nominal GDP we surveyed for 2010 range from just above zero to negative 3.7% growth. Surveyed economic forecasts for CA for 2010 and beyond generally indicate that CA will lag an overall U.S. recovery despite some possible back end 2009 smaller negative GDP forecasts. Based on recent history and due to the nature of the current state of the recession (where unemployment in CA continues to rise and will continue to increase from current levels well into 2010), we are not forecasting that gaming industry revenue trends for CA sourced gaming revenue will significantly vary from recent relationship patterns. As a result, we are forecasting a negative YOY growth rate for CA sourced gaming revenues for 2009 and flattish to possibly negative growth for 2010. <br />Exhibit 26: CA GDP, Personal Income & YOY CA Sourced Gaming Revenue Growth (dollars in billions)<br />Source: LAEDC, UC Santa Barbara economic forecast, Carlson Research calculations<br />Recent Observations from Southern CA<br />It would be wrong to judge any region as big and complex as Southern CA, solely on anecdote’s collected during recent visits. Yet our encounter with Southern CA was generally consistent with current negative headlines, data points and forecasts. During a recent trip, restaurants we visited were quiet during historically peak day/hour periods. Theme park attendance appeared to be smaller in San Diego as evidenced by shorter lines than previous years. We also noted increases in consumer costs for gasoline plus costs tied to budget issues as sales tax rates and various state park parking fees for example, were increased. Individuals we talked to were generally negative as to near term personal job prospects and or income growth. We also heard the TV & movie industries have suffered as production has been significantly decreased and possibly decreased on a permanent basis as work is being shifted outside of Southern CA. The local news flow was consistently reporting negative current economic stories in the region. The overall mood was generally fearful. On the tribal gaming front, local tribal casinos appear to be using promotional techniques and other tools to draw business, such as bus programs, entertainment and amenity offerings, that are similar to Nevada. <br />Recent Arizona (AZ) Economic Indicators<br />We also made a pass through recent AZ indicators that were compiled by the University of AZ. According to LVCVA visitor surveys, approximately 9% of LV Strip visitors originate from AZ. <br />On June 1st, the University’s chief forecaster discussed 1st quarter data as Q2 data was not yet available and indicated that “green shoots” are not yet visible at the state level. The outlook is that the economy will stage a moderate recovery after a bottom forms sometime during Q209 – Q309. Specifically:<br />After recent YOY losses, personal income growth will be miniscule in 2010 at .2% followed by a 4% gain in 2011.<br />AZ currently ranks 50th in job growth. Unemployment is expected to continue to rise and reach 11% by 2009 year-end, remain high in low double digits to high single digits during most of 2010 and then eventually decline to 6%, but not before 2012.<br />In housing, some signs of improvement are evident as existing homes sales have increased while supply has decreased from recent peaks.<br />While a robust near-term recovery is not forecasted, the forecasters expressed some confidence that recent stimulus measures will work to improve overall conditions.<br />While AZ retail sales have significantly declined, the forecasters are predicting a rebound in 2010.<br />Like CA, AZ has endured bleak conditions. While housing may be bottoming, a key consumer related metric, unemployment, continues to decline. The recent overall economic forecast calls for slowing overall economic decline in the latter half of 2009 with some very moderate growth during 2010. As unemployment and wage growth will remain an issue, in a recent presentation, the University forecasters concluded by saying, “remember to tell your children that graduate school is the most respected form of unemployment.”<br />Based on this forecast, we do not expect the AZ economy to be a big driver of YOY AZ LV Strip visitation/spend during 2010.<br />MGM Estimates on the LV Strip<br />We are not in the build it and they will come camp as we believe macro economic challenges will trump incremental visitation that City Center may drive to the LV Strip during 2010. In short, we are not betting on 2010 6% - 10% market growth as we “take the under” and remain in the less than the 6ish% overall market growth camp. Due to expected high level of interest, we expect that City Center will take share from it’s principal competitors and possibly from existing MGM LV Strip properties as well. We expect pricing pressure to persist into 2010 with some improvement on the LV Strip in 2011 tied to a California and national economic recovery. Based on the macro forecasts we have reviewed, and due to the fact that we are forecasting further delay’s and potential scale down of competitor projects like Fontainebleau and Echelon, we are willing to bet that 2011 will be incrementally better for MGM and others on the LV Strip than 2010.<br />Due to the high level of estimate uncertainty, we expect to continue to see a high degree of volatility in MGM quarterly street estimates looking forward. Please contact us for additional information regarding our estimates. <br />References:<br />UCLA is UCLA’s Anderson school quarterly CA economic forecast.<br />LAEDC is the Los Angeles Economic Development Corporation. LAEDC is a well known CA economic forecasting and business development organization that is focused on business and job development in Southern CA. We reviewed various LAEDC compiled historic data and their 2009 mid-year 2009 -2010 economic forecast.<br />In a recent conference call, while Toll Brothers reported some improvement in forward new home order metrics in some regions, CA was not included in the commentary. <br />DataQuick is a nationally known real estate research organization.<br />We reviewed the latest available Arizona data, forecast and opinion from the University of Arizona – Eller school. <br />Per Goldman Sachs, April 9, 2008 “The Essentials of Gaming Investing” report. <br />First American CoreLogic – a Southern CA real estate research organization.<br /> <br />Risks and disclosures<br />The thesis and opinions expressed in this report reflect my personal view. No part of my compensation was directly or indirectly related to specific recommendations or views expresses in this research report. Readers should consider this report as only a single factor in making investment, business and/or economic decisions. As we are not your advisor we do not take responsibility for any action you take based on this report. This publication is provided to you for information purposes only. The views in this publication are those of the author and are subject to change, and the author has no obligation to update the opinion or information in this publication. The author does not accept liability for any direct or indirect losses arising from use of this publication or it’s contents. The author recommends that readers of this report consult with any personal advisor’s they deem necessary before taking any actions based on this report. Actual results may and are likely to be materially different than those indicated in this report. We have received no compensation from the companies mentioned in this report and do not have an economic and/or advisory relationship with MGM and/or other companies mentioned in this report. We currently do not own shares in any of the companies mentioned. Finally the author does not provide tax or financial advice and nothing contained herein should be construed to be tax or financial advice.<br />City Center, Las Vegas Strip, May 2009<br />Source: Carlson photo<br />