Using case-based methods to assess scalability and sustainability: Lessons fr...
Visualizing Participation and Impacts_CadmusPoster_KDv05
1. www.postersession.com
• Are programs having
intended effect?
• Are some areas or
demographics over‐ or
under‐served?
• Are certain customer classes
getting as much out of
energy efficiency fund as
they are putting in?
• Are individual PA
participation rates similar
to the rest of the state
(benchmarking)?
• Produce a unified view
of participation, energy
savings, and incentive
spending for all residential
efficiency programs
implemented by eight
different electric and
gas efficiency program
administrators (PAs) in
Massachusetts.
• Illustrate participation,
energy savings and
incentive spending so
each PA can see
results in its territory.
• Produce analysis on the
frequency of participation in
multiple programs and
which programs are most
commonly first.
• Contextualize participation,
energy savings, and incentive
spending by census block
to account for varying densities
of residential accounts.
• Support additional analysis
with unified premise‐level
data and aggregated census
block data.
Visualizing the Participation and Impacts
of a Statewide Residential Portfolio
WHAT DID WE LEARN?
• Master metered
multifamily buildings
• Upstream programs
require modelling
• Snapshot in time does
not provide full story
• Data sources with different
formatting, business rules,
time periods, reporting
practices
• Reconciling raw source data
to processed and aggregated
program filings
PUTTING RESULTS
INTO OPERATION
Marketing
Segmentation
Unified in a
single site
address
through
RCPS
Previous participation in an
electric program with Utility A
Previous participation in a
gas program with Utility B
Whole premise is identified
as previous participant
regardless of fuel type
Variables are
entered into
analytics
software
Value of doing this exercise over multiple years is to inform
implementation methods, observe effects over time.
2013 2016 (example)
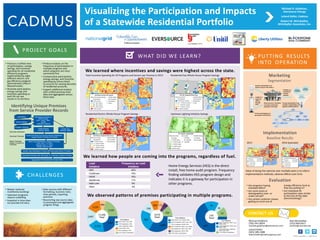
We learned where incentives and savings were highest across the state.
Lead
Initiative
Frequency as Lead
Initiative
HES 42%
CoolSmart 19%
HEHE 16%
Appliances 11%
Heat Loan 9%
Other 4%
We learned how people are coming into the programs, regardless of fuel.
Home Energy Services (HES) is the direct
install, free home audit program. Frequency
finding validates HES program design and
indicates it is a gateway for participation in
other programs.
Identifying Unique Premises
from Service Provider Records
Michael R. Goldman,
Eversource Energy
Leland Keller, Cadmus
Robert M. Wirtshafter,
Wirtshafter Associates, Inc.
CHALLENGES
Implementation
Baseline Results
Evaluation
PROJECT GOALS
Total Incentive Spending for All Programs and Sectors per Premise in 2013 Residential Gas Whole House Program Savings
Residential Electric Whole House Program Savings Upstream Lighting Initiative Savings
Michael Goldman:
(781) 441‐8024
michael.goldman@eversource.com
Leland Keller:
(303) 389‐2488
leland.keller@cadmusgroup.com
Bob Wirtshafter:
(215) 840‐6417
wirtino@comcast.net
CONTACT US
Housing
Characteristics
Previous participation is key
variable in segmentation and
targeted marketing efforts
3,220
3,537
15,396
Total
2,723
2,697
2,235
984
356
1,009
3,018
Total
962
358
269 175 159
57
362
536
Total
81
36
We observed patterns of premises participating in multiple programs.
Customer
Demographics
Previous
Participation
Aggregated MA Residential Premise Table
Generate Addresses
Generate Premises
Match Premises,
Assign Providers to
Premises
Standardize Address to
USPS format:
Line1, Line2, Town,
GeoID
Latitude/Longitude
Create Electric
Address Tables
Create Gas
Address Tables
Create Premises from Unique Electric Addresses,
Assign Electric Provider to Premise
Match Gas Addresses to Electric Premises:
First: Line 1 + 2 Town
Second: Line 1 + Town
Assign Gas Provider
Gas Billing
Electric Billing
Program Tracking
Identify Gas Addresses in Towns with Municipal Electric Providers
Generate Premises with “Municipal” or “Unknown” Electric Provider
Four Initiatives
(68%) CoolSmart, HEAT Loan,
HEHE, HES
(15%) Appliances, HEAT Loan,
HEHE, HES
(7%) Appliances, CoolSmart,
HEAT Loan, HES
(11%) Other Combinations
Three Initiatives
(33%) HEAT Loan, HEHE, HES
(23%) CoolSmart, HEAT Loan, HES
(12%) CoolSmart, HEHE, HES
(9%) CoolSmart, HEAT Loan, HEHE
(6%) Appliances, HEAT Loan, HES
(5%) Appliances, HEHE, HES
(12%) Other Combinations
Two Initiatives
(23%) HEAT Loan, HES
(18%) Appliances, HES
(18%) CoolSmart, HEHE
(15%) HEHE, HES
(6%) CoolSmart, HES
(21%) Other Combinations
IEPEC Long Beach | August 2015