
Recommended
Recommended
More Related Content
Similar to Wave process cycle and_market
Similar to Wave process cycle and_market (20)
Recently uploaded
Recently uploaded (20)
Wave process cycle and_market
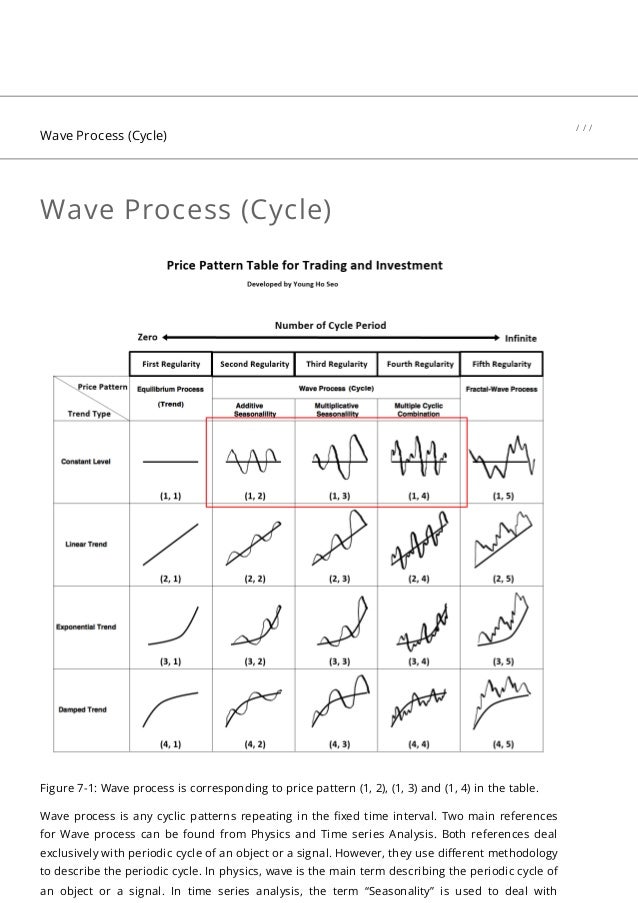
- 1. Wave Process (Cycle) Figure 7-1: Wave process is corresponding to price pattern (1, 2), (1, 3) and (1, 4) in the table. Wave process is any cyclic patterns repeating in the fixed time interval. Two main references for Wave process can be found from Physics and Time series Analysis. Both references deal exclusively with periodic cycle of an object or a signal. However, they use different methodology to describe the periodic cycle. In physics, wave is the main term describing the periodic cycle of an object or a signal. In time series analysis, the term “Seasonality” is used to deal with Wave Process (Cycle) / / /
- 2. seasonal fluctuations in the price series. In the Price Pattern Table (Figure 7-1), Wave Process covers both wave in Physics and seasonality in time series analysis. To better illustrate the Wave process, we provide simple description for Wave and Seasonality in this section. In Physics, Wave can be described by three independent variables, which are frequency, wavelength and amplitude. Frequency is the number of waves passing a point in certain time interval. Scientists and engineers normally use a time of one second. Therefore, number of waves passing a point in 1 second is described by the unit called Hertz. 1 Hertz equals to one Wave per second. Wavelength is the distance from any point on one wave to the same point on the next wave along. Amplitude is the height of wave from the top of a crest to the centre line of the wave. Figure 7-2: Description of Wave in Physics. Normally textbook will show you a clean sine or cosine wave function to describe the property of wave. In the real world, the wave often consists of multiple cyclic components. For example, Figure 7-3 shows the synthetic multiple cycles built by adding three Sine Wave Functions: Sine (2x) + Sine (13x) + Sine (30x). Many real world signals can have more complex cyclic structure than this example. In addition, many real world signal will exhibit decreasing or increasing amplitude to make your analysis more difficult as shown in Figure 7-4.
- 3. Figure 7-3: Synthetic Cyclic Function of Sine (2x) + Sine (13x) + Sine (30x). Figure 7-4: Synthetic Cyclic Function with increasing amplitude. In time series analysis, seasonal fluctuation is described with smoothing factor gamma and previous seasonal level. Alternatively, one can use multiple regression with dummy variable or artificial intelligence techniques for the same task. Figure 7-5 shows typical annual seasonal fluctuations in the data. This type of series can be modelling using either additive seasonality or multiplicative seasonality.
- 4. Figure 7-5: Annual Seasonal fluctuations in the price series. The ways to describe periodic wave in physics and in time series analysis are different. However, in fact, two concepts are still the very same thing. The main difference of the seasonality from the periodic wave in Physics is that seasonality are normally assumed to have some common seasonal period in calendar like hourly, daily, monthly or quarterly. Although modelling methodology might differ, the seasonality can be detected with Fourier Transformation and periodogram equally well. One disadvantage of seasonality in time series is that the math become quite complex if we have to model multiple seasonality. For example, if we have more than three distinctive seasonal fluctuations in our data, say hourly daily, weekly and monthly, then it is quite difficult to model using seasonal exponential smoothing model. At the same time, multiple periodic cycles present in price series can be modelled readily with combination of sine and cosine curve with various amplitude and wavelength. It is very difficult to observe any strong seasonality in Forex market data. It is probably because the currency markets are traded all years around with high trading volume. However, some weak form of seasonality might be observed from Stock market and commodity market. If any price series shows wave process (cycle), then it is important to define seasonal period, the time interval repeating its cycle. With the identified seasonal period, one can determine period where price stays below or above the seasonal average for your trading advantage. For example, in Figure 7-6, we can observe some bullish effect on April and December on S&P500 monthly data. It is rare for forex trader. However, there are still many group of traders looking for seasonality in Stock market.
- 5. Figure 7-6: Seasonal Effects of the S&P 500 monthly price series. Seasonality was extracted from the central moving average construction. Analytical Note The simplest ways to identify the seasonality is to draw seasonal plot as shown in Figure 7-7. To draw seasonal plot, one have to partition the price series into sub series each year when the seasonal period is annual. For example, if you have 20 years historical price series, then you will have 20 sub series for each year. Once you have partitioned the price series, create stacked plot of each sub series as shown in Figure 7-7. If your data has seasonality, then you will normally observe some patterns across each month. Complex methods of detecting seasonality include periodogram and Partial autocorrelation function.
- 6. Figure 7-7: Example Seasonal plot for 6 years of historical price series. Figure 7-8: Example Partial Autocorrelation Function exhibiting seasonality in the data. Red Circle indicates that 12-month cycle of price series. About this Article
- 7. Related Posts: Share this entry This article is the part taken from the draft version of the Book: Scientific Guide to Price Action and Pattern Trading (Wisdom of Trend, Cycle, and Fractal Wave). Full version of the book can be found from the link below: https://algotrading-investment.com/portfolio-item/scientific-guide-to-price-action-and-pattern- trading/ Fractal Pattern Scanner provides the way to measure the fractal cycles in forex and stock market data. In addition, the turning Point Probability and trend Probability can be measured with Fractal Pattern Scanner at every price action in your chart. For the simplest usage, Fractal Pattern Scanner can turn the simple support and resistance to the powerful killer strategy. Below is the landing page to Fractal Pattern Scanner in MetaTrader 4 and MetaTrader 5. https://www.mql5.com/en/market/product/49170 https://www.mql5.com/en/market/product/49169 https://algotrading-investment.com/portfolio-item/fractal-pattern-scanner/ Below is the landing page for Optimum Chart (Standalone Charting and Analytical Platform). https://algotrading-investment.com/2019/07/23/optimum-chart/ Related Products Volume Spread Pattern Detector Price Breakout Pattern Scanner Excessive Momentum Indicator Turning Point Detector
- 8. Scientific Guide to Price Scientific Guide to Price Action and Pattern Trading… Action and Pattern Trading… How to do Fractal Cycle How to do Fractal Cycle Analysis with Fractal… Analysis with Fractal… Introduction to the Wave Introduction to the Wave Principle Principle Pattern Inside Pattern Pattern Inside Pattern Analysis Analysis The Five Regularities in the The Five Regularities in the Financial Market Financial Market Mother Wave Detection Mother Wave Detection Setting Setting Mother Wave and Child Mother Wave and Child Wave with Joint Probability Wave with Joint Probability Stationary Process (No Stationary Process (No Trend) Trend) ● Customer/Member Login ● MetaTrader Products ● Optimum Chart ● Forex Market Prediction ● Harmonic Pattern Signal ● Free Download ● Free Trading Education ● Contact us ● About us Website Menu Search Contents By Keyword Enter Here
- 9. Recent Reviews by Martin Dobry Fractal Pattern Scanner MT5 1 Year by a15502286655 Fractal Pattern Scanner MT5 1 Year by Naomi T Optimum Chart Forex 1 Year by Harald Wenzl Time Box Indicator MT4 by Rafael C. Pair Trading Station - MT4 1 Month Name* Email* Subscribe and Get Discount Coupon © Copyright - All contents reserved by Algo Trading & Investment.