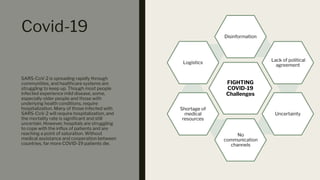
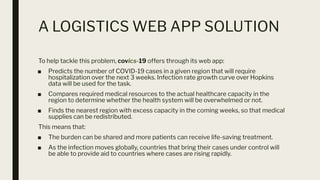
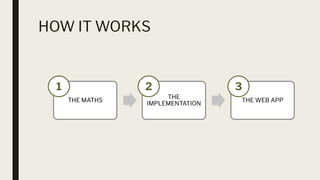
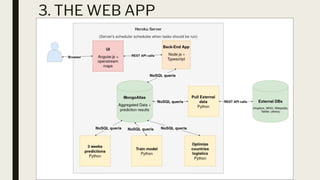
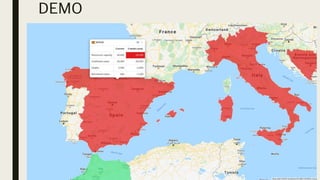
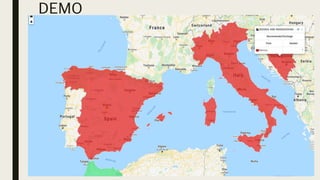
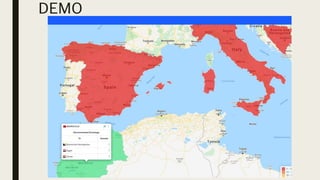
COVICS-19
INTERNATIONAL HEALTH-CARE LOGISTICS
COVICS-19
What does it offer?
SARS-CoV-2 is spreading rapidly through communities. Covics-19 matches
countries' required medical resources to their actual healthcare capacity and
coordinates medical resource sharing among them.
OUR
MOTIVATION
#HAVEANIMPACT
Covid-19
SARS-CoV-2 is spreading rapidly through
communities, and healthcare systems are
struggling to keep up. Though most people
infected experience mild disease, some,
especially older people and those with
underlying health conditions, require
hospitalization. Many of those infected with
SARS-CoV-2 will require hospitalization, and
the mortality rate is significant and still
uncertain. However, hospitals are struggling
to cope with the influx of patients and are
reaching a point of saturation. Without
medical assistance and cooperation between
countries, far more COVID-19 patients die.
FIGHTING
COVID-19
Challenges
Disinformation
Lack of political
agreement
Uncertainty
No
communication
channels
Shortage of
medical
resources
Logistics
OUR
PROPOSAL
#ORGANIZE
#COMMUNICATE
#COORDINATE
#SOLVE
A LOGISTICS WEB APP SOLUTION
To help tackle this problem, covics-19 offers through its web app:
■ Predicts the number of COVID-19 cases in a given region that will require
hospitalization over the next 3 weeks. Infection rate growth curve over Hopkins
data will be used for the task.
■ Compares required medical resources to the actual healthcare capacity in the
region to determine whether the health system will be overwhelmed or not.
■ Finds the nearest region with excess capacity in the coming weeks, so that medical
supplies can be redistributed.
This means that:
■ The burden can be shared and more patients can receive life-saving treatment.
■ As the infection moves globally, countries that bring their cases under control will
be able to provide aid to countries where cases are rising rapidly.
HOW IT WORKS
THE MATHS
THE
IMPLEMENTATION
THE WEB APP
1 2 3
1. THE MATHS
■ PREDICTION OF PATIENTS IN NEED OF IN-HOSPITAL MEDICAL CARE IN 3
WEEKS
Per-country:
1. Fit cumulative confirmed COVID-19 cases over time to logistic and
exponential curves (data courtesy of John Hopkins University CSSE)
2. Assess curve fit with r2
statistic
3. Use best-fitting curve parameters to make predictions of COVID-19 cases
for the next 3 weeks
4. Use country-specific proportion of deaths + recovery to cases to infer
COVID-19 deaths and recovery numbers for the next 3 weeks
Each day we can pull the latest JHU CSSE data, update the curve parameters
and make new predictions based on the latest data
1. THE MATHS
ITALY:
R2
: 0.9996
Infections today: 97,689
Predicted infections: 127,724
US:
R2
: 0.995
Infections today: 140,886
Predicted infections: 10,916,370!
SWITZERLAND:
R2
: 0.9999
Infections today: 14,829
Predicted infections: 17,895
1. THE MATHS
- Make sure that there is enough supply available while minimizing amount of
supplies exchanged. This requires solving an optimization problem.
- For example if Si
is the supply available at country i, we wish to find the
policy p which maximize their sum:
𝚺 Si
(p,t) = 𝚺 (Ii
-Casesi
(t)-Gp
(i,t)+Rp
(i,t)).
- In the above: Ii
is the initial supply, Casesi
is the predicted number of cases
and Gp
and Rp
represent the amount of supplies respectively given away and
received under the policy p.
- This problem shares some similarities with the famous knapsack problem in
that we are trying to fit a fixed amount of objects into an optimal
configuration.
1. THE MATHS
We also need to take the following aspects into consideration :
- Exchange of supplies takes time and this depends on the distance between
countries as well as many other factors (in general several days).
- We want to keep a certain amount of supplies as a buffer for any
unexpected spike in the demand.
- We also want to penalize each exchange to minimize the associated costs
and complexity.
2. THE IMPLEMENTATION
■ Casually met on Devpost and married same cause
■ Agile approach
■ Use case analysis
■ Business requirements for UI
■ Data source retrieval
■ Prediction model selection
■ Division of Tasks
– Python prediction model
– Logistics optimization problem
– Web App, UI and DB
– Roadmap
– Pitch
■ Communications, planning, tracking
– Our Slack, Trello Kanban Board, GitHub
3. THE WEB APP
HAVE A
LOOK
#INTUITIVE
#USERFRIENDLY
https://covics-19.herokuapp.com/
DEMO
DEMO
DEMO
THE TEAM #YOURCONTACT
INSERT PICTURE INSERT PICTURE INSERT PICTURE
Othmane Rifki
Physicist, DESY/CERN
Juliet Bowater
Data Scientist
Mohamed Zaim Wadghiri
Software Engineer, PhD
candidate - AI
Layla Hosseini-Gerami
PhD Candidate, Cambridge
Molecular Informatics
Piergiacomo, De Marchi
Software Engineer,
MyID - Credit Suisse
Alexandre DeZotti
London

Covics 19 final

  • 1.
  • 2.
    COVICS-19 What does itoffer? SARS-CoV-2 is spreading rapidly through communities. Covics-19 matches countries' required medical resources to their actual healthcare capacity and coordinates medical resource sharing among them.
  • 3.
  • 4.
    Covid-19 SARS-CoV-2 is spreadingrapidly through communities, and healthcare systems are struggling to keep up. Though most people infected experience mild disease, some, especially older people and those with underlying health conditions, require hospitalization. Many of those infected with SARS-CoV-2 will require hospitalization, and the mortality rate is significant and still uncertain. However, hospitals are struggling to cope with the influx of patients and are reaching a point of saturation. Without medical assistance and cooperation between countries, far more COVID-19 patients die. FIGHTING COVID-19 Challenges Disinformation Lack of political agreement Uncertainty No communication channels Shortage of medical resources Logistics
  • 5.
  • 6.
    A LOGISTICS WEBAPP SOLUTION To help tackle this problem, covics-19 offers through its web app: ■ Predicts the number of COVID-19 cases in a given region that will require hospitalization over the next 3 weeks. Infection rate growth curve over Hopkins data will be used for the task. ■ Compares required medical resources to the actual healthcare capacity in the region to determine whether the health system will be overwhelmed or not. ■ Finds the nearest region with excess capacity in the coming weeks, so that medical supplies can be redistributed. This means that: ■ The burden can be shared and more patients can receive life-saving treatment. ■ As the infection moves globally, countries that bring their cases under control will be able to provide aid to countries where cases are rising rapidly.
  • 7.
    HOW IT WORKS THEMATHS THE IMPLEMENTATION THE WEB APP 1 2 3
  • 8.
    1. THE MATHS ■PREDICTION OF PATIENTS IN NEED OF IN-HOSPITAL MEDICAL CARE IN 3 WEEKS Per-country: 1. Fit cumulative confirmed COVID-19 cases over time to logistic and exponential curves (data courtesy of John Hopkins University CSSE) 2. Assess curve fit with r2 statistic 3. Use best-fitting curve parameters to make predictions of COVID-19 cases for the next 3 weeks 4. Use country-specific proportion of deaths + recovery to cases to infer COVID-19 deaths and recovery numbers for the next 3 weeks Each day we can pull the latest JHU CSSE data, update the curve parameters and make new predictions based on the latest data
  • 9.
    1. THE MATHS ITALY: R2 :0.9996 Infections today: 97,689 Predicted infections: 127,724 US: R2 : 0.995 Infections today: 140,886 Predicted infections: 10,916,370! SWITZERLAND: R2 : 0.9999 Infections today: 14,829 Predicted infections: 17,895
  • 10.
    1. THE MATHS -Make sure that there is enough supply available while minimizing amount of supplies exchanged. This requires solving an optimization problem. - For example if Si is the supply available at country i, we wish to find the policy p which maximize their sum: 𝚺 Si (p,t) = 𝚺 (Ii -Casesi (t)-Gp (i,t)+Rp (i,t)). - In the above: Ii is the initial supply, Casesi is the predicted number of cases and Gp and Rp represent the amount of supplies respectively given away and received under the policy p. - This problem shares some similarities with the famous knapsack problem in that we are trying to fit a fixed amount of objects into an optimal configuration.
  • 11.
    1. THE MATHS Wealso need to take the following aspects into consideration : - Exchange of supplies takes time and this depends on the distance between countries as well as many other factors (in general several days). - We want to keep a certain amount of supplies as a buffer for any unexpected spike in the demand. - We also want to penalize each exchange to minimize the associated costs and complexity.
  • 12.
    2. THE IMPLEMENTATION ■Casually met on Devpost and married same cause ■ Agile approach ■ Use case analysis ■ Business requirements for UI ■ Data source retrieval ■ Prediction model selection ■ Division of Tasks – Python prediction model – Logistics optimization problem – Web App, UI and DB – Roadmap – Pitch ■ Communications, planning, tracking – Our Slack, Trello Kanban Board, GitHub
  • 13.
  • 14.
  • 15.
  • 16.
  • 17.
  • 18.
  • 19.
    INSERT PICTURE INSERTPICTURE INSERT PICTURE Othmane Rifki Physicist, DESY/CERN Juliet Bowater Data Scientist Mohamed Zaim Wadghiri Software Engineer, PhD candidate - AI
  • 20.
    Layla Hosseini-Gerami PhD Candidate,Cambridge Molecular Informatics Piergiacomo, De Marchi Software Engineer, MyID - Credit Suisse Alexandre DeZotti London