
Recommended
More Related Content
Viewers also liked
Viewers also liked (13)
Recently uploaded
Recently uploaded (20)
Site h charts
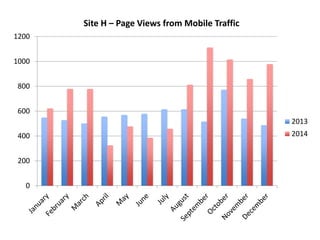
- 1. 0 200 400 600 800 1000 1200 Site H – Page Views from Mobile Traffic 2013 2014
- 2. 0 100 200 300 400 500 600 Jan-10 Jan-11 Jan-12 Jan-13 Jan-14 Jan-15 Site H – Session from Mobile Traffic Sessions
- 3. 0.00% 5.00% 10.00% 15.00% 20.00% 25.00% Site H - % of Mobile Traffic from All Traffic 2013 2014