MgCl2 and KCl Recovery from Brine Wastewater Treatment Process
1. University of Pennsylvania
Department of Chemical & Biomolecular Engineering
220 South 33rd
Street
Philadelphia, PA 19104
Dear Dr. Lee and Professor Fabiano,
The following document contains the process that we have designed as a solution to the design
project proposed by Arthur Rempel and Kyra Berger. This process predominantly treats brine
wastewater from desalination plants while simultaneously recovering a significant fraction of the
inlet water, and substantial amounts of both MgCl2 and KCl crystals. Our proposed process
contains three distinct separation phases; in the first, saturated brine wastewater is passed through
multistage flash evaporation vessels, which removes a vast majority of the NaCl in solution
alongside other impurities that may be present in the brine. Phase two utilizes crystallizer,
centrifuge and filtration units and operates under the premise that carnallite crystals
(KMgCl3*6H2O) will precipitate given the appropriate operating conditions. Subsequently, phase
two consists of the crystallization of KCl crystals after re-suspending the carnallite in solution.
Finally, phase 3 embodies the most essential crystallization of the process; MgCl2 crystals are
formed via a forced circulation capacity crystallizer. Our process estimates a net revenue of $2.6bn
annually from the recovered MgCl2 crystals alone, allowing us to not only compete, but transform
GE’s current Brine Concentrator System.
This document contains an intricate process design pertaining to our MgCl2 and KCl separation
unit in addition to GE’s Brine Concentrator. Furthermore, an in-depth economic and profitability
analysis was conducted in comparing our design to GE’s system; as a result, we have included
recommendations for the implementation of our plant while considering our competitor.
Our proposed plant will be located in San Diego, California, and is suited to treat 1-2mgd. From
an economic standpoint, the proposed plant has increased both GE’s ROI and NPV by
approximately 22.53% and $20,749,200, respectively.
Thank you for your assistance during this project.
_________________________ _________________________
Arthur Rempel Elyssa Gensib
_________________________ _________________________
Kyra Berger Aspen Walker
2. 1
MgCl2 and KCl Recovery from Brine Wastewater
Treatment
Arthur Rempel
University of Pennsylvania
Kyra Berger
University of Pennsylvania
Elyssa Gensib
University of Pennsylvania
Aspen Walker
University of Pennsylvania
Senior Design Project, CBE459
Project Submitted to: Dr. Daeyeon Lee, Prof. Fabiano
Project Proposed by: Arthur Rempel, Kyra Berger
Department of Chemical & Biomolecular Engineering
School of Engineering and Applied Science
University of Pennsylvania
April 12th
, 2016
3. 2
TABLE OF CONTENTS
ABSTRACT 5
INTRODUCTION 6
OBJECTIVE TIME CHART 11
MARKET AND COMPETITVE ANALYSIS 12
LIQUID DISPOSAL 12
LANDFILL DISPOSAL 14
EVAPORATION PONDS 14
ZERO LIQUID DISCHARGE 15
PROCESS SYNTHESIS 17
MAGNESIUM CHLORIDE MARKET 18
POTASSIUM CHLORIDE MARKET 20
ASSEMBLY DATABASE 22
THERMODYNAMIC PROPERTIES 22
UTILITY DATABASE 23
PRODUCTS DATABASE 23
PROCESS FLOW AND MATERIAL BALANCES 24
PROCESS DESCRIPTION 32
GE BRINE CONCENTRATOR 32
MGCL2 SEPARATION UNIT 34
UTILITIES 38
UNIT DESCRIPTIONS 43
GE BRINE CONCENTRATOR 43
HEAT EXCHANGERS 43
DEAERATOR 43
BRINE EVAPORATOR 44
5. 4
ACKNOWLEDGEMENTS 113
REFERENCES 114
APPENDIX A: SAMPLE CALCULATIONS 117
SIZING 117
COSTING 117
UTILITIES 120
APPENDIX B: ASPEN PLUS RESULTS 121
GE BRINE CONCENTRATOR SIMULATION FLOWSHEET 121
GE BRINE CONCENTRATOR INPUT SUMMARY 122
GE BRINE CONCENTRATOR BLOCK REPORTS 127
HEAT EXCHANGER DESIGN – GE BRINE CONCENTRATOR 141
HEAT EXCHANGER HEAT1 141
HEAT EXCHANGER HEAT2 144
HEAT EXCHANGER HEAT3 147
MGCL2 SEPARATION UNIT FLOWSHEET 150
APPENDIX C: INTMINERALS & CHEM CORP PATENT 151
APPENDIX D: MGCL2 EXCEL MATERIAL BALANCE 158
MANUAL MATERIAL BALANCE EXCEL SPREADSHEET 158
SAMPLE CODE 161
APPENDIX E: MATERIAL SAFETY DATA SHEET: BRINE 162
6. 5
Abstract
This project’s aim was to design an improved brine wastewater treatment system for desalination
facilities. While a multitude of methods exist to do so, General Electric (GE)’s brine concentrator is leading
the market by providing a method that not only treats the brine waste, but also recovers anywhere from 60-
94% of the water from the feed. However, their brine concentrator is relatively inefficient from both a
financial and energetic perspective; our goal was to develop a system to match their results, while limiting
costs and energy usage as best possible.
We subsequently designed a system (referred to from here on out as the ‘MgCl2 Separation Unit’)
to accomplish the aforementioned objectives. In addition to recovering pure water from concentrated brine,
our process also recovers high purity MgCl2 and KCl crystals that are later sold to alleviate the overall
process costs. The MgCl2 Separation Unit saw an increased ROI by 22.53% as compared to the GE Brine
Concentrator, as well as a surge in NPV of $20,749,200. Additionally, we estimate an aggregate equipment
cost of roughly $6,960,000, significantly less than GE’s $8,980,000, and utilities costs of $1,590,000
relative to their $6,920,000. The GE process deals with vapor phase water and thus relies on compressors
for pressure changes, which are costly in terms of energy consumption and capital costs, whereas our
proposed MgCl2 Separator Unit is limited to liquid/aqueous streams, eliminating the need for costly
compressors (from both an energy and economic standpoint). Finally, while both systems are fit to treat 1-
2mgd, the MgCl2 Separation Unit was optimized to recover roughly 84% of feed water, positioning itself
in the upper limit of GE’s possible water recovery spectrum.
7. 6
Introduction
Clean water sources have recently become a scarce commodity across the globe. Brazil has
reported its worst drought in the past 50 years [1], while South Africa expects a 32% downfall in
maize production this year alone due to a shortage of clean water. And, of course, California is
domestically affected, where all 12 of its clean-water reservoirs are at abnormally low levels (and
have been, for some time now).
One available method to produce clean water focuses on desalination. Desalination is a
process that removes salts and other minerals from untreated water, producing water that is clean
for both human consumption and irrigation [2]. Ocean water makes up approximately 97% of the
Earth’s total water supply [3], suggesting that desalination is an attractive option as a clean water
source - especially for coastal regions, like the three aforementioned areas.
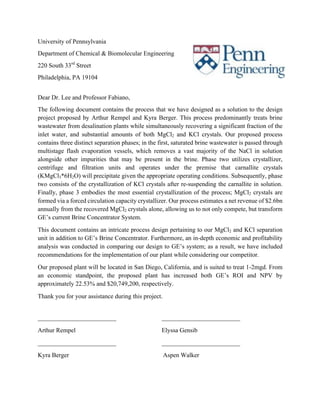
Desalination, depicted in
Figure 1, is typically conducted
either via multistage flash
thermal vacuum evaporation, in
which saline water is boiled at
extremely low pressures with
excess heat, or reverse osmosis
membrane separation (ROMS), a
process by which saline water is forced through a series of semi-permeable membranes at high
pressures to filter out salts, minerals, and residual metals. Currently, only 1% of the Earth’s clean
water supply is produced via desalination, although the UN predicts that by the year 2025, “14%
of the world’s population [will be] encountering water scarcity [4].” Furthermore, the Western
Figure1. General schematic of the desalination process
8. 7
Hemisphere’s largest desalination plant is projected to open in May of 2016 in southern California
[5], which will theoretically provide 50 million gallons of drinking water per day to the San Diego
county area.
Unfortunately, high costs (as compared to other clean water sources) accompany the
desalination process, predominantly due to inefficient energy consumption and ample wastewater
by-product, usually referred to as brine water. Brine water is highly concentrated salt water, which
also contains other impurities like precious metals that were used to purify the water during the
desalination process. Due to its high salt concentrations (typically about 30%, whereas ocean water
usually spans the 1-5% range), brine water will sink upon reentering the ocean, potentially
affecting marine life and posing major environmental concerns. Currently, a plethora of permits
and federal regulations are required for disposing brine water in sewer systems or in the ocean,
which contributes to the high economic and energetic costs associated with desalination.
In terms of energy consumption, the desalination process can consume as little as 3kWh/m3
(ROMS) [2], although this value can reach anywhere from 13.5 up to 25.5kWh/m3
, in the case of
thermal desalination. For context, fresh water supplies typically require a maximum of 0.2kWh/m3
for treatment, clearly much less than any desalination process and immediately rendering the
desalination process energetically costly.
With respect to financials, desalinated water costs on average $2,000 per acre-foot (1acre-
foot is about 3.26x10⁵
gal, or the equivalent amount of water consumed on average, annually by a
family of five) [5], which is four times as much as money spent on water from fresh sources; these
high costs typically arise due to the difficulty in managing the brine by-product. On average,
storage facilities charge between $2.00 and $2.50 to store one cubic meter of brine [8], which, in
the case of the aforementioned desalination plant, would equate to somewhere between $378,500
9. 8
and $473,125 per day, assuming that one gallon of brine is produced for every gallon of purified
water [5].
A series of brine management strategies exist and are implemented in desalination plants
across the globe, although they are highly dependent on a variety of variables: location, land
availability, air moisture content, legal/federal permitting requirements, and economic feasibility.
Brine concentrators and evaporation
ponds are attractive options; both
methods allow for additional water
recovery from brine wastewater (up
to 94%) [7], and completely remove
the salts from the environment “by
ultimately sequestering the remaining
brine in a landfill or in a closed and
sealed evaporation pond.” Thus, the combination of these brine concentrators and evaporation
ponds are deemed environmentally desirable. Figure 2 shows a general schematic of General
Electric’s brine concentrator [9].
Unfortunately, excessive costs and energy consumption are accompanied by these
environmental benefits, rendering these processes infeasible more often than not. Brine
concentrators typically consume between 60 and 100kWh per 1000 gallons of brine – assuming a
cost of $0.77/kWh, a brine concentrator will generally require $4600-$7700 per day to process 1
mgd (million gallons per day) of brine [8]. Or, in the case of the plant from above, a daily charge
between $230,000 and $385,000. Notice that these costs are between 20-40% lower than those of
the storage facility mentioned earlier, but they are not feasible or efficient by any means.
Figure 2. General Schematic of a brine concentrator
10. 9
Table 1 below further illustrates the high costs associated with treating 10 mgd of brine
with these two strategies as compared to other methods [7]. Additionally, Table 2 depicts the
energy consumption pertaining to all of the specified methods, clearly highlighting the excess
energy required for brine concentrators in comparison to the other methods.
Table 1. Costs of evaporation ponds and brine concentrators compared to other strategies
Table 2. Energy consumption of various brine-wastewater treatment methods
In addition to energy and management costs, brine wastewater also suffers from economic
opportunity costs via the lack of recovering useful byproducts. These byproducts may consist of
selenium, nitrates, gypsum and calcium compounds, which “are widely used in the building
industry for drywall, plaster, and cement [10].” Other byproducts could consist of magnesium salts,
which are useful in the medical industry, and boron, which is a recent hot topic in high-efficiency
electronics. Finally, if purified appropriately, any recovered sea salt could be sold as a raw material
to further increase profitability.
Brine wastewater regulations are ubiquitous across the United States; while they vary from
area to area, this plethora of strenuous legal regulations introduces an extremely costly step to the
desalination process. The San Diego Regional Water Quality Control Board oversees the
11. 10
regulation processes for the area in which our plant will be located. They mandate that the brine
wastewater salinity limit is less than or equal to 40%, or has a discharge dilution ratio of 7.5:1, in
order to be reintroduced into the ocean post-desalination. Additionally, the point of discharge must
be greater than 1,000 feet from the shore. [#]
It is inevitable to encounter a monetary loss when dealing with wastewater treatment.
Therefore, the overall target of a brine wastewater treatment system, like the GE brine
concentrator, is not to generate a profit; rather, the goal is to abide by the environmental regulations
and restrictions in the least costly way possible.
The purpose of this design project was to transform the brine concentrator/evaporation
pond system by designing a new system that is more efficient in terms of both energy and cost,
since the environmental benefits are unprecedented among other common brine-management
techniques. If possible, this would not only be economically attractive to investors and desalination
firms, but would also give rise to a new, affordable, clean, and abundant water resource.
12. 11
Objective-Time Chart
The goal of this project was to create a brine wastewater management system that is more
economically and energetically sustainable than current systems in the industry. The scope of this
project includes completing an analysis of the most profitable recoverables from salt water, the
modeling and financial analysis of the one of the leading methods of brine wastewater management
created by GE, designing a process to recover MgCl2 and KCl from brine wastewater, and
determining the financial feasibility of a plant that recovers MgCl2 and KCl in comparison to the
financial obligations associated with GE’s system. Project leaders are Arthur Rempel, Kyra
Berger, Elyssa Gensib, and Aspen Walker.
Deliverable Description Date
Accomplished
Determine location for
plant/brine feed
composition
Analyzing difference between saline levels and
salt compositions of various potential water
sources to determine best location and water
source for plant
February 2nd
Model GE Brine
Concentrator
Determining equipment involved in GE’s brine
concentrator and creating the process flow
diagram in ASPEN with appropriate operating
conditions
February 16th
Identify profitable
recoverables
Research potential salt recoverables and
complete a cost analysis of potential revenue for
various compositions depending on water source
February 16th
Model MgCl2
separation from patent
Determine equipment involved in patent and use
Excel to calculate material balances for streams
March 22nd
Determine Utility
Requirements Needed
Size equipment for both the GE concentrator and
the MgCl2 separation system and determine
utility requirements for heating and cooling.
March 26th
Complete Financial
Analysis
Calculate fixed and variable costs for both
systems and determine NPV and ROI
March 30th
Complete Report April 12th
13. 12
Market & Competitive Analysis
In a survey conducted across 137 drinking water membrane plants in the United States with a
capacity of over 98 m3
/day, 48% discharge the brine to surface waters, 23% discharge to
wastewater treatment plants, 12% use land application, 10% use deep well injections, and 6% use
evaporation ponds. The only plants that used deep well injection and land application were located
in Florida, a reflection of the geological and climate conditions of the area. Wastewater treatment
facilities were used primarily by smaller plants, due to the limited capacity of the treatment plants.
The cost of these disposal methods ranged between 5-33% of the total cost of desalination. [11].
Figure 3 shows the various methods of wastewater disposal currently in use in Southern California,
ranging from ocean outfalls to brine
concentrators.
Liquid Disposal
This method of managing brine wastewater
involves discharging the brine either
downstream from the process, either into the
ocean or through deep well injection. These
methods are desirable due to the lack of
treatment of the brine required before
disposing the wastewater. Systems
involving a downstream wastewater
treatment facility of ocean discharge involve
a brine line or a sewer to transport the brine
which has some disadvantages. First, it can
Figure 3. Desalination plants and brine wastewater
treatments in Southern California.
14. 13
be challenging to find a wastewater treatment plant that has the capacity to treat the brine
wastewater depending on the volume of waste produced by the desalination plant. Additionally,
there can be issues surrounding regulatory requirements and acquiring appropriate permits for this
method of discharge. Ocean discharge is particularly challenging due to the potential effects on
the environment as a result of introducing highly concentrated, denser material back into the ocean,
potentially harming the ocean floor habitats; however, regulatory steps are put into place to limit
the environmental impact of the wastewater, which results in a less environmentally harmful
system of disposal. Deep well injection can be a viable alternative. This method has proven to be
environmentally safe, does not require pre-treatment of the brine, is simple to design and operate,
and has a minimal aesthetic impact on the local community. Deep well injection is complicated
due to the limited land availability and various geologic conditions to consider which results in
many regulatory requirements as well as
the need to obtain a permit. Building these
wells can be costly – the classification of
brine as an industrial waste requires
specific, more expensive construction
materials for the wells and an additional
well must be drilled to monitor the
disposal well. However, it is possible to
use abandoned or active oil wells that
already exist which can reduce costs
associated with construction of this
Figure 4. The cost for disposing 1mgd of brine wastewater
provided by Inland Empire Brine Line for a brine line
connection, a brine line truck dump, and a brine line disposal
for inland and non-inland plants [13].
15. 14
method of brine disposal [12]. An estimate of associated cost with disposing 1 mgd of brine
wastewater is expressed in Figure 4.
Landfill Disposal
Disposing the brine waste in landfills can be an feasible method of waste treatment. This method
requires little treatment by the desalination plant and transfers the responsibility of managing the
waste to the landfill facility. However, there is a large cost associated with transporting the
wastewater and using the landfill and there is a loss of potential revenue from disposing of
potentially valuable water along with the undesired salts in the brine. Additionally, the
classification of the brine as an industrial waste limits the use of incineration as a method of
disposal [12]. CDM Smith estimates that it would cost $230,000 per completed well and the
pipeline from the plant to the well for a well that sustains an injection rate of 200 to 400 gpm [14].
Evaporation Ponds
Evaporation ponds involve creating an artificial pond with a large surface area designed to use
sunlight to evaporate the water from the waste. This method of disposal has been widely used
historically in large part due to its simple design technologically. This process is limited by the
availability of land for use as an evaporation pond as well as the high cost associated with building
and maintaining this method of waste treatment due to the need to line the ponds to avoid being
classified as Class V wells in addition to the need to excavate the salt periodically, as seen in Figure
5. Additionally, there are concerns about potential groundwater infiltration, which can have an
effect on drinking water in the area. These evaporation ponds can also have an adverse effect on
16. 15
surrounding habitats and are considered aesthetically unpleasant by community members who live
near the plant [12].
Zero Liquid Discharge
Zero Liquid Discharge systems use mechanical or thermal evaporation in combination with
crystallization to reduce the
volume of the waste stream
and recover additional water
for use as a commercial
product. These systems are
desirable in that they have
been proven effective in
industry, they produce a
high-quality stream of
water, and require less space
than other traditional
methods. However, they have high capital cost as well as high operation and maintenance costs,
primarily due to the costs associated with the energy requirements for operating the system as seen
in Table 3 and Table 4 [15].
Figure 5. Cost of Capital and Operation and Maintenance Costs for Evaporation and Landfill methods
versus Deep Well Injection [14]
17. 16
Table 3. Capital Costs for a 0.2mgd Zero Liquid Discharge system in 2006
Cost 0.2 mgd 1.0 mgd 5.0 mgd
Total Capital Cost Including
Equipment Installation
(in USD)
6,170,000 20,681,000 59,826,000
Costs provided by Big Bear Area Regional Wastewater Agency for a 0.2mgd system in 2006. Costs for additional flow rates estimated using the
following formula: Cost 2 = (Flow 2/Flow 1)^0.66*Cost 1, where Flow 1 is 0.2 mgd [15].
Table 4. Operation and Maintenance Costs for a 1 mgd Zero Liquid Discharge system
Component
Operation and
Maintenance Cost
(USD/year)
Power 4,844,000
Parts 1,035,000
Chemicals 282,000
Maintenance 621,000
Labor 225,000
Total 7,007,000
Costs provided by GE-Ionics based on a feed flow of 1 mgd [15].
18. 17
Process Synthesis
Comprehensive research was conducted to analyze the current methods of wastewater
treatment and identify the superior system to use as a preliminary model for brine disposal. Zero
Liquid Discharge (ZLD), shown in Figure 6 was one of the most widely used methods of treatment
and allowed for recovery of water to be used towards additional revenue.
Additionally, GE’s ZLD equipment is effective in treating a wide variety of waste flows
and is more energy-efficient than other single-effect evaporators current in the market. GE’s
system is limited in that it is not designed to recover specific salts from the original brine waste
stream. Various salt recoverables were considered, including MgSO4, Lithium, Bromine, LiCO3,
gypsum, CaCl2, and MgCl2. A preliminary analysis of potential revenue from various salts in
multiple locations was conducted, and the results are shown in Table 5. MgCl2 was chosen for
Figure 6. Diagram of GE Brine Concentrator System [21]
19. 18
further research due to its high profitability, its prevalence in ocean water, and its extensive patent
literature regarding separation methods.
Table 5. Brine Recoverables with Annual Revenue at Various Locations
Product Location Body of
Water
Flow
Rate
(mgd)
Mass
Recoverable
(metric
ton/day)
Annual
Revenue
(USD/year)
99.5% pure
MgSO4
San Diego Sea 1 13.1 $2,860,000
Cape may Groundwater 1 12.4 $2,720,000
MgCl2 San Diego Sea 1 20.5 $2,610,000
CaCl2 San Diego Sea 1 3.6 $264,000
Cape May Groundwater 1 3.4 $250,000
Lithium Atacama, Chile Salt flat 0.05 0.3 $436,000
Saratoga Springs, NY Groundwater 0.05 0.2 $374,000
Green River, WY River 0.5 0.2 $311,000
Hombre Muerto,
Argentina
Salt lake 0.05 0.1 $162,000
Rincon, Argentina Salt lake 0.05 0.1 $103,000
Great Salt Lake Salt lake 0.05 0.01 $14,000
Lithium
Carbonate
Silver Peak, NV Dry lake 0.05 0.04 $62,000
Gypsum San Diego Sea 1 5.6 $61,000
Cape May Groundwater 1 5.3 $58,000
Bromine Searles Lake Dry lake 0.05 0.2 $117,000
Magnesium Chloride Market
There is an existing and robust market for MgCl2. Approximately 60% of magnesium
compounds produced annually are extracted from seawater and brine [16]. The demand for MgCl2
exists in many industries. One important use of MgCl2 is as a mineral supplement. The production
of mineral supplements is a $2.3 billion industry. Nutrition experts state that magnesium is the
fastest-growing supplement in the mineral category [17].
The United State Geological Survey estimated that salt production was a $2.2 billion
industry in 2014. Approximately 43% of all salt sales are attributed to road de-icing. The state
20. 19
and local governments spend over $2.3 billion to control snow and ice annually, mostly due to the
prices for salt. The market is also stable – salt contracts often involve an 80% delivery acceptance
rate, guaranteeing demand from state and local agencies. These agencies are compelled to
purchase these large quantities of salt due to the reductions in crashes and accidents, which are
estimated to be reduced by up to 88% with the addition of salt on the roads. Additionally, a city
can spend between $300 million and $700 million per day of unusable roads [18].
The market for MgCl2 can be considered fairly stable. In 2014, the domestic salt market
produced $2.2 billion annually, with highway deicing consuming 43% of the total salt produced
[19]. In 2015, the production increased by 6%, resulting in $2.3 billion in product, 46% of which
went towards highway deicing [20]. This increase in market demand was one reason why we
chose MgCl2 as our primary recoverable from brine.
The other consideration for MgCl2 is how far away the demand is from our production site
in San Diego. Despite the lack of precipitation in San Diego, the Sierra Nevada mountain range
spans most of the state of California and has an average annual snowfall of over 48 inches, as seen
in Figure 7 [21]. The areas in this range would provide a stable market with high demand for our
MgCl2 product.
21. 20
Figure 7. Average annual snowfall in the contiguous United States of America.
Potassium Chloride Market
The main source of consumption of KCl is in the form of potash – a fertilizer comprised of
60-62% KCl. The estimated global consumption of potash in 2013 was 33.4 Mt, a $12.7 billion
industry. There are few adequate substitutes for KCl, making it a product with stable demand. The
International Fertilizer Industry Association projected that potash consumption will increase at a
rate of 3.6% per year through 2018 [22].
Additionally, potassium chloride is a mineral supplement, part of the same $2.3 billion
industry as MgCl2. KCl is used to prevent low amounts of potassium in the blood in an attempt to
protect the body’s cells, kidneys, heart, muscles, and nerves [23].
Patent for Separating MgCl2 and KCl
The separation of MgCl2 from brine is patented under U.S. Patent 2479001 (see Appendix C. for
full patent) originally published in August of 1949. This method, shown in Figure 8, uses a multi-
effect evaporator to recover significant quantities of water from the brine wastewater and forms
carnallite, a critical component needed to produce MgCl2.
22. 21
Figure 8. Sketch of process for separation of MgCl2 from U.S. Patent 2479001 [25]
This process uses a series of crystallizers and filters to separate both KCl and MgCl2 from
the brine waste stream, which can both be sold to offset the high operation and maintenance costs
associated with these energy-intensive systems.
23. 22
Assembly Database
Thermodynamic Properties
For the GE Brine Concentrator system, all transport and thermodynamic data was
generated using Aspen Plus V8.8 Model’s embedded electrolyte package. The ELECNRTL
thermodynamic method was used to estimate the thermodynamic properties of all of the streams
present in the simulation; ELECNRTL uses NRTL as the standard equation of state when
estimating gas properties, and subsequently assumes standard electrolyte chemistry when doing so
for liquids and aqueous solutions. The ASPEN simulation generated for the GE brine concentrator
can be found in Appendix B in more detail.
For the MgCl2 separation process, ASPEN Plus was used to model all transport and
thermodynamic data except solubility data. Figure 9 was generated to determine the relationship
between the solubility points of NaCl, MgCl2, and KCl.
6
7
8
9
10
11
12
0 10 20 30 40 50 60
mol Salt / mol water
Temperature (deg C)
NaCl
MgCl2
KCl
Figure 9. Solubility data generated for NaCl, MgCl2 and KCl
24. 23
A complete utility database was assembled (shown in Table 6) with steam and cooling
water specifications, in addition to electrical data and other general values. This utility database is
vital when calculating utility requirements and costing in later sections. Sample calculations for
determining utility requirements and utility costs can be found in Appendix A.
Utilities
Products
Costing information for MgCl2, KCl and
water in the San Diego area was retrieved
from online sources. Medical grade MgCl2
and KCl sell for $800 and $380 per metric
ton respectively, while agricultural grade
for the same species sells for $180 and
$450 per metric ton. Finally, water from
the San Diego desalination plant sells at a
rate of $0.78 per 1000 lb, as a result of an
agreement between the plant and the state
government.
General Utility Data
Days of operation per year 330
Hours of operation per day 24
Steam Data
Saturated Steam Pressure 50 psig
Latent Heat of Saturated Steam 912 Btu/lb
Price of Steam $6/1000 lb
Cooling Water Data
Inlet Temperature 86°F
Outlet Temperature 110°F
Specific Heat Capacity 1.005 Btu/(lb °F)
Density 62.4 lb/ft3
Price of Cooling Water $0.10/1000 gal
Electricity Data
Price of Electricity $0.0778/kWh
Table 6. Utility Database for both GE brine concentrator and MgCl2
separation unit
25. 24
Process Flow and Material Balances
Figures 10 and 11 present both of the process flow diagrams generated during this project.
Once again, we would like to stress that the premise of this design project was to create a
simulation to emulate GE’s brine concentrator to the best of our ability (with the available
software, Aspen Plus, as shown in Figure 10), and to subsequently design a new system to compete
with GE’s system in a more energy and cost-efficient manner. The competitive system we have
designed (with guidance from the patent available in Appendix C), which we refer to as the MgCl2
Separation Unit, is shown in Figure 11. In this section of the report, we are attempting to juxtapose
the two systems beside each other as clearly as possible to highlight both their similarities and
differences; that said, more specific descriptions of either design can be found in the following
section titled ‘Process Descriptions.’
Furthermore, both figures contain all of the participating streams in their respective
designs. For legibility purposes, the MgCl2 separator flow sheet (Figure 11) is presented on two
pages. Red streams in each figure represent heat (steam) streams, while blue streams represent
cooling (water) streams.
Tables 7 and 8 show the mass flows, stream conditions, and significant physical properties
for the GE system and the MgCl2 separation unit, respectively. Once more, the MgCl2 stream
conditions table extends to two pages as well, in an attempt to make the contents more
understandable and aesthetically appealing.
We would like to note that although Aspen Plus was initially used to create a simulation
flowsheet for the proposed MgCl2 separation unit (see Appendix B), we found that Aspen Plus
lacked the extensive electrolyte chemistry background needed to converge the desired process.
26. 25
With that, we manually created the material balances on a stream-by-stream basis in Microsoft
Excel, using extensive nested conditional loops (see Appendix D) in addition to the solubility data
gathered above. This section includes the aforementioned manually generated mass balances in
Table 8, while Appendix D has a more complete expansion of the Excel file.
33. 32
Process Description
GE Brine Concentrator
GE’s brine concentrator was modeled using ASPEN Plus simulation, as shown in Figure
10. As an overview, saturated brine (23.3% NaCl by weight) enters the process (desalination
facilities typically dispense saturated NaCl solutions as waste), and undergoes a series of heat and
separation events; throughout the process, two pure water streams (DIST1 and DIST2) are
obtained, successfully recovering approximately 68% of the water fed to the system. Furthermore,
a concentrated brine stream exits the system (WASTE), which will not only contain a saturated
aqueous NaCl solution, but also solid NaCl crystals and other contaminants.
More specifically, saturated brine (which contains NaCl alongside a variety of other
contaminants like MgCl2, KCl, MgSO4, K2SO4 etc.) enters the process at approximately 25°C and
1 bar and is immediately passed through a shell-in-tube heat exchanger, which raises the stream’s
temperature to near boiling conditions (108°C at 1 bar). Although a shell-in-tube exchanger is used
in practice, the exchanger was modeled in ASPEN using two HEATER blocks and a heat stream
connecting the two, this allowed for the simulation to converge more easily and efficiently. In the
process flowsheet diagram shown in Figure 11, however, the more realistic shell-in-tube exchanger
is used. The heated brine is then passed through a deaerator, which was modeled with a FLASH2
block and removes any non-compressible fluids from the brine in the AERATE exit stream, such
as O2 and CO2 gas, as well as a small amount of water in the vapor phase. The deaerated brine
(AERBRINE) is directed to the brine evaporator, which is a section of the brine concentrator
containing two distinct units: a settler tank and a shell-in-tube heat exchanger. In an attempt to
mimic the brine evaporator, a FLASH2 block and an FSPLIT block were used to model the settler
tank, and two HEATER blocks alongside a heat stream were used to model the shell-in-tube heat
34. 33
exchanger. The deaerated brine initially enters the flash drum ‘EVAP,’ which evaporates a portion
of the water from the brine, concentrating the brine further; at this point, NaCl crystals will begin
forming in the aqueous brine solution as a result of the increased NaCl concentration. The
concentrated brine exits as the bottoms product of the flash drum and enters a splitter (SPLIT),
which sends majority of the brine through a pump and subsequently into the evaporator’s heat
exchanger. Finally, the concentrated brine is heated to a temperature above its boiling point
(approximately 130°C), and is then recycled into the original flash drum EVAP.
The water vapor distillate from the EVAP flash drum is passed through a compressor,
modeled with a COMPR block in ASPEN, increasing its pressure to approximately 4 bar. The
compressed water vapor is introduced into the shell-in-tube exchanger as the heating fluid, and is
thus used to heat the aforementioned concentrated brine. As a result, the compressed vapor is
significantly cooled and mostly condensed to the liquid phase. Finally, the cooled two-phase water
stream is passed through the initial shell-in-tube heat exchanger used to heat the feed brine; the
water stream is fully condensed and cooled further, exiting the system as the first recovered water
stream, DIST1.
As mentioned earlier, the splitter block SPLIT recycles the majority of the concentrated
brine from the EVAP flash drum. The portion that is not recycled, however, is redirected to a
crystallizer. Rather than utilizing one of ASPEN’s crystallizer blocks, which has limited
functionality and would be rendered inaccurate in this process, a custom crystallizer was
constructed from a variety of blocks. First, the concentrated brine is mixed with a more
concentrated brine solution already present in the crystallizer – this was modeled using a MIXER
block. The mixed brine stream is passed to a subsequent splitter (SPLIT2), which redirects the
majority of the stream to the crystallizer block and ejects the remainder from the process as the
35. 34
waste stream (WASTE). The recycled brine enters a shell-in-tube heat exchanger (once again
modeled with two HEATER blocks and a heat stream), increasing its temperature to near boiling;
the heated brine enters a FLASH2 drum (CRYST), which vaporizes a portion of the water from
the brine stream. The water vapor is compressed to approximately 1.5 bar and is subsequently
passed through the aforementioned shell-in-tube exchanger and is used to heat the inlet
concentrated brine. After passing through the exchanger, the water vapor both cools and
condenses, and exits the system as the second recovered water stream, DIST2.
The CRYST flash drum’s bottoms product is a densely concentrated brine solution with a
substantial solid fraction (0.30-0.35) as a result of evaporating the flash drum’s inlet water content;
by removing water from the brine, the CRYST drum is effectively forcing NaCl crystals to form
in the extremely concentrated bottoms product. Finally, the bottoms product is recycled to the
aforementioned mixer tank and is mixed with the concentrated brine solution from the brine
evaporator.
MgCl2 Separation Unit
Figure 11 shows the process flowsheet diagram for the designed MgCl2 separation unit.
This separation process occurs in three distinct phases: concentration and impurity removal, KCl
recovery, and MgCl2 recovery. As shown, phase one utilizes multi-stage flash evaporation to
concentrate the incoming salts by removing majority of the feed water, while phases two and three
predominantly use crystallizing and filtering units to remove KCl and MgCl2 crystals as
recoverable byproducts.
In phase one, saturated brine wastewater from a desalination facility enters the process at
the same conditions as that of the GE Brine Concentrator feed stream. Furthermore, in an attempt
36. 35
to be as consistent as possible, the species compositions of the feed stream to the MgCl2 separator
are identical to that of the GE Brine Concentrator, as is shown in Tables 6 and 7. Upon entering
the system, the feed brine enters a deaerator, which, in a similar fashion to the GE system, removes
any non-compressible fluids from the brine, such as O2 and CO2. The deaerated brine is fed into a
mixing tank, which slightly lowers its temperature from 50°C to 44°C before it is pumped into the
first of three flash evaporators, named EVAP1, which evaporates approximately 20% of the
incoming water to stream WAT1. The bottoms product (stream BOTT1), which is now more
concentrated and higher in temperature as a result of the flash evaporation, is pumped to a second
mixing tank; BOTT1 experiences a slight temperature increase and is mixed with two more
concentrated streams SLURRY1 and CLIQ, at which point it enters the second flash evaporator,
EVAP2. EVAP2 vaporizes 30% of the incoming water, which is recovered as stream WAT2. The
bottoms product from EVAP2 (BOTT2), which is more concentrated and higher in temperature
than the feed to the evaporator, is pumped to a settler tank, which sends a stream with high salt
concentrations to a centrifuge and a lesser concentrated stream to the third and final flash
evaporator. The centrifuge cools the incoming feed to 25°C and performs a liquid solid separation;
that is, the majority of the NaCl will crystallize and is removed from the system in the SALTPROD
stream in addition to a fraction of the incoming water, MgCl2 and KCl. Conversely, a majority of
the water, KCl and MgCl2 exits the centrifuge in the CLIQ stream, which is then recycled to the
aforementioned mixer tank DISTMIX that provides the feed stream to the second flash evaporator,
EVAP2.
As mentioned earlier, the less concentrated stream leaving the settler tank will be fed to the
third and final flash evaporator EVAP3. Here, 40% of the incoming water is vaporized and
recovered, and the bottoms product (BOTT3) is pumped to a second settler tank, SETT2. Like the
37. 36
case of the first settler tank, a concentrated stream of salts is recycled to DISTMIX and is re-fed
to the second flash evaporator EVAP2. Likewise, a lesser concentrated stream exits SETT2 and is
fed to a second centrifuge, CENT2, which removes a majority of the persisting NaCl in stream
SALTPROD2, in addition to a small fraction of the water, KCl and MgCl2. As a result, the stream
CARNAL2 exits the centrifuge with negligible amounts of NaCl present in solution in addition to
majority of the MgCl2 and KCl from the feed stream; this officially ceases phase one of the process.
Phase two focuses on crystallizing KCl. First, the CARNAL2 stream exiting phase one is
introduced to a mixing tank, in which it is mixed with a feed water stream (25°C and 1 bar) and a
recycled KCl crystalline stream; this mixture serves the purpose of re-suspending any MgCl2
crystals that have formed in the CARNAL2 stream back into aqueous solution. Subsequently, the
mixed stream CRSTFED1 exits the mixer and enters the first of two crystallizers, CRYST1, which
operates at 25°C and 0.5 bar; under these conditions, carnallite crystals (KMgCl3Ÿ6H2O) will form,
which is vital for the process to proceed. The carnallite-crystalline stream is pumped through a
rotary filter, which sends the solid carnallite crystals and a small fraction of the incoming water to
a leach tank, while the remaining aqueous species and a large majority of the water is recycled to
phase one and is fed to the original mixing tank with the deaerated feed brine. As a result, a vast
majority of the K+
and Mg2+
ions are kept in phase two via the carnallite crystals, while little Na+
enter phase two.
Cold water (5°C, 1 bar) is fed to the aforementioned leach tank and is used to suspend the
carnallite crystals in solution; this re-introduces K+
, Mg2+
and Cl-
ions into solution, which, under
these operating conditions, will allow KCl crystals to begin precipitating. The mixed solution is
then pumped through the second of three rotary filters, which removes the solid KCl crystals in
addition to a small amount of water in the stream FILTKCL, while the remaining water and ionic
38. 37
species exit in the MGLIQ stream. FILTKCL is partially removed from the process at this point,
successfully recovering KCl(s) crystals; the majority of the FILTKCL stream is redirected in the
KCLRECYC stream and is recycled to the first mixing tank in phase two, meeting the CARNAL2
feed stream and feed water. With the completion of this recycle loop, phase two comes to a close.
Phase three, being the final phase of the process, focuses on forming and recovering MgCl2
crystals from solution. The stream MGLIQ is first fed into a flash evaporator, which removes
majority (75%) of the water content of the feed. Its bottoms product (CRSTFED2) is introduced
to the process’ second crystallizer, which operates at 25°C and 1 bar; under these conditions,
MgCl2 crystals will precipitate, where Mg2+
are notably the limiting reagent under the initial feed
stream species compositions. Finally, the MgCl2 crystalline stream FILT3IN is pumped through
the third and final rotary filter, which recycles the majority of the water and its relatively negligible
ionic composition to the leach tank LEACH, and subsequently recovers the MgCl2 crystals (96%
wet-mass purity) in the PRODUCT stream. With this final filtration, the process terminates;
overall, four distinct streams recover water from the feed, KCl and MgCl2 crystals are formed in
significant amounts (approximately 21tons MgCl2 are formed per day with these flow rates), and
the waste streams SALTPROD and SALTPROD2 exit the system at a convenient 31.0% and
35.1% solid, respectively, and collectively contain 100% of the NaCl that enters the system.
39. 38
Utilities
The three main utilities for both our concentrator and the GE concentrator are electricity,
low pressure steam, and cooling water. The main utility for our process was low pressure steam
for heating duties, whereas the GE brine concentrator relies most almost exclusively on electricity
for utility requirements. For the GE brine concentrator, steam and cooling water costs account for
1.9% and 0.02% respectively, while roughly 98.1% of the cost is due to electricity use. For the
Magnesium Chloride Separation Unit, low pressure steam accounts for 91.4% of the overall
utilities cost, electricity for 8.2%, and cooling water for 0.4%. Prices for utilities are $0.0778/kWh,
$6/1000lb, $0.1/1000 gal for electricity, low pressure steam, and cooling water, respectively [29]
[30].
The GE system requires electricity to power a pump for the brine and two vapor
compressors. The majority of the total electricity used by the GE system is allocated towards
powering the two vapor compressors, VAPCOMP1 accounts for 79% of the annual electricity
usage, and VAPCOMP2 is responsible for 21%. In our process, no compressors were used;
streams are kept in the liquid phase allowing pumps to be used instead of compressors. This
process uses seven pumps, which range in percentage of the total electricity use from 0.8-4.9%.
The majority of energy consumed in this process is due to the two centrifuges. ASPEN was unable
to give electricity requirements for centrifuge blocks, so a conservative estimate was used to
account for electricity use of the centrifuges in our system. For industrial level centrifuges, 90 kW
was the maximum electricity requirement for a standard centrifuge, thus 90 kW per centrifuge was
used to account for the worst case energy demand of our process [31]. Using this conservative
value, the centrifuges are responsible for 79.6% of the total energy usage in the Magnesium
Chloride Separation Unit. Note that 90 kW per centrifuge is still significantly less than the 2300
40. 39
kW and 8700 kW required to power the two vapor compressors in GE’s system. The GE system
is estimated to use 8.7x10⁷
kWh of electricity per year, while our MgCl2 Separation Unit system
uses only 1.7x10⁶
kWh per year. Compressors are very costly when it comes to applying a pressure
change, because it is less energy intensive to pump a liquid than to compress a gas. The absence
of compressors in our brine concentrator is why our system is more electricity efficient by roughly
an order of magnitude.
While our brine concentrator uses less energy than the GE model, we use more cooling water and
steam. The GE system requires low pressure steam to provide heat duties for a deaerator and
evaporator. The deaerator uses 40% of the total mass of steam while the evaporator uses 60%. The
total annual use for the GE system is approximately 2.2x10⁷
lb of steam per year. Most of our
annual steam use goes towards heating the flash evaporation units. EVAP1, EVAP2, EVAP3 and
MGFLASH1 account for 96% of the total steam usage, with EVAP1 using 18%, EVAP2 38%,
EVAP3 25%, and MGFLASH1 15%. The deaerator accounts for the remainder of the required
heat duty for the process. Our process does not have a single piece of equipment responsible for
the bulk of the energy use as a result of the use of a multi-effect evaporation system. The total
annual steam use is 2.6x10⁸
lbs of steam per year, roughly a factor of ten greater than the steam
usage for the GE system.
The GE concentrator only uses cooling water in its crystallizer, which requires 1.2x10⁷
gallons of cooling water annually. Our system uses two crystallizers, with the distribution of the
cooling water as follows: 3% for CRYST1 and 97% for CRYST2. The second crystallizer requires
the most cooling. The total annual use of cooling water is 6.4x10⁷
gallons of cooling water per
year, slightly greater than the GE system but on the same order of magnitude. Despite using more
steam and cooling utilities in our process, the overall cost of utilities is still less for our
41. 40
system. Because both processes are electricity intensive, being able to decrease our electricity use
allows our system to compensate for relatively higher heating and cooling utilities leading to an
overall less expensive utility bill by an estimated factor of 4. The GE process requires roughly
$6.9 million in utilities annually, while our process requires $1.6 million. Additionally, note that
because our system recovers 2.2x10⁹
lb of water compared to GE’s 2.1x10⁹
lb annually, our
required ratios for steam and cooling water are greater by about an order of magnitude, but our
required ratio for electricity is less by about two orders of magnitude. See Tables 9-12 below for
all required ratios, totals, and costs on utilities.
Table 9. Utilities Summary.
GE
Utility Annual Amount Required Ratio Annual Cost ($)
Low Pressure Steam lb 0.010 lb/lb 132808.42
Cooling Water gal 0.045 gal/lb 1144.84
Electricity kWh 0.041 kWh/lb 6791327.65
Recovered Water (lbs) 2,109,941,856
MgCl2 Separation Unit
Utility Annual Amount Required Ratio Annual Cost ($)
Low Pressure Steam lb 0.12 lb/lb 1555472.75
Cooling Water gal 0.26 gal/lb 6829.21
Electricity kWh 0.00081 kWh/lb 139335.88
Recovered Water (lbs) 2,203,483,611
44. 43
Unit Descriptions
GE Brine Concentrator
Heat Exchangers
HEAT1 is a shell and tube heat exchanger with tubes constructed from monel, to avoid
corrosion due to the brine, and the rest made from carbon steel. The heat exchanger is 10ft long
with 47 tubes and raises the temperature of the cold stream, which has a flow rate of 247,000 kg/hr,
from 25°C to 94°C while the hot stream, with a flow rate of 58,000 kg/hr, is cooled from 134°C
to 96°C. This heat exchanger is designed to heat the incoming brine to a temperature just under
boiling in preparation for the deaerator while also cooling the effluent steam to the liquid state to
pump out of the plant as a product.
HEAT2 is another shell and tube heat exchanger with tubes constructed from monel and
the rest from carbon steel. This exchanger is 20 ft long with 398 tubes and increases the
temperature of the cold stream, which has a flow rate of 496,000 kg/hr, from 90°C to 146°C while
the hot stream, with a flow rate of 58,000 kg/hr, condenses 60% of the stream and cools from
396°C 134°C. HEAT2 heats the brine before it enters the brine evaporator in order to evaporate
and recover the water from the brine stream.
Deaerator
The deaerator is constructed from stainless steel and is 33 feet long and 17 feet in diameter.
This vessel is used to remove incompressible gases such as CO2 and O2 from the brine feed stream.
The column operates at 0 bar and removes all but trace amounts of both CO2 and O2 from the brine
stream flowing at 247,000 kg/hr. The deaerator stream removes all the gases along with 23,000
kg/hr of water, at a total flow rate of 24,000 kg/hr of vapor. The resulting brine is free of air and
flows out at a rate of 230,000 kg/hr.
45. 44
Brine Evaporator
The brine evaporator is made with stainless steel and is 26 feet long and 13 feet in diameter.
This evaporator is used to recover water from the brine stream in order to increase the overall
amount of product. Brine enters the evaporator from the deaerator at 86°C with a flow rate of
230,000 kg/hr and there is a recycle stream of brine that enters from HEAT2 at 145°C with a flow
rate of 496,000 kg/hr. The evaporator operates at 0.5 bar and 5% of the inlet streams leaves as
vapor, with a composition of pure water and a flow rate of 64,000 kg/hr at 90°C. The remaining
brine leaves the evaporator at a flow rate of 661,000 kg/hr at 90°C, with 0.4% of the stream as
solid NaCl.
Crystallizer
The crystallizer is modelled in ASPEN using an evaporator, a compressor, and a heat
exchanger to modify each component of the crystallizer separately in order to achieve optimal
separation as opposed to using the traditional crystallizer block available in ASPEN. The
evaporator component of the crystallizer is made from stainless steel and is 30 feet long and 60
feet in diameter. It operates at 92°C and 0.5 bar in order to evaporate a portion of the water and
concentrate the brine stream, increasing the formation of NaCl crystals. The inlet stream enters at
112°C with a flow rate of 408,000 kg/hr. The effluent pure water stream leaves at 92°C with a
flow rate of 63,000 kg/hr. This water stream enters a compressor and is condensed before entering
HEAT3. The remaining brine from the crystallizer evaporator, at a temperature of 92°C and flow
rate of 345,000 kg/hr with 11% solids in the form of NaCl crystals, is mixed with brine from the
brine evaporator in a mixing tank that is 10 feet long and 5 feet in diameter, to form a stream at
91°C with a flow rate of 510,000 kg/hr, which now has a solids content of 11%. Some of this
stream is collected as the waste stream while 80% of the stream enters HEAT3.
46. 45
HEAT3 is a shell and tube heat exchanger with tubes constructed from monel, and the rest
made of carbon steel. The heat exchanger is 12 feet long with 2,000 tubes and increases the
temperature of the cold stream with a flow rate of 408,000 kg/hr from 91°C to 112°C and cools
the hot stream with a flow rate of 63,000 kg/hr from 181°C to 100 °C. This exchanger heats the
brine before entering the evaporator component of the crystallization and condenses 95% of the
effluent water stream to collect and pump the product.
MgCl2 Separation Unit
Deaerator
The deaerator is 22 feet long and 11 feet in diameter, is made of stainless steel, and is used
to remove incompressible gases like CO2 and O2, similar to the deaerator in the GE Brine
Concentrator system. The deaerator operates at 0.15 bar and 50°C and removes all but trace
amounts of CO2 and O2 from the inlet stream resulting in a vapor stream comprised of CO2, O2
and 14,000 kg/hr of H2O at 50°C with a flow rate of 15,000 kg/hr. The remaining brine leaves the
deaerator at 50°C with a flow rate of 164,000 kg/hr.
Triple Effect Evaporator
The deaerated brine enters a triple effect evaporator made from stainless steel to remove
water from the brine stream. The first evaporator is 22 feet long and 11 feet in diameter and
operates at 0.15 bar and 60°C to remove 30,000 kg/hr of water. The remaining liquid is pumped
to 1 bar to increase the pressure of the stream before entering the second effect and mixed with the
recycle streams from the second and third effect to increase the overall efficiency of the system
and introduces solid NaCl into the system. The resulting mixed stream, at 63°C with a flow rate
of 309,000 kg/hr with a solids fraction of 0.02, enters the second effect which is 28 feet long and
14 feet in diameter, and operates at 90°C and 0.5 bar, removing 60,000 kg/hr of water. The
47. 46
remaining liquid is pumped, increasing the pressure to 2 bar, and enters a settling tank, which is
22 feet long and 11 feet in diameter, where 30% is removed to a centrifuge, CENT, and the
remaining 70% enters the third effect. The third effect, which is also 22 feet long and 11 feet in
diameter, operates at 115°C and 1.15 bar, which removes 39,000 kg/hr of water. The remaining
brine is pumped to a stainless steel second settling tank, which is 26 feet long and 13 feet in
diameter, and 85% is recycled and the remaining 15%, operating at 100°C with a flow rate of
20,000 kg/hr and has a solids fraction of 0.24 which is comprised solely of NaCl crystals. The
effluent water streams from the triple effect evaporator are collected as product.
Centrifuges
CENT operates at 25°C and 1 bar. The inlet brine stream is 90°C with a flow rate of 75,000
kg/hr and 10% of the stream is comprised of NaCl crystals. The resulting solids stream has a flow
rate of 34,000 kg/hr and is 57% solid NaCl. The liquid stream contains no solid and has a flow
rate of 40,000 kg/hr. This centrifuge removes the undesired salts, namely NaCl, from the system.
CENT2 operates at 25°C and 1 bar. The inlet brine stream is 100°C with a flow rate of
20,000 kg/hr and a solids fraction of 0.24. The resulting solids stream has a flow rate of 11,000
kg/hr and 60% of the stream is comprised of NaCl crystals. The liquid outlet stream has a flow
rate of 13,000 kg/hr and has a solids fraction of 0.3, which is comprised of only MgCl2 crystals.
This second centrifuge is designed to remove the remaining NaCl from the system to increase the
final purity of the MgCl2 and KCl crystals.
Crystallizers
CRYST1 operates at 25°C and 0.5 bar. The inlet stream is a mix of the outlet stream from
CENT2, the recycle stream from the KCl separation at 25°C with a flow rate of 2,000 kg/hr and
54% KCl, and a feed water stream at 25°C with a flow rate of 16,000 kg/hr. The resulting mixed
48. 47
inlet stream has a temperature of 35°C and a flow rate of 30,000 kg/hr, with 13% solids comprised
solely of MgCl2. The resulting stream has a flow rate of 27,000 kg/hr, 1400 kg/hr of which is
carnallite, KMgCl3*6H2O, which is necessary to achieve MgCl2 and KCl separation. This stream
is pumped to a filter which creates a liquid stream with a flow rate of 20,000 kg/hr and no solids
and a solids stream with 1400 kg/hr of carnallite and 1000 kg/hr of KCl crystals, with a total flow
rate of 7,200 kg/hr.
CRYST2 is made of carbon steel and operates at 25°C and 0.5 bar. The inlet stream is the
resulting stream from a stainless steel evaporation column that is 17 feet long and 9 feet in
diameter, and operates at 110°C and 1.0 bar, evaporating 18,000 kg/hr of water. The resulting
stream has a flow rate of 75,000 kg/hr and a temperature of 110°C when it enters the crystallizer.
The outlet stream from CRYST2 enters a continuous rotary drum vacuum filter which creates a
solid stream with a flow rate of 1600 kg/hr, with a solid content of 51%, or 810 kg/hr of MgCl2
crystals. The liquid stream has a flow rate of 73,000 kg/hr containing mostly water with small
amounts of Cl-
and Mg2+
ions, which is recycled into the leach tank.
Leach Tank
The leach tank is 8 feet long and 4 feet in diameter, is made of stainless steel, and operates
at 25°C and 0.5 bar. The inlet stream is a mix of the solid outlet stream from FILT1, with a flow
rate of 7200 kg/hr and a solids fraction of 0.14 due to the presence of KCl crystals, the recycle
stream from FILT3, with a flow rate of 73,000 kg/hr, and a cold water stream at 5°C with a flow
rate of 16,000 kg/hr. The leach tank outlet stream leaves at 15°C with a flow rate of 95,000 kg/hr.
This leach tank dissolves the KCl crystals in water in preparation for the KCl separation that occurs
in FILT2, where KCl crystals form in a stream at 25°C with a flow rate of 2600 kg/hr, 54% of
which is KCl crystals, 95% of which is recycled into the system to maintain appropriate levels of
49. 48
KCl in the process, and the remaining 5% is collected as product. The liquid stream from FILT2
has a temperature of 25°C and a flow rate of 93,000 kg/hr and is fed into the evaporator to begin
the separation of MgCl2.
50. 49
Equipment List
GE Brine Concentrator
The following tables contain the unit specifications for each piece of equipment that was used in
the GE Brine Concentrator system.
Heat Exchangers
Heat Exchanger
Identification Item Heat Exchanger
Item No. HEAT1
No. Required 1
Function Heats feed stream to near boiling point
Operation Continuous
Type Shell and Tube
Stream ID Tube Side Shell Side
Stream In BRINEIN COOLVAP
Stream Out HTBRINE1 DIST1
Flow Rate (kg/hr) 247000 57900
Inlet Temperature (°C) 25 134
Outlet Temperature (°C) 94 96
Design Data: Surface Area (ft2
) 90
Tube Length (ft) 10
LMTD (°C) 128
Heat Duty
(MMBTU/HR)
24
Construction Material Carbon Steel
Purchase Cost $ 29, 000
Bare Module Cost $ 93, 000
51. 50
Heat Exchanger
Identification Item Heat Exchanger
Item No. HEAT2
No. Required 1
Function Heats brine to above boiling point for evaporation
Operation Continuous
Type Shell and Tube
Stream ID Tube Side Shell Side
Stream In HTBRINE3 COMPVAP
Stream Out HTBRINE4 COOLVAP
Flow Rate (kg/hr) 496000 58000
Inlet Temperature (°C) 90 396
Outlet Temperature (°C) 145 134
Design Data: Surface Area (ft2
) 1570
Tube Length (ft) 20
LMTD (°C) 76
Heat Duty
(MMBTU/HR)
9.0
Construction Material Carbon Steel
Purchase Cost $ 39, 000
Bare Module Cost $ 125, 000
52. 51
Heat Exchanger
Identification Item Heat Exchanger
Item No. HEAT3
No. Required 1
Function Heats recycled brine to crystallizer
Operation Continuous
Type Shell and Tube
Stream ID Tube Side Shell Side
Stream In HTBRINE7 COMPVAP2
Stream Out HTBRINE8 DIST2
Flow Rate (kg/hr) 408000 63000
Inlet Temperature (°C) 91 181
Outlet Temperature (°C) 112 115
Design Data: Surface Area (ft2
) 4500
Tube Length(ft) 12
LMTD (°C) 8.7
Heat Duty
(MMBTU/HR)
24
Construction Material Carbon Steel
Purchase Cost $ 73, 000
Bare Module Cost $ 234, 000
53. 52
Flash Drums
Flash Drum 1
Identification Item Deaerator
Item No. DEAERATE
No. Required 1
Function Remove non-compressible fluids from feed stream
Operation Continuous
Type Vertical Drum
Stream ID Feed Distillate Bottoms
HTBRINE1 AERATE AERBRINE
Flow Rate (kg/hr) 246771 24000 230000
Pressure (bar) 0.755 0.5 0.5
Temperature (°C) 94 86 86
Design Data: Operating Pressure (bar) 0.5
Vapor Fraction 0.1
Heat Duty
(GCAL/HR)
4.0
Mass Stream
(lb/yr)
8.7E+06
Construction
Material
Stainless Steel
Utility Cost ($/year) $ 52, 000
Purchase Cost $ 152, 000
Bare Module Cost $ 630, 000
54. 53
Flash Drum 2
Identification Item Flash Evaporator
Item No. EVAP
No. Required 1
Function
Remove water from incoming feed stream via flash
evaporation
Operation Continuous
Type Vertical Drum
Stream ID Feed 1 Feed 2 Distillate Bottoms
HTBRINE4 PUMPBRI2 VAP1 HTBRINE2
Flow Rate (kg/hr) 495867 230000 64319 661000
Pressure (bar) 3 4 0.5 0.5
Temperature (°C) 145 86 90 90
Design Data: Operating Pressure (bar) 0.5
Vapor Fraction 0.05
Heat Duty
(GCAL/HR)
6.1
Mass Stream
(lb/yr) 1.3E+07
Construction
Material
Stainless Steel
Utility Cost ($/year) $ 80, 000
Purchase Cost $ 111, 000
Bare Module Cost $ 461, 000
55. 54
Flash Drum 3
Identification Item Crystallizer
Item No. Crystallizer
No. Required 1
Function Concentrate incoming brine stream via NaCl crystallization
Operation Continuous
Type
Vertical
Drum
Stream ID Feed Distillate Bottoms
HTBRINE8 HTVAP2 HTBRIN10
Flow Rate (kg/hr) 408312 63200 345000
Pressure (bar) 1 0.5 0.5
Temperature (°C) 112 92 92
Design Data: Operating Pressure (bar) 0.5
Vapor
Fraction 0.15
Heat Duty
(GCAL/HR)
-1.2
Mass Cooling Water (lb/yr) 9.6E+07
Construction
Material
Stainless Steel
Utility Cost ($/year) $ 1,150
Purchase Cost $ 277, 000
Bare Module Cost $ 1,153, 000
56. 55
Vapor Compressors
Vapor Compressor 1
Identification Item Single Stage Compressor
Item No. VAPCOMP
No. Required 1
Function Compress water vapor from evaporator to heat exchanger
Operation Continuous
Type Singe Stage Centrifugal
Stream ID Inlet Outlet
VAP2 COMPVAP
Temperature (°C) 90 400
Pressure (bar) 0.5 4
Design Data: Flow Rate (kg/hr) 57900
Drive Type Electric
Electricity Consumed
(kWh/year) 68,700, 000
Construction Material Cast Iron
Brake Effeciency 75%
Motor Efficiency 75%
Utility Cost ($/year) $ 5,345, 000
Purchase Cost $ 2,112, 000
Bare Module Cost $ 3,172, 000
57. 56
Vapor Compressor 2
Identification Item Single Stage Compressor
Item No. VAPCOMP2
No. Required 1
Function Compress water vapor from crystallizer to heat exchanger
Operation Continuous
Type Singe Stage Centrifugal
Stream ID Inlet Outlet
HTVAP2 COMPVAP2
Temperature (°C) 92 180
Pressure (bar) 0.5 1
Design Data: Flow Rate (kg/hr) 63000
Drive Type Electric
Electricity Consumed
(kWh/year) 18,510, 000
Construction Material Cast Iron
Brake Efficiency 75%
Motor Efficiency 75%
Utility Cost ($/year) $ 1,440, 000
Purchase Cost $ 1,977, 000
Bare Module Cost $ 2,965, 000
58. 57
Pumps
PUMP 1
Identification Item Brine Pump
Item No. BRIPUMP1
No. Required 1
Function Pump deaerated brine to flash evaporator
Operation Continuous
Type Centrifugal, 3600RPM, VSC 75 Hp
Stream ID Inlet Outlet
AERBRINE PUMPBRI2
Pressure (bar) 0.5 1.5
Design Data: Flow Rate (kg/hr) 230000
Pump Head (ft) 28
Brake Horsepower (Hp) 6
Electricity Consumed
(kWh) 69000
Construction Material Cast Iron
Brake Effeciency 72%
Motor Efficiency 85%
Utility Costs ($/year) $ 5,300
Purchase Cost $ 7,300
Motor Purchase Cost $ 650
Bare Module Cost $ 24,200
59. 58
PUMP 2
Identification Item Brine Pump
Item No. PUMPBRI2
No. Required 1
Function Pump concentrated brine stream to heat exchanger
Operation Continuous
Type Centrifugal, 3600RPM, VSC 75 Hp
Stream ID Inlet Outlet
HTBRINE2 HTBRINE9
Pressure (bar) 0.5 2
Design Data: Flow Rate (kg/hr) 661000
Pump Head (ft) 97
Brake Horsepower (Hp) 24
Electricity Consumed
(kWh) 69000
Construction Material Cast Iron
Brake Effeciency 73%
Motor Efficiency 88%
Utility Costs ($/year) $ 5,300
Purchase Cost $ 8,900
Motor Purchase Cost $ 1,700
Bare Module Cost $ 29,000
60. 59
PUMP 3
Identification Item Brine Pump
Item No. BRIPUMP3
No. Required 1
Function
Pump concentrated brine from crystallizer to mixer
tank
Operation Continuous
Type Centrifugal, 3600RPM, VSC 75 Hp
Stream ID Inlet Outlet
HTBRIN10 HTBRIN11
Pressure (bar) 0.5 2
Design Data: Flow Rate (kg/hr) 345000
Pump Head (ft) 97
Brake Horsepower (Hp) 39
Electricity Consumed
(kWh) 69000
Construction Material Cast Iron
Brake Effeciency 77%
Motor Efficiency 89%
Utility Costs ($/year) $ 5,300
Purchase Cost $ 10,600
Motor Purchase Cost $ 2,700
Bare Module Cost $ 35,000
61. 60
Mixer Tank
Mixer Tank
Identification Item Mixer
Item No. MIX1
No. Required 1
Function Mixes concentrated bottoms product from crystallizer with brine stream
Operation Continuous
Type Tank
Stream ID Feed 1 Feed 2 Outlet
HTBRINE5 HTBRIN11 HTBRINE6
Flow Rate (kg/hr) 165000 345000 510000
Temperature (°C) 90 92 91
Pressure (bar) 0.5 2 0.5
Design Data:
Max Volume (m3
) 100
Operating Pressure (psig) 7.3
Shell Thickness (ft) 0.03
Length (ft) 10
Construction Material Carbon Steel
Purchase Cost $ 26,300
Bare Module Cost $ 109,00
62. 61
MgCl2 Separation Unit
The following tables show the unit descriptions and specifications for all pieces of equipment
used in the designed MgCl2 separation unit.
Flash Drums
Flash Drum 1
Identification Item Deaerator
Item No. DEAERATE
No. Required 1
Function Remove non-compressible fluids
Operation Continuous
Type Vertical Drum
Stream ID Feed Distillate Bottoms
FEED NONCOMP AERFED
Flow Rate (kg/hr) 178261 14000 164000
Pressure (bar) 1 0.15 0.15
Temperature (°C) 25 50 50
Design Data:
Operating Pressure
(bar) 0.15
Vapor Fraction 0.1
Heat Duty
(GCAL/HR)
4.0
Mass Steam (lb/yr) 8.7E+06
Construction Material Stainless Steel
Utility Cost ($/year) $ 52,500
Purchase Cost $ 87,400
Bare Module Cost $ 363,000
63. 62
Flash Drum 2
Identification Item Flash Evaporator
Item No. EVAP1
No. Required 1
Function Remove water content from brine inlet via vaporization
Operation Continuous
Type Vertical Drum
Stream ID Feed Distillate Bottoms
EF1 WAT1 BOTT1
Flow Rate (kg/hr) 183000 30000 154000
Pressure (bar) 2 0.15 0.15
Temperature (°C) 44 60 60
Design Data: Operating Pressure (bar) 0.15
Vapor Fraction 0.2
Heat Duty
(GCAL/HR)
21
Mass Steam (lb/yr) 4.7E+07
Construction Material Stainless Steel
Utility Cost ($/year) $ 283, 000
Purchase Cost $ 86, 000
Bare Module Cost $ 359, 000
64. 63
Flash Drum 3
Identification Item Flash Evaporator
Item No. EVAP2
No. Required 1
Function
Remove water content from brine inlet via
vaporization
Operation Continuous
Type Vertical Drum
Stream ID Feed Distillate Bottoms
EF2 WAT2 BOTT2
Flow Rate (kg/hr) 309000 60000 249000
Pressure (bar) 1 0.5 0.5
Temperature (°C) 63 90 90
Design Data: Operating Pressure (bar) 0.5
Vapor Fraction 0.3
Heat Duty
(GCAL/HR)
45
Mass Steam (lb/yr) 9.9E+07
Construction Material Stainless Steel
Utility Cost ($/year) $ 592, 000
Purchase Cost $ 125, 000
Bare Module Cost $ 520, 000
65. 64
Flash Drum 4
Identification Item Flash Evaporator
Item No. EVAP3
No. Required 1
Function
Remove water content from brine inlet via
vaporization
Operation Continuous
Type Vertical Drum
Stream ID Feed Distillate Bottoms
EF3 WAT3 BOTT3
Flow Rate (kg/hr) 174000 39000 135000
Pressure (bar) 1.5 1.5 1.5
Temperature (°C) 90 115 115
Design Data: Operating Pressure (bar) 1.5
Vapor Fraction 0.4
Heat Duty
(GCAL/HR)
29
Mass Steam (lb/yr) 6.4E+07
Construction Material Stainless Steel
Utility Cost ($/year) $ 381, 000
Purchase Cost $ 92, 000
Bare Module Cost $ 382, 000
66. 65
Flash Drum 5
Identification Item Flash Evaporator
Item No. MGFLASH1
No. Required 1
Function Remove water from inlet to
Operation Continuous
Type Vertical Drum
Stream ID Feed Distillate Bottoms
MGLIQ WAT4 CRSTFED2
Flow Rate (kg/hr) 93000 18000 75000
Pressure (bar) 2 1.02 1.02
Temperature (°C) 25 110 110
Design Data: Operating Pressure (bar) 1.02
Vapor Fraction 0.2
Heat Duty
(GCAL/HR)
18
Mass Steam (lb/yr) 3.9E+07
Construction
Material
Stainless Steel
Utility Cost ($/year) $ 235, 000
Purchase Cost $ 59, 000
Bare Module Cost $ 247, 000
67. 66
Crystallizers
Crystallizer 1
Identification Item Carnallite Crystallizer
Item No. CRYST1
No. Required 1
Function Form carnallite crystals from solution
Operation Continuous
Type
Forced Circulation
Capacity
Stream ID Feed Product
CRSTFED1 FILT1IN
Flow Rate (kg/hr) 30000 30000
Carnallite Flow
(tons/day) 0 34
Pressure (bar) 1 0.5
Temperature (°C) 35 25
Design Data: Operating Pressure (bar) 0.5
Heat Duty
(GCAL/HR)
-0.2
Mass Cooling Water (lb/yr) 5.0E+07
Construction Material Carbon Steel
Utility Cost ($/year) $ 600
Purchase Cost $ 252, 000
Bare Module Cost $ 518, 000
68. 67
Crystallizer 2
Identification Item MgCl2 Crystallizer
Item No. CRYST2
No. Required 1
Function Form magnesium chloride crystals from solution
Operation Continuous
Type Forced Circulation Capacity
Stream ID Feed Product
CRSTFED2 FILT3IN
Flow Rate (kg/hr) 75000 75000
MgCl2 Flow
(tons/day) 0 27
Pressure (bar) 1.02 0.5
Temperature (°C) 110 25
Design Data: Operating Pressure (bar) 0.5
Heat Duty
(GCAL/HR)
-6.3
Mass Cooling Water (lb/yr) 5.2E+08
Crystal Production Rate (kg/hr) 110
Construction Material Carbon Steel
Utility Cost ($/year) $ 6,200
Purchase Cost $ 61, 000
Bare Module Cost $ 126, 000
69. 68
Centrifuges
Centrifuge 1
Identification Item Centrifuge
Item No. CENT1
No. Required 1
Function
Remove NaCl and other impurities from brine
stream
Operation Continuous
Type Continuous Reciprocating Pusher
Stream ID Feed 1 Liquid Product Solid Product
SLURRY2 CLIQ SALTPROD
Flow Rate (kg/hr) 75000 40000 34000
Pressure (bar) 1.5 1 1
Temperature (°C) 90 25 25
Design Data: Operating Pressure (bar) 1
Electrical Consumption
(kWh)
TBD
Construction Material Carbon Steel
Utility Cost ($/year) $ TBD
Purchase Cost $ 375, 000
Bare Module Cost $ 761, 000
70. 69
Centrifuge 2
Identification Item Centrifuge
Item No. CENT2
No. Required 1
Function
Remove NaCl and other impurities from
brine stream
Operation Continuous
Type Continuous Reciprocating Pusher
Stream ID Feed 1 Liquid Product Solid Product
CARNAL CARNAL2 SALTPROD2
Flow Rate (kg/hr) 20000 13000 11000
Pressure (bar) 1.5 1 1
Temperature (°C) 100 25 25
Design Data: Operating Pressure (bar) 1
Electrical Consumption
(kWh)
TBD
Construction Material Carbon Steel
Utility Cost ($/year) $ TBD
Purchase Cost $ 273, 000
Bare Module Cost $ 554, 000
71. 70
Filters
Filter 1
Identification Item Carnallite Filter
Item No. FILT1
No. Required 1
Function Remove solid carnallite from solution and recycle liquid stream
Operation Continuous
Type Continuous Rotary Drum Vacuum Filter, 20rph
Stream ID Feed Liquid Product Solid Product
FILTPUMP1 CARNLIQ SOLIDCARN
Flow Rate (kg/hr) 27000 20000 7200
Pressure (bar) 3 2 2
Temperature (°C) 25 25 25
Design Data: Operating Pressure (bar) 2
Diameter (ft) 17
Cross-Sectional Area (ft2
) 230
Heat Duty
(GCAL/HR)
0
Mass Steam (lb/yr) 0
Construction Material Cast Iron
Utility Cost ($/year) $ 0.00
Purchase Cost $ 214, 000
Bare Module Cost $ 496, 000
72. 71
Filter 2
Identification Item KCl Filter
Item No. FILT2
No. Required 1
Function Remove solid KCl from solution and recycle aqueous KCl stream
Operation Continuous
Type Continuous Rotary Drum Vacuum Filter, 20rph
Stream ID Feed Liquid Product Solid Product
FILTPUMP2 MGLIQ FILTKCL
Flow Rate (kg/hr) 95000 93000 2600
Pressure (bar) 3 2 2
Temperature (°C) 15 25 25
Design Data: Operating Pressure (bar) 2
Diameter (ft) 17
Cross-Sectional Area (ft2
) 213
Heat Duty
(GCAL/HR)
0.9
Mass Steam (lb/yr) 2.0E+06
Construction Material Cast Iron
Utility Cost ($/year) $ 12, 000
Purchase Cost $ 207, 000
Bare Module Cost $ 481, 000
73. 72
Filter 3
Identification Item MgCl2Filter
Item No. FILT3
No. Required 1
Function Remove solid MgCl2 crystals from solution
Operation Continuous
Type Continuous Rotary Drum Vacuum Filter, 20rph
Stream ID Feed Liquid Product Solid Product
FILTPUMP3 MGRECYC PRODUCT
Flow Rate (kg/hr) 75000 73000 1600
Pressure (bar) 3 2 2
Temperature (°C) 25 25 25
Design Data: Operating Pressure (bar) 2
Diameter (ft) 6
Cross-Sectional Area (ft2
) 30
Heat Duty
(GCAL/HR)
0.00
Mass Steam (lb/yr) 0.00E+00
Construction Material Cast Iron
Utility Cost (/year) $ 0.00
Purchase Cost $ 116, 000
Bare Module Cost $ 269, 000
74. 73
Settler Tanks
Settler Tank 1
Identification Item Settler Tank 1
Item No. SETT1
No. Required 1
Function Settles EVAP2 bottoms product and sends solid to CENT1
Operation Continuous
Type Tank
Stream ID Feed Outlet 1 Outlet 2
PUMPBOTT2 EF3 SLURRY2
Flow Rate (kg/hr) 249000 174000 75000
Temperature (°C) 90 90 90
Pressure (bar) 2 1.5 1.5
Design Data:
Internal gauge pressure (psig) 11.3
Shell Thickness (ft) 0.04
Length (ft) 22
Construction Material Carbon Steel
Purchase Cost $ 86, 000
Bare Module Cost $ 358, 000
75. 74
Settler Tank 2
Identification Item Settler Tank 2
Item No. SETT2
No. Required 1
Function Settles EVAP3 bottoms product and sends liquid to CENT2
Operation Continuous
Type Tank
Stream ID Feed Outlet 1 Outlet 2
PUMPBOTT3 CARNAL SLURRY1
Flow Rate (kg/hr) 135000 20000 115000
Temperature (°C) 115 115 115
Pressure (bar) 2 1.5 1.5
Design Data:
Internal Gauge Pressure (psig) 11
Shell Thickness (ft) 0.04
Length (ft) 26
Construction Material Carbon Steel
Purchase Cost $ 108, 000
Bare Module Cost $ 448, 000
76. 75
Leach Tanks
Leach Tank 1
Identification Item Leach Tank
Item No. Leach
No. Required 1
Function Settles EVAP3 bottoms product
Operation Continuous
Type Tank
Stream ID Feed 1 Feed 2 Feed 3 Outlet
COLDWAT SOLDCARN MGRECYC FILT2IN
Flow Rate (kg/hr) 16000 7200 73000 95000
Temperature (°C) 5 25 25 15
Pressure (bar) 1 2 2 0.5
Design Data:
Internal Gauge Pressure (psig) 11
Shell Thickness (ft) 0.02
Length (ft) 8
Construction
Material
Carbon Steel
Purchase Cost $ 18, 000
Bare Module Cost $ 58, 000
77. 76
Mixer Tanks
Mixer Tank 1
Identification Item Mixer Tank 1
Item No. MIXFEED
No. Required 1
Function Mixes brine feed stream with the recycle
Operation Continuous
Type Tank
Stream ID Feed 1 Feed 2 Outlet
AERFED CARNLIQ MIXFEED
Flow Rate
(kg/hr) 163000 20000 183000
Temperature
(°C) 50 25 44
Pressure (bar) 0.2 2 1.2
Design Data:
Internal Gauge Pressure (psig) 11
Shell Thickness (ft) 0.04
Length (ft) 28
Construction Material Carbon Steel
Purchase Cost $ 86, 000
Bare Module Cost $ 277, 000
78. 77
Mixer Tank 2
Identification Item Mixer Tank 2
Item No. DISTMIX
No. Required 1
Function Mixes concentrated brine, centrifuge liquid and settler recycle
Operation Continuous
Type Tank
Stream ID Feed 1 Feed 2 Feed 2 Outlet
PUMPBOTT1 CLIQ SLURRY1 EF2
Flow Rate (kg/hr) 164000 40000 115000 309000
Temperature (°C) 50 25 115 63
Pressure (bar) 0.15 1 1.5 1
Design Data:
Internal Gauge Pressure (psig) 11
Shell Thickness (ft) 0.04
Length (ft) 36
Construction
Material
Carbon Steel
Purchase Cost $ 125, 000
Bare Module Cost $ 401, 000
79. 78
Mixer Tank 3
Identification Item Mixer Tank 3
Item No. MIXTANK
No. Required 1
Function Mixes carnallite solution with feed water before entering carnallite crystallizer
Operation Continuous
Type Tank
Stream ID Feed 1 Feed 2 Feed 2 Outlet
CARNAL2 FEEDWAT KCLRECY CRSTFED1
Flow Rate (kg/hr) 12000 16000 2400 30000
Temperature (°C) 25 25 25 35
Pressure (bar) 1 1 2 1
Design Data:
Internal Gauge Pressure (psig) 11
Shell Thickness (ft) 0.03
Length (ft) 9
Construction Material Carbon Steel
Purchase Cost $ 16, 000
Bare Module Cost $ 51, 000
80. 79
Pumps
PUMP 1
Identification Item Pump
Item No. PUMP1
No. Required 1
Function Pump mixed feed to first flash evaporator
Operation Continuous
Type Centrifugal, 3600RPM
Stream ID Inlet Outlet
MIXFEED EF1
Pressure (bar) 0.15 2
Design Data: Flow Rate (kg/hr) 183000
Pump Head (ft) 52
Brake Horsepower (Hp) 480
Electricity Consumed
(kWh) 88000
Construction Material Cast Iron
Brake Efficiency 89%
Motor Efficiency 93%
Utility Costs ($/year) $ 6,800
Pump Purchase Cost $ 24, 000
Motor Purchase Cost $ 29, 000
Bare Module Cost $ 176, 000
81. 80
PUMP 2
Identification Item Pump
Item No. PUMP2
No. Required 1
Function Pump EVAP1 bottoms product to mixer tank
Operation Continuous
Type Centrifugal, 3600RPM
Stream ID Inlet Outlet
BOTT1 PUMPBOTT1
Pressure (bar) 0.15 2
Design Data: Flow Rate (kg/hr) 154000
Pump Head (ft) 52
Brake Horsepower (Hp) 10
Electricity Consumed (kWh) 74000
Construction Material Cast Iron
Brake Efficiency 89%
Motor Efficiency 86%
Utility Costs ($/year) $ 5,700
Pump Purchase Cost $ 24, 000
Motor Purchase Cost $ 860
Bare Module Cost $ 82, 000
82. 81
PUMP 3
Identification Item Pump
Item No. PUMP3
No. Required 1
Function Pump EVAP2 bottoms product to settler tank
Operation Continuous
Type Centrifugal, 3600RPM
Stream ID Inlet Outlet
BOTT2 PUMPBOTT2
Pressure (bar) 0.5 2
Design Data: Flow Rate (kg/hr) 249000
Pump Head (ft) 42
Brake Horsepower (Hp) 10
Electricity Consumed
(kWh) 82606
Construction Material Cast Iron
Brake Efficiency 88%
Motor Efficiency 86%
Utility Costs ($/year) $ 6,400
Pump Purchase Cost $ 31, 000
Motor Purchase Cost $ 860
Bare Module Cost $ 106, 000
83. 82
PUMP 4
Identification Item Pump
Item No. PUMP4
No. Required 1
Function Pump EVAP3 bottoms product to settler tank
Operation Continuous
Type Centrifugal, 3600RPM
Stream ID Inlet Outlet
BOTT3 PUMPBOTT3
Pressure (bar) 1.15 3
Design Data: Flow Rate (kg/hr) 135000
Pump Head (ft) 24
Brake Horsepower (Hp) 10
Electricity Consumed (kWh) 25000
Construction Material Cast Iron
Brake Efficiency 89%
Motor Efficiency 86%
Utility Costs ($/year) $ 2,000
Pump Purchase Cost $ 15, 000
Motor Purchase Cost $ 860
Bare Module Cost $ 53, 000
84. 83
PUMP 5
Identification Item Pump
Item No. PUMP5
No. Required 1
Function Pump crystallizer outlet through filter
Operation Continuous
Type Centrifugal, 3600RPM
Stream ID Inlet Outlet
FILT1IN FILTPUMP1
Pressure (bar) 0.5 3
Design Data: Flow Rate (kg/hr) 30000
Pump Head (ft) 70
Brake Horsepower (Hp) 10
Electricity Consumed (kWh) 14000
Construction Material Cast Iron
Brake Efficiency 55%
Motor Efficiency 86%
Utility Costs ($/year) $ 1, 000
Pump Purchase Cost $ 3,000
Motor Purchase Cost $ 860
Bare Module Cost $ 13, 000
85. 84
PUMP 6
Identification Item Pump
Item No. PUMP6
No. Required 1
Function Pump leach tank outlet through filter
Operation Continuous
Type Centrifugal, 3600RPM
Stream ID Inlet Outlet
FILT2IN FILTPUMP2
Pressure (bar) 0.5 3
Design Data: Flow Rate (kg/hr) 95000
Pump Head (ft) 70
Brake Horsepower (Hp) 10
Electricity Consumed (kWh) 45000
Construction Material Cast Iron
Brake Efficiency 79%
Motor Efficiency 86%
Utility Costs ($/year) $ 3,400
Pump Purchase Cost $ 5,300
Motor Purchase Cost $ 860
Bare Module Cost $ 20, 000
86. 85
PUMP 7
Identification Item Pump
Item No. PUMP7
No. Required 1
Function Pump crystallizer outlet through final filter
Operation Continuous
Type Centrifugal, 3600RPM
Stream ID Inlet Outlet
FILT3IN FILTPUMP3
Pressure (bar) 0.5 3
Design Data: Flow Rate (kg/hr) 75000
Pump Head (ft) 70
Brake Horsepower (Hp) 10
Electricity Consumed (kWh) 37000
Construction Material Cast Iron
Brake Efficiency 77%
Motor Efficiency 86%
Utility Costs ($/year) $ 2,800
Pump Purchase Cost $ 5,000
Motor Purchase Cost $ 860
Bare Module Cost $ 20, 000
87. 86
Equipment Cost Summary
The cost of the equipment used to build the GE concentrator System and the MgCl2
Separator Unit are listed in Table 13 and Table 14 respectively. These costs were determined using
Product and Process Design Principles by Seider et al. The block name refers to the piece of
equipment found in the Visio spreadsheets. The total cost of the plant equipment for the GE
concentrator System is $8,980,000 compared to the MgCl2 Separator Unit priced at $6,960,000 By
switching to the MgCl2 Separator Unit, we save 23% on equipment cost. Additionally, with an
estimated revenue of $2.6million from the recovered MgCl2, we roughly targeted five-fold cost
for the new plant at $12,500,000. We were able to meet our manufacturing goal at only 56% of
the anticipated cost.
90. 89
Waste Disposal Methods
The current methods of waste disposal in the Carlsbad facility involve mixing the
concentrated brine wastewater with the cooling water from the desalination process and returning
the water to the ocean [32]. A smaller plant north of the Carlsbad facility is using an existing
outfall that has pinholes to introduce small amounts of the brine back into the ocean [33]. Both
of these options can be implemented with no additional variable costs and are environmentally
sound as a method of dealing with the waste stream from the magnesium chloride separation
system.
Environmental Hazards
The main environmental hazards directly associated with our process are greenhouse gas
emissions associated with electricity consumption and environmental impacts resulting from waste
disposal from the process. Additionally, the seawater intake step from the desalination plant is a
considerable area of concern; however, this step results from upstream processing from the
desalination plant [36].
Water Intake Upstream
In 2006 an Environmental Impact was conducted to assess the potential risk to adjacent
water systems, marine life, and air quality prior to construction of the Carlsbad desalination
plant. With regard to marine life, the intake of seawater into the plant causes impingement of
microorganisms such as fish larvae, while small fish may be caught on intake screens or intake
bars. The EIR determined that this danger to the fish was insignificant for two reasons. One being
that it was concluded that the survival rate of the larvae had no notable effect on the fish
population. Additionally, the fish death resulting from sea water intake is less than the fish death
resulting from fish being consumed by brown pelicans [36].
91. 90
Brine Waste Disposal
Brine waste disposal methods determine the potential adverse effects to the
environment. If a deep well injection method of disposal is used, there is a risk of infiltration and
contamination to nearby aquifers. However, surveying can be done to assess whether or not there
are any at risk aquifers near a proposed injection site to prevent contamination.
If a landfill disposal method is selected there is also a possibility that salt constituents
penetrate through the soil and contaminate feed water, ponds, or aquifers. Areas at risk include
soil that has high cationic transfer capacity, high permeability, or a low clay content. A study
conducted in eastern Abu Dhabi concluded that landfill disposal techniques caused trace amounts
of brine components to show up in nearby water sources such as ponds and aquifers, sometimes
exceeding maximum allowable levels. To prevent infiltration of the brine components into soil,
the landfill can be lined. A survey and assessment of the soil may also be considered to determine
whether it is a good location for a landfill based on soil characteristics and proximity to water
sources.
To assess whether a liquid disposal is a suitable method of waste disposal, it is important
that the brine output location has a high water velocity to prevent sedimentation from occurring.
If sedimentation of brine constituents occurs, it puts the area at risk for adsorbing these species;
however, adsorption does not pose an extreme threat to the marine life. The following species are
considered sensitive to salinity: algae, coral reefs, seaweed bays, salt marsh containing
marcophytes, and mangal areas. If any are present in close proximity to the disposal site, a
different location or disposal method ought to be selected.
Brine salinity is considered to be toxic to a marine environment if it impedes growth,
survival, or reproduction. Wet Effluent Toxicity (WET) is a technique used to measure the
92. 91
threshold at which the whole effluent become both acutely and chronically toxic to surrounding
marine life. WET involves the use of bioassays of sensitive marine species such as fish,
invertebrates, or plants. WET has been used widely in Australia and has determined the necessity
of dilution ratios from 40:1-45:1 to protect 99% or above of marine life.
Salinity Tolerance Evaluation (STE) is the test used to determine impacts on marine life
for both the Carlsbad and Huntington Beach desalination plants. It is a long term test spanning 5
months during which, 18 species are exposed to a large range of salinities in a single
aquarium. The range of salinities tested is meant to observe the marine life in the extreme, worst
case scenarios, to mimic the maximum possible salinity that may be achievable by the liquid
discharge system. STE confirmed that while some species were sensitive to the salinity increases,
none were at risk for death as all species could tolerate the worst possible salinity, 40 mg/L [30].
Greenhouse Gas Emissions
Greenhouse gas emission are inherent in electricity use associated with plant
operation. The EIR concluded that greenhouse gas emissions were not substantially harmful to
the atmosphere [36].
Mitigation Techniques
Poseidon Water is the private owner of the Carlsbad desalination plant. Poseidon has
enacted a mitigation plan including the purchase of 66 acres of salt flats with construction and
contouring to cause water to wash over and create new wetlands. The creation of the wetlands and
facilitation of a new estuary would create a new environment to host fish similar to those harmed
by the intake to the plant [35]. To minimize the carbon footprint associated with the plant,
Poseidon is installing solar panels to provide a non-fossil fuel alternative power source, while
purchasing carbon offsets [36].
93. 92
Safety Measures
Concentrated brine is not considered a significantly hazardous material. With respect to
human safety, brine should be kept away from eyes and skin and not directly inhaled. However,
exposure of this nature is not fatal and should only cause irritation. Brine is not significantly
dangerous unless ingested, in which case nausea, stomach, and bowel irritation are possible, with
the worst possibility being death. Brine is not flammable, highly explosive, or combustible. If a
spill occurs, the leak should be confined as safely as possible and kept away from waterways. A
vacuum or pump can be used to remove the brine, and the affected area should be washed with
water. Measures can be taken with handling that includes routine inspection of pipes and
equipment to check for corrosion, as brine is corrosive over time [37].
Pump Safety
Pumps must be installed and properly grounded in accordance with (CA code) code to
prevent risk of electric shock. Additionally, be sure to disconnect the pump from its electrical
source prior to servicing or handling to prevent risk of electric shock. Give time for the pump to
cool down after disconnecting prior to servicing and handling. A pump may be very hot if in
contact with skin directly after use. After maintenance or handling, safety devices must be replaced
prior to operation. If the discharge valve is closed and the pump is operating, this may cause the
seal to fail or create very high pressure, high temperature steam which can cause an explosion or
burns if in contact with skin. It is recommended that a pressure relief valve be installed on the
pump to prevent this situation. If pump is operated at a higher pressure than recommended, the
motor may overheat which can be dangerous.
When the pump is connected to electricity source and in operation, it can be dangerous to
put fingers in suction or discharge locations. Loose clothing should not be worn near these
openings either [38].
94. 93
Location & Other Concerns
We have decided to locate our plant in Carlsbad, California, as the necessary infrastructure
is already in place for upstream desalination using reverse osmosis and downstream waste disposal
into the ocean. The established location for desalination also ensures a market for our product near
the facility, which will help to minimize additional transportation costs of the water. The issues
with drought that have plagued the San Diego region for many years ensure a sustainable demand
for water. Additionally, since Carlsbad is an established location for desalination, the city has also
shown their support for the construction of similar projects [39]. Building in San Diego, a
metropolitan area, creates simplistic avenues for the transportation and distribution of our
byproducts, MgCl2 and KCl.
Potential concerns to be aware of with regard to operating a plant involved in brine
concentration are fouling, biological growth, and the location of process controls. Fouling can
occur over time due to the variety of components present in the brine. Some of these components
may result in precipitates, which can accumulate over time, so chemical cleaning processes may
be considered. Often, in plants dealing with desalination, the feed stream is chlorinated with either
free chloride or NaCl prior to entering the process to prevent biological growth. Because we are
receiving a concentrated brine from an RO plant, the chlorine content is already substantial enough
that we are not concerned with biological growth. Finally, with a process that deals heavily with
water, it is important to make sure that the controls are located in a place not at risk of contact with
the water as this may cause damage [34].
Furthermore, we have taken into account the solid content of all of the streams in both the
GE Brine Concentrator and the MgCl2 separation unit in order to assess whether or not solid-
specific pumps are necessary to pump the respective streams from block to block. After doing so,
95. 94
we have determined that centrifugal pumps will suffice all throughout both processes entirely;
solid fractions range from 0 (mainly distillate water streams) to approximately 0.35 (predominantly
bottoms product streams from crystallizers and flash vessels), which are within the pumpable limit
for a generic, 75Hp centrifugal pump. This analysis was absolutely vital in guaranteeing an
accurate utilities assessment and subsequently a profitability analysis; solid-specific pumps would
have significantly increased utility (power) consumption for either system, inadvertently raising
overall costs and thus diminishing our process’ profitability. By controlling the solid fractions
throughout the process, we are able to maximize profits while still recovering a substantial amount
of water and crystalline products.
96. 95
Profitability Analysis
The main factors that determine the profitability of each system include the products,
byproducts, and utilities. The product is the same for both systems, however the MgCl2 Separator
Unit produces additional byproducts of MgCl2 and KCl. The GE Brine Concentrator System does
not yield any byproducts. For every pound of water, 0.0055 lb MgCl2 and 0.00047 lb KCl are
produced. The combination of revenue from these byproducts generates $1,414,988 per year. The
utilities required for both plants include low pressure steam, cooling water, and electricity. Due to
the choice of equipment, the MgCl2 Separator Unit requires more pounds of steam and cooling
water per pound of water produced than the GE Brine Concentrator System. On the other hand, it
requires fewer kWh of electricity per pound of water than the GE Brine Concentrator System.
Overall, the utilities for the MgCl2 Separator Unit are less than that of the GE Brine Concentrator
System by 75%. With regard to equipment costs, the GE system costs roughly $8.3 million, while
the MgCl2 Separation Unit has equipment costs of $6.7 million. Further analysis of equipment
costs can be found later on in this section. Figure 12 shown below gives a summary of major
profitability measures. Tables 15-35 give a more thorough profitability analysis.
Figure 12. Profitability Comparison between MgCl2 Separation Unit and GE Brine Concentrator
0
2000000
4000000
6000000
8000000
10000000
12000000
14000000
16000000
18000000
Total Permanent
Investment
Annual Utilities
Cost
Total Equipment
Cost
Annual Byproduct
Revnue
($)
GE
Magnesium Chloride
Separation Unit