2. i
Abstract
Growing food locally, through community-supported agriculture, community gardens,
and home gardens, can increase availability, accessibility, and affordability of fruits and
vegetables. Although numerous studies have demonstrated the potential associations between
local food production and healthy diets within the community garden context, fewer studies have
focused on the role of the home garden and whether it is amenable to intervention. In a
predominantly low-income and Latino community in west Denver, Re:Vision International aims
to promote the use of home gardens to improve diet, activity, blood pressure, weight status, and
overall health. In partnership with Re:Vision, we conducted a post-hoc analysis of survey data to
understand the associations between participation in the home garden program and diet, self-
reported health, exercise, body mass index, and blood pressure (n=37). After adjusting for
income, marital status, gender, age, and neighborhood attachment, no statistically significant
relationships were observed. These analyses are severely limited by a small sample size.
However, the direction, dose response relationship, and biological significance suggest that
further investigation of home gardens and population health outcomes are warranted. Although
no definite conclusions can be drawn, the literature and the direction of the results suggests that
participation in a community-based intervention to home gardening may have the potential to
change resident’s diet and blood pressure. Further research is needed to confirm these
postulations.
3. ii
Table of Contents
Introduction..................................................................................................................................... 1
Background..................................................................................................................................... 3
Literature Review............................................................................................................................ 5
Community-Supported Agriculture............................................................................................. 5
Community Gardens ................................................................................................................... 7
Home gardens........................................................................................................................... 10
Community based interventions................................................................................................ 11
Methods......................................................................................................................................... 13
Population Characteristics....................................................................................................... 13
Study Design ............................................................................................................................. 14
Measures................................................................................................................................... 15
Eating Habits and Physical Activity ..................................................................................... 15
Self-rated health.................................................................................................................... 15
Neighborhood Attachment and Social Activities ................................................................. 15
Participation.......................................................................................................................... 16
Covariates................................................................................................................................. 17
Disclaimer................................................................................................................................. 17
Data Results and Analysis ............................................................................................................ 18
Diet............................................................................................................................................ 22
Self-reported health .................................................................................................................. 23
Body mass index........................................................................................................................ 24
Blood Pressure.......................................................................................................................... 25
Exercise..................................................................................................................................... 26
Discussion..................................................................................................................................... 27
Limitations.................................................................................................................................... 33
Recommendations......................................................................................................................... 34
Appendix I .................................................................................................................................... 36
Bibliography ................................................................................................................................. 40
4. iii
Acknowledgements
I would like to acknowledge my three advisors, Jill Litt, Peter Newton, and Dale Miller,
for their continued support, expertise, and encouragement throughout this project. I would also
like to thank Philip Pendergast for his fluency in STATA. His guidance with this challenging
statistical analysis software helped me realize my own skills and proficiency in statistics. Also, I
would like to offer my special thanks to Kristin Lacy of Re:Vision International. Without her
willingness to help, this project would not have been possible.
5. 1
Introduction
There is reason to believe the environment and our current food system are contributing
factors to an increasing number of deaths attributed to chronic diseases, such as obesity and
coronary heart disease (General & Board, 1988). Studies indicate that by eating more complex
carbohydrates and fiber in the form of fruits and vegetables, the risk of chronic disease is greatly
reduced (General & Board, 1988; Horrigan et al. 2002). In light of this, many scholars have
taken a broader look at our current food system and observed how it relates to public health.
Recent studies have suggested that although their motivations may differ, members participating
in community-supported agriculture, community gardens, and home gardens have increased the
variety, quantity, and freshness of fruits and vegetables that they consume. Some of these
programs also offer an accessible, affordable, and available means to procure produce.
The literature on this topic largely looks at self-reported, subjective measures of health
and fruit and vegetable consumption. Moreover, research on intervention-based home gardening
is lacking. This type of gardening involves effort from a community to improve access,
availability, and affordability of nutritious foods by training low-income residents in how to
maintain and cultivate home gardens. Intervention-based home gardening does show promise to
modify eating habits (Carleton et al., 1995; Goodman, 1995; “Position of the American Dietetic
Association,” 2006). In this thesis, I will explore a more robust, objectively measured survey on
the direct link between intervention based home gardening and intermediate health outcomes. I
will examine how participation in a community-based intervention to home gardening in a
residential neighborhood in Denver, Colorado has impacted health behaviors (diet and physical
activity) and health status (body mass index and blood pressure) by improving access,
affordability, and availability of healthy foods to low-income residents. This study is unique
because the survey employed community-based trained health workers (also referred to as
6. 2
“promotoras”) to objectively measure people’s height, weight, and blood pressure and includes
longitudinal information about participation in the home garden program. The research
hypothesis is as follows: those participating in a community-based approach to home gardening
will have lower blood pressure and body mass index, as well as increased levels of exercise, self-
reported health, and fruit and vegetable consumption relative to how many years they have
participated in Re:Vision. The research has implications for policy that addresses food security
and issues of obesity and chronic disease at the local level.
7. 3
Background
The current U.S. food market is inundated with subsidized crops of soybeans and corn
(Fields, 2004). As a result, fattening snacks, fast food, and corn-feed beef and pork have
encountered a major decrease in price, incentivizing more Americans to make unhealthy dietary
decisions (Fields, 2004). For example, the average American consumes about 154% (males) or
127% (females) of their recommended daily allowance for protein (Horrigan et al., 2002). This
increased intake of protein presents many problems, as about 67% of protein consumption is
derived from animal sources high in saturated fat and cholesterol (Horrigan et al., 2002).
According to the Surgeon General’s Report on Nutrition and Health (1988), diets high in
saturated fat and cholesterol are associated with an increased risk of obesity, coronary heart
disease, some types of cancer, and gallbladder disease. However, evidence from laboratory
animal studies and human metabolic and population studies indicates that reversing these dietary
patterns can greatly reduce the risk of chronic disease and considerably improve one’s health
(General & Board, 1988). Incorporating a diet high in complex carbohydrates and fiber in the
form of fruits, vegetables, and whole grains is a solution (General & Board, 1988; Horrigan et
al., 2002). Moreover, diets containing a variety of vegetables prevent obesity, coronary heart
disease, hypertension, diabetes, and some types of cancer (Horrigan et al., 2002).
Many Americans consume less fruits and vegetables than is recommended by the U.S.
Department of Agriculture (Guenther et al., 2006). This phenomenon can be explained by a lack
of access, availability and affordability of healthy foods in low-income areas (Litt et al., 2011;
Ploeg, 2010). Some households live more than a mile from the nearest supermarket and don’t
own a vehicle for easy transportation (Ploeg, 2010). These households may, therefore, purchase
the majority of their groceries at smaller convenience stores that inherently have higher priced
goods as compared to supermarkets (Ploeg, 2010). The issue of access, affordability, and
8. 4
availability of healthy foods may be combatted by the introduction of alternatives to the
industrial food system. Monitoring whether and how these alternatives impact participants’
health through the consumption of fruits and vegetables is critical.
9. 5
Literature Review
Urban agriculture is defined as the growing, distributing, and processing of local produce
within a city’s borders (Kaak, 2012). It has seen a tremendous increase since the 1970s,
indicating that people are ready for a more available, affordable, accessible, food alternative
(Kaak, 2012). Urban agriculture includes a variety of different practices, but the three discussed
primarily in this thesis will be community-supported agriculture, community gardens, and home
gardens.
Community-Supported Agriculture
Community-supported agriculture (CSA) aims to reconnect the consumer with the
producer by offering a safe, fresh, high quality option for buying fruits and vegetables (Adam,
2006). CSAs depend on support from the community and the shareholders. Each member of a
CSA pays a fixed amount every season in exchange for a box of ripe, fresh produce each week.
Members, in turn, may develop a stronger relationship with the farmer, the land, and the food
(Sharp et al., 2002). CSAs first came to the U.S. in 1986 with the hopes of strengthening local
economies, providing food security, and revitalizing the direct-famer-to-consumer ideal (Adam,
2006). Jan Vander Tuin, a Swiss working on a biodynamic farm in Switzerland, was drawn to
Massachusetts after reading articles in Rodale’s Organic Gardening Magazine (Van En, 2007).
He gathered other community members to assist him in growing an apple orchard where
members distributed and sold 30 shares of apples, apple juice, cider, and vinegar (McFadden,
2004). This farm proved to be the rudimentary beginning of a CSA. The first CSA, however, was
created while this project was underway; Vander Tuin and other community members went on to
create the “CSA Garden at Great Barrington” (McFadden, 2004).
Although CSAs are, for most members, a money saving proposition in comparison to
buying organic produce in the store and paying for the many miles the food must be transported,
10. 6
the shareholders usually do not believe money to be their first consideration (Goland, 2002).
They are often motivated by social, political, environmental, and health concerns (Goland,
2002). The shareholders see a direct link between the modern food system, poor health, and
environmental degradation. This is a major motivating factor for joining a CSA. Nevertheless,
those participating in a CSA reported better eating habits (C. Brown & Miller, 2008). In a study
of four CSA farms in Pennsylvania, 74% of members reported eating a greater variety of produce
and 58% increased the quantity of produce consumed (C. Brown & Miller, 2008). Some
shareholders reported shopping less, changing their dietary habits, and eating more, fresher, and
a greater variety of vegetables (C. Brown & Miller, 2008). Although these findings imply
causation, they are observational. Experimental studies are needed to better understand whether
and how CSAs lead to increased fruit and vegetable consumption and changes in other outcomes.
Other observational and qualitative studies, for example, have shown mixed results. In a
study conducted by Goland (2002), she found that many CSA participants were discouraged by
the additional amount of time they devoted to preparing food; many of the items provided by the
CSA were only incorporated into meals with difficulty. A few participants stated that they found
no overall difference in their diet before and after joining a CSA (Goland, 2002). Some members
reported that participating in a CSA forced them to find new ways to prepare foods and to try
more vegetables (Goland, 2002). The majority of shareholders felt they altered their eating
patterns to incorporate more fruits and vegetables, again reaffirming that CSAs have the potential
to modify health behaviors (Goland, 2002).
In order for residents to reap the nutritional benefits of a CSA, it must be accessible. As
defined by the World Health Organization, accessibility is having enough resources to obtain
food for a nutritious diet (“WHO | World Health Organization,” n.d.). Often, the farmers of the
11. 7
CSA struggle to appeal to a broader audience and are concerned with the convenience of the pick
up site (Ruehrdanz, 2013). People are often too busy; making the trek across town once a week
to pick up their produce is perceived as cumbersome (Ruehrdanz, 2013). Affordability is another
issue that CSAs face. It often costs a one-time, upfront fee of a few hundred dollars to join a
CSA, something that most low-income residents cannot pay. Many CSAs are working to accept
other forms of payment, such as Supplemental Nutrition Assistance Programs and Women,
Infant, and Children benefits (Ruehrdanz, 2013). Many CSAs have implemented sliding scale
payment options and offer working shares in exchange for produce (Ruehrdanz, 2013).
Addressing the issues around accessibility, affordability, and availability of a CSA is crucial to
determining its future.
Community Gardens
Community gardens are an increasingly popular form of urban agriculture. At least three
models exist: 1) They are often characterized as a plot of land leased or rented to the community
from a landowner (Kaak, 2012). This land is then subdivided into several plots for individuals
and families to cultivate (Kaak, 2012); 2) All members of the community are involved and there
are no assigned plots; the community members collectively decide what is to be grown (Drake &
Lawson, 2015); and 3) A combination of the two exist in which there are both individual and
community plots (Drake & Lawson, 2015). Community gardens were first introduced by the
mayor of Detroit in the 1890s to help the citizens cope with the economic depression of the time,
as community gardens have been seen as a way to build community relationships, foster social
capital, and encourage collective efficacy (Litt et al., 2011; Litt et al., 2015; Lyson, 2004; Teig et
al., 2009). Today, however, there exists a popular archetype of the community garden where the
residents come together to transform a vacant and abandoned piece of property into a productive
12. 8
green space (Drake & Lawson, 2015). This is not the only way community gardens are initiated;
some require the involvement of various actors such as local governments, NGOs, and
government agencies.
The motivations of those participating in community gardens are often similar to that of
community-supported agriculture, but they may differ according to social and environmental
context. Participants living in urban residential neighborhoods that lack adequate food outlets
may be more likely to participate in a community garden for increased food security (Drake &
Lawson, 2015). Middle-class gardeners may focus on environmental stewardship instead (Drake
& Lawson, 2015). Nonetheless, some traits have been identified among all participants of
community gardens. Community gardeners reported consuming six out of 14 vegetable
categories far more frequently than did controls, and consumed sugary beverages and sweets less
frequently (Blair, Giesecke, & Sherman, 1991). In Flint, Michigan, adults were 1.4 times more
likely to consume fruits and vegetables if there was a household member participating in a
community garden, and 3.5 times more likely to consume fruits and vegetables at least five times
a day (Alaimo, Packnett, Miles, & Kruger, 2008). Moreover, according to Litt et al. (2011), 58%
of community garden participants reported consuming fruits and vegetables at least five times
daily, as compared to 25% of non-gardeners. A number of mechanisms can be used to explain
these dietary patterns, including social involvement, perceived aesthetic of the neighborhood,
and collective efficacy.
Collective efficacy is a shared link between mutual trust and the willingness to intervene
for the common good, and is correlated with health (Sampson, Raudenbush, & Earls, 1997; Teig
et al., 2009). The social processes described by gardeners such as social connections, reciprocity,
mutual trust, collective decision making, social norms, civic engagement, and community
13. 9
building, all contribute to high levels of collective efficacy (Teig et al., 2009). As a result,
collective efficacy provides social support and resources acquired through strong community ties
that are protective against poor health (Glover, Parry, & Shinew, 2005). Gardens also promote
social involvement and neighborhood aesthetic that is then correlated with higher ratings of
collective efficacy and neighborhood attachment. Collective efficacy is a factor that relates to
better self-reported health behaviors and outcomes (Litt et al., 2011; Litt et al., 2015).
Gardeners also experience reduced levels of stress hormones (K. H. Brown & Jameton,
2000). In a study surveying college students on stress, it was evinced that the “non-stressed”
students consumed more fruits and vegetables than the “stressed students” (Hudd et al., 2000).
The link between stress levels and fruit and vegetable consumption is important, as the gardeners
exhibiting less stress hormones demonstrate a negative correlation with fruit and vegetable
consumption. Ultimately, it is the contact with nature, the opportunity to interact and learn from
others, and the experience of gardening itself that relates to health promoting behaviors (Litt et
al., 2015). Moreover, these mechanisms and factors contribute to improved self-rated health (Litt
et al., 2015).
Community gardens are also accessible, affordable, and available. Many low-income
communities lack supermarket access, a problem that community gardens can remedy (Alaimo et
al., 2008). In Toronto, Ontario, participants in community gardening reported better access to
fresh, wholesome food (Wakefield, Yeudall, Taron, Reynolds, & Skinner, 2007). These same
participants also reported a marked difference in household food costs and more availability of
culturally appropriate foods (Wakefield et al., 2007). Since fruit and vegetable intake is greatly
dependent on the availability of fruits and vegetables, it is pertinent that alternative urban
agriculture is available, accessible, and affordable.
14. 10
Home gardens
Home gardening is a self-provisioning activity that can take different forms. It is the act
of growing and cultivating plants for ornamental or useful purposes (Schupp & Sharp, 2011).
Many low-income residents depend on gardens as a source of healthy, fresh produce. The history
of home gardening is complex, with many transformations affecting the types of production, the
motivations of the gardeners, and the number of people participating (Schupp & Sharp, 2011).
Home gardening was first brought to the United States with the early settlers as a means of
survival (Becker, 1984). As the 18th
century approached and more specialized jobs were created,
a new class of citizens emerged who gardened for leisure rather than necessity (Becker, 1984).
This trend has continued into modern times. As technology developed and markets, grocery
stores, and trading posts matured, gardening became less necessary for subsistence (Baker &
Izard, 1991). There were, however, early divisions associated with gardening and socioeconomic
status. Those with the highest socioeconomic status cultivated beautiful, lavish gardens that were
purely ornamental, while those with lower socioeconomic status reverted to cultivating gardens
for food production and sustenance (Schupp & Sharp, 2011). Similar motivations still exist
today. Moreover, under certain circumstances, some countries may be forced to move towards
sustainable home gardening practices. This was the case with Cuba after the United States
enforced a strict embargo against the country (Mckibben, 2005, n.d.).
Schupp and Sharp (2011), speculated that home gardening would be most prevalent for
households demonstrating economic hardship and environmental concern. Their results imply a
positive correlation between economic hardship and the presence of a household garden,
indicating that some garden as a way to increase their access, availability, and affordability of
fresh produce (Schupp & Sharp, 2011). Their results also concluded an association between pro-
15. 11
environmental behaviors and gardening (Schupp & Sharp, 2011). These data reveal that different
motivations for participating in home gardens is very similar to that of community gardens:
residents take up gardening based on necessity or as a more sustainable alternative to the modern
food system.
Similarly, home gardens have comparable benefits in the scope of fruit and vegetable
consumption. About 37% of home gardeners report consuming fruits and vegetables at least 5
times a day as compared to 25% of nongardeners (Litt et al., 2011). This, in part, is due to the
increased access to fruits and vegetables that gardens provide. According to Morton et al. (2007),
increased access to fruits and vegetables from home gardens results in significantly more variety
and diversity of fruits and vegetables in the diet. Personal production and sharing of garden
produce is positively related with households at all income levels meeting recommended
vegetable servings (Morton, Bitto, Oakland, & Sand, 2007). Ultimately, home gardening is a
third effective way to increase fruit and vegetable intake that may have significant implications
for modifying dietary patterns and therefore health outcomes.
Community based interventions
Although there have been studies documenting the fruit and vegetable consumption of
home gardeners, there has been little research on community-based interventions to home
gardening. Community-based interventions, in the scope of this study, are defined as an
intervention aimed to increase access, affordability, and availability of nutritious foods through
the training and educating of low-income residents in how to maintain and cultivate home
gardens. Community-based interventions, therefore, target community members and have an
emphasis on structural change beyond the scope of the individual (“Position of the American
Dietetic Association,” 2006). These interventions have been proven to be feasible and capable of
16. 12
altering some aspects of healthy eating (“Position of the American Dietetic Association,” 2006).
For example, “the Heart to Heart Project” revealed a community-based intervention that affected
participants cholesterol and smoking habits in a favorable way (Goodman et al., 1995). Similar
results were found in the Pawtucket Heart Health Program, a community-based intervention that
targeted and reduced member’s body mass index and cardiovascular risk factors as related to a
comparison city (Carleton et al., 1995). Nevertheless, the evidence base for these interventions in
the realm of home gardening has not yet been explored (“Position of the American Dietetic
Association,” 2006). Moreover, the findings presented by the American Dietetic Association on
fruit and vegetable consumption have been measured subjectively and therefore may be prone to
recall bias. To address the knowledge gap, this research will analyze and report on data collected
by trained health professionals to objectively measure the relationship between participation
among community-based home gardeners and health status.
17. 13
Methods
Re:Vision International is a non-profit organization based in Denver that is committed to
training residents in cultivating home gardens. They employ a community-based approach that
aid residents in fostering home gardens. Part of their mission is to develop a self-sustaining food
system that will increase access, availability, and affordability to low-income residents.
Re:Vision is committed to empowering community members by offering them a way to grow
their own food. They also have a vested interest in how participation in the program will impact
access to healthy food, increase community connection, improve physical activity, and improve
overall health. This thesis will provide Re:Vision with an understanding as to how participation
relates to other intermediate health outcomes. The research analysis was approved by the
Institutional Review Board on February 9, 2016.
Population Characteristics
Health workers employed by Re:Vision assessed subjective and objective health
measures for 99 households. Re:Vision selected these households based on participation in the
program and a willingness to participate in the “Basic Health Examination.” Re:Vision
emphasized recruiting Spanish-speaking members of low-income families. The 99 families that
chose to participate in the “Basic Health Examination” are nested within a larger population of
residents participating in Re:Vision’s home garden programs. According to the “Re:Vision Year
2 Evaluation Summative Report” conducted in 2015 (n=179), 81% of residents are female,
81.6% are Hispanic or Latino, 66.9% are married, and 76.1% have an annual household income
less than $35,000. Residents were also asked how long they have had a garden with Re:Vision
International. As of 2015, approximately 46.4% indicated having a garden for less than a year,
17.9% had a garden between two and three years, 9.5% had a garden between three and four
years, and 5% indicated having a garden for four or more years.
18. 14
Study Design
We drew from three surveys and linked each household with a unique identification that
is similar across all three surveys. The three surveys are the “Gardener Survey Summary Year
1” from 2014, “Gardener Survey Summary Year 2” from 2015, and the “Basic Health
Examination Survey” from 2015. Not all of the residents participating in the “Basic Health
Examination” also took part in the “Gardener Survey Summary Year 1” and the “Gardener
Survey Summary Year 2.” All three surveys were administered by ‘promotoras’ through
Re:Vision. Promotoras are community members tasked with providing support to the participant
households with home gardens, initiating community meetings, and aiding in the evaluation
process.
We used linear and logistic regression techniques to relate the data from the “Basic
Health Examination” survey to the “Gardener Survey Summary Year 1” and the “Gardener
Survey Summary Year 2.” Each household was assigned a unique identifier by the promotoras
that made it possible to link the “Gardener Survey Summary Year 1” and the “Gardener Survey
Summary Year 2” to the “Basic Health Examination.” With these linkages, we were able to
match 37 households (37.4% of the total 99 households that participated in the “Basic Health
Examination”). We then assigned each household a number once the households were linked to
ensure confidentiality. The independent variable is participation, which is assessed by the
number of years each gardener has been with Re:Vision. Statistical models were employed to
assess the association between participation and diet, physical activity, self-reported health,
objectively measured body mass index, and objectively measured blood pressure. Descriptive
measures are calculated to describe demographic, social, and health conditions in this study.
19. 15
Measures
The “Gardener Survey Summary Year 1” and the “Gardener Survey Summary Year 2”
address issues of eating habits, physical activity, self-reported health, neighborhood attachment,
and social activities. These surveys included 288 and 179 residents, respectively, and asked the
same questions. The average time for survey completion was 18 minutes.
Eating Habits and Physical Activity
Respondents were asked to indicate how often, in the past seven days, they drank a can of
soda, consumed fruits and vegetables, and ate fast food. They then were asked to assess the total
number of hours a week they exercised in various ways. To conduct the analysis with the latest
measures of physical activity, we used data from the “Basic Health Examination” in which
participants were asked, on average, how many hours a week they exercised.
Self-rated health
A single survey item asked respondents to rate their health status on a five-point scale,
one being poor and five being excellent. Respondents were then asked if they had health care
insurance coverage (yes or no) and approximately how much money they have spent in the last
12 months on medical expenses. A fourth survey item asked if participants had any of the
following health conditions: diabetes, cancer, kidney disease, autoimmune disease, high blood
pressure, depression (or any other mental health issues), asthma, heart disease, high cholesterol,
or other. For the purpose of this study, we only observe the association between participation and
self-rated health.
Neighborhood Attachment and Social Activities
Nineteen survey items were assessed on this subject. Participants were asked their
opinion of their neighborhood, whether or not they feel safe in the neighborhood, and how much
20. 16
impact they have on improving the community. Respondents were asked to reply to these
questions on a scale of “strongly disagree” to “strongly agree.” Then, respondents were asked a
variety of questions to assess how involved they are in the community, how much they trust their
neighbors, and whether or not they feel they can make a difference in their neighborhood. The
purpose of these survey questions is to assess resident’s level of neighborhood attachment and
collective efficacy. In this thesis, we will analyze neighborhood attachment. This measurement
is based on existing questionnaires and includes questions such as: “This is the ideal
neighborhood for me,” “I would like to live in another neighborhood,” “It would be very hard for
me to leave this neighborhood,” “I have nothing in common with this neighborhood,” “I feel safe
in this neighborhood,” and “I like my neighbors” (Bonaiuto, Aiello, Perugini, Bonnes, &
Ercolani, 1999; J.S. Litt et al., 2015).
Participation
Residents were then asked “How long have you had a garden with Re:Vision
International?” and were given five responses to this question: less than 1 year, between 1 and 2
years, between 2 and 3 years, between 3 and 4 years, or more than 4 years.
We proceeded to link the information in these surveys to respondents who participated in
the “Basic Health Examination.” Both surveys were offered in Spanish and English. The “Basic
Health Examination” employed trained promotoras to measure resident’s weight, height, and
blood pressure. From here, the promotoras referred to a table in the “Promotora manual” to
calculate resident’s body mass index. Then, respondents were asked to calculate how many hours
a week they are exercising, how many sugary drinks they consume in a week, and whether or not
they smoke. The rest of the questions ask respondents about doctor checkups, SNAP benefits,
and Medicaid.
21. 17
It is important to capture both subjective and objective measures of health status.
Objectively measured physical health can be defined as observable health outcomes, such as
body mass index or blood pressure, whereas subjective measures are personal ratings of overall
physical health (Ware, Brook, Davies, & Lohr, 1981). Subjective ratings can fall victim to same
source and recall bias, as well as social desirability response (Litt et al., 2011; Weden, Carpiano,
& Robert, 2008). Similarly, objective ratings may neglect participants’ views of their own health,
and health professionals may rely on different metrics to assess health (Ware et al., 1981). To
incorporate a more holistic study, both measures should be employed (Weden et al., 2008).
Covariates
We have identified several possible confounding variables. In this case, participation is
the exposure and body mass index, diet, self-reported health, blood pressure, and exercise are the
outcomes of interest. Marital status, gender, age, and income may possibly affect the outcome
and the exposure (more women with lower socioeconomic status may participate in the gardens).
Neighborhood attachment is a confounding variable as well as it may be related to both
participation and the outcome variables. Each of these confounding variables was measured
subjectively in the “Gardener Survey Summary Year 1” from 2014 and the “Gardener Survey
Summary Year 2” from 2015.
Disclaimer
The “Basic Health Examination” is the first health screening performed on residents. We
understand that body mass index and blood pressure are very limited in scope and it may take
several years to observe a significant change. The small sample size that we have obtained
created a data set that has relatively little statistical significance. Also, correlation does not imply
causation, as these findings are purely observational.
22. 18
Data Results and Analysis
After linking the “Gardener Survey Summary Year 1” and the “Gardener Survey
Summary Year 2” to the “Basic Health Examination,” our sample size is n=37. The 37
individuals represent those who participated in either the “Gardener Survey Summary Year 1”
from 2014 or the “Gardener Survey Summary Year 2” from 2015 and the “Basic Health
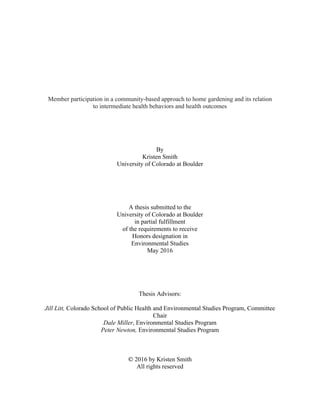
Examination.” Participant characteristics are shown in Table 1. The majority of participants were
female (78.38%), married (55.56%) and Hispanic or Latino (89.19%). The mean age was 51
years and on average, respondents had an annual income between $15,000 and $20,000. The
mean body mass index (BMI) for all study participants was 28.44, indicating that, on average,
the population is overweight (Garrouste-Orgeas et al., 2004). BMI is normally distributed with a
positive skew and several outliers (see histogram 1).
Histogram 1: BMI distribution among participants
0.02.04.06.08
Density
20 30 40 50
bmi
23. 19
The blood pressure of our study population indicates that for systolic blood pressure, on
average, participants had prehypertension, indicating that they are at risk for high blood pressure.
The diastolic readings, however, demonstrated that participants’ blood pressure was normal.
When both of these readings were combined, we found that about 29.73% of respondents had
high blood pressure. On average, respondents consumed 2.44 fruits and vegetables daily and
reported in participating in 0-3 hours of physical exercise weekly. The median self-reported
health was “good.” See the “frequency table” in Appendix I for more detailed reports.
About half of the study participants had had a garden with Re:Vision for less than a year,
33.34% had a garden with Re:Vision between 1 and 3 years, 13.89% had a garden with
Re:Vision between 3 and 4 years, and 2.78% had a garden with Re:Vision for more than 4 years.
There are some limitations to this finding. Since participants were not asked how long they had a
garden with Re:Vision International in the “Basic Health Examination,” we based our data off of
the 2014 “Gardener Survey Summary Year 1” and the “Gardener Survey Summary Year 2” from
2015. If study participants had only participated in the 2014 survey and had a garden with
Re:Vision the following year, this sets them a year behind. In the 2015 survey, respondents were
asked if they had had a garden with Re:Vision for “more than 4 years,” whereas in the 2014
survey, the choice was instead “more than 3 years.” As a result, we categorized participation into
two groups: those who had a garden with Re:Vision for less than a year and those who had a
garden with Re:Vision for more than a year. This was further justified because analyses were
initially conducted using all four categories in the Re:Vision Evaluation Findings Report from
2014. The results revealed no significant difference, indicating that the outcomes were only
noted after participants had had a garden with Re:Vision International for over a year.
24. 20
Table 1: Participant demographic characteristics
Participant
demographic
characteristics
(n=37)
Mean (Standard
Deviation)
Number
(Percentage)
Median Lowest-
highest
Age 51.32 (15.6) 48 28-92
Body Mass Index
n=36
Underweight
Normal
Overweight
Obese
28.44 (6.16)
1 (2.70)
10 (27.03)
11 (29.73)
15 (40.54)
27.2 18-48
Blood Pressure
Low
Ideal
Prehypertension
High
0
13 (35.14)
13 (35.14)
11 (29.73)
Prehypertension 54-178
Gender (% female) 29/37 (78.38%) Female
Hispanic or Latino
(% Hispanic)
33/37 (89.91%) Hispanic
Marital status (%
married)
20/37 (55.56%) Married
Annual income (%
less than $20,000)
19/37 (52.78%) Between
$15,000 and
$20,000
Participation in
Re:Vision
International (% less
than a year)
18/37 (50%) Less than a year
Diet (fruit and
vegetable intake
combined)
2.44 (0.85) 2.5 times per
day
0.5-4
Self-reported Health 2.75 (0.93) Good Poor-
Excellent
Neighborhood
Attachment
Low
High
3.37 (0.756)
17 (45.95)
20 (54.05)
3.5 1.83-4.83
Exercise 0-3 hours per
week
0-3 hours
per week -
7+ hours
per week
25. 21
For neighborhood attachment, we conducted Cronbach’s alpha test to measure the
internal consistency of six questions related to neighborhood attachment (Tavakol & Dennick,
2011). These six questions, (“This is the ideal neighborhood for me,” “I would like to live in
another neighborhood,” “It would be very hard for me to leave this neighborhood,” “I have
nothing in common with this neighborhood,” “I feel safe in this neighborhood,” and “I like my
neighbors”) were chosen based on existing questionnaires on neighborhood attachment and were
combined to create an attachment index ranging from one to five (Bonaiuto, Aiello, Perugini,
Bonnes, & Ercolani, 1999). Cronbach’s alpha was 0.7066, indicating that the measure had good
internal consistency (Tavakol & Dennick, 2011). The resulting measure of neighborhood
attachment was also normally distributed with a skewness close to zero (-0.231) and kurtosis
close to three (2.252). In our linear and logistic regressions, we controlled for neighborhood
attachment, age, gender, marital status, and income. These are all variables that may impact the
exposure (participation) and the outcomes.
Histogram 2: Neighborhood attachment distribution
0.1.2.3.4.5
Density
2 2.5 3 3.5 4 4.5
attach_avg
26. 22
Diet
Fruit and vegetable consumption was statistically higher among participants who were
single as compared to those who were married. Also, those with a higher body mass index tended
to consume fewer fruits and vegetables. There were no statistically significant relationships
between diet and participation in the program. Nevertheless, the positive correlation here is
noteworthy. Due to our small sample size, our findings are limited. This does not discount the
need for further research on the relationship between diet and participation in the program.
Table 2: Linear regression model results for diet
Diet
Coefficient Standard Error p
Overall
adjusted R2
Marriage 0.1167
2 -.24 .69 0.73
3 -.41 .95 0.67
4 .04 .61 0.95
5 .91 .39 0.03
Age -.01 .01 0.64
1.income_cat -.34 .32 0.29
2.Sex .13 .41 0.76
1.attachmed -.03 .33 0.93
1.part_gt1year .14 .33 0.68
BMI -.05 .02 0.05
_cons 2.66 .74 0.00
Marriage codes: 2, divorced; 3, separated; 4, widowed; 5, single
27. 23
Self-reported health
Self-reported health was statistically higher among respondents who reported higher than
average neighborhood attachment as compared to those with lower levels of neighborhood
attachment. Although there were no other statistically significant relationships found, some are
worth repeating: self-reported health was greater among those with an income of $25,000 or
higher. It was, however, negatively correlated with participating in Re:Vision International for
more than a year. Results did not find any significant relationship between self-reported health
and marital status.
Table 3: Linear regression model results for health
Health
Coefficient Standard Error p
Overall adjusted
R2
Marriage 0.1700
2 1.26 .68 0.08
3 -.75 .68 0.29
4 -.47 .60 0.45
5 -.60 .38 0.13
Age -.01 .013 0.52
1.income_cat .10 .32 0.76
2.Sex -.18 .41 0.67
1.attachmed .66 .33 0.05
1.part_gt1year -.27 .32 0.40
_cons 3.13 .70 0.00
Marriage codes: 2, divorced; 3, separated; 4, widowed; 5, single
28. 24
Body mass index
For body mass index, we categorized individuals as either obese or non-obese to reflect
the most meaningful difference in the literature on the health impacts of body weight (Jia &
Lubetkin, 2005), and modeled this dichotomous measure using logistic regression. The analysis
reveals that the average respondent who is widowed is significantly much more likely to be
obese, with 40 times higher odds of being obese as compared to the average married person.
While findings indicate that males, those with an income higher than $25,000, those with higher
neighborhood attachment, and respondents that have participated in Re:Vision International for
more than a year all have higher odds of being obese, the differences were not statistically
significant.
Table 4: Logistic regression model results for BMI
BMI
Odds Ratio Standard Error p Pseudo R2
Marriage 0.166
2 3.28 6.00 0.52
3 1.61 2.68 0.78
4 40.10 70.68 0.04
5 1.60 1.62 0.64
Age .93 .04 0.06
1.income_cat 1.10 .96 0.91
2.Sex 2.49 2.79 0.42
1.attachmed 3.60 3.30 0.16
1.part_gt1year 3.76 3.30 0.13
_cons 2.59 5.09 0.63
Marriage codes: 2, divorced; 3, separated; 4, widowed; 5, single
29. 25
Blood Pressure
Similar to obesity, we dichotomized our blood pressure measures to categorize people
with “high” blood pressure. Table five lists the results of a logistic regression model. There is a
statically significant relationship between those who have an income higher than $25,000 and
blood pressure: on average, respondents who reported having an income of greater than $25,000
have 92% lower odds of having high blood pressure. A similar relationship was found, although
not statistically significant, between those who reported higher levels of neighborhood
attachment and had a garden with Re:Vision International for more than a year. For each of these
categories, on average, respondents had lower odds of having high blood pressure. Note that
divorce and marital separation perfectly predicted blood pressure so were omitted from the
model, resulting in a slightly lower sample size for this analysis (N=32).
Table 5: Logistic regression model results for blood pressure
Blood Pressure
Odds Ratio Standard Error p Pseudo R2
Marriage 0.212
2 1 (empty)
3 1 (empty)
4 1.05 1.81 0.98
5 1.22 1.40 0.87
Age 1.00 .04 0.90
1.income_cat .08 .10 0.04
2.Sex 1.50 1.97 0.76
1.attachmed .56 .58 0.58
1.part_gt1year .33 .33 0.26
_cons 1.24 2.67 0.92
Marriage codes: 2, divorced; 3, separated; 4, widowed; 5, single
30. 26
Exercise
Exercise was split by the median into two categories: those who exercised for zero to
three hours a week, and those who exercised for more than 3 hours a week. Logistic regression
results for this outcome (see Table 6) revealed 23 times significantly higher odds for men to
exercise more than three hours a week as compared to women. No other statistically significant
relationships were observed. Once again, marital separation perfectly predicted exercise and so
was omitted from the model (N=33).
Table 6: Logistic regression model results for exercise
Exercise
Odds Ratio Standard Error p Pseudo R2
Marriage 0.1992
2 11.28 20.41 0.18
3 1 (empty)
4 17.22 32.92 0.14
5 .64 .70 0.69
Age .92 .04 0.10
1.income_cat .63 .59 0.62
2.Sex 23.76 36.81 0.04
1.attachmed .72 .66 0.71
1.part_gt1year .69 .63 0.68
_cons 20.47 46.27 0.18s
Marriage codes: 2, divorced; 3, separated; 4, widowed; 5, single
31. 27
Discussion
Our analysis showed no statistically significant relationships between participation in
Re:Vision International and diet, self-reported health, body mass index, blood pressure, and
exercise. Nevertheless, the direction of the results suggests that there may be a correlation
between participation in the program and diet and blood pressure. The relationship between
increased fruit and vegetable consumption and participation in community gardens, home
gardens, and community-supported agriculture is consistent with the literature (Alaimo et al.,
2008; Blair et al., 1991; C. Brown & Miller, 2008; Goland, 2002; Litt et al., 2011). This
relationship can be extended to those participating in community-based interventions to home
gardening because the increased availability, accessibility, and affordability of fruits and
vegetables in this setting is related to more fruits and vegetables in the diet (Morton et al., 2007).
This intervention has provided community members with a home garden that supplies
affordable, nutritious produce that is correlated with better dietary habits. These results may have
been statistically significant given a larger sample size.
Similar logic can be applied to participants who have had a garden with Re:Vision
International for more than a year and blood pressure. The results are not statistically significant,
but the direction of the results can be accredited to certain biological factors. Alonso et al. (2004)
conducted a study consisting of 4,393 participants to assess how blood pressure is related to fruit
and vegetable consumption. The outcome indicates that diets high in fruits and vegetables are
inversely correlated with blood pressure (Alonso et al., 2004). Residents, therefore, may be able
to attribute lower blood pressure to consuming more fruits and vegetables as a participant in
Re:Vision’s gardening program. The degree to which high blood pressure can be ascribed to
stress levels should also be examined. According to the literature, increased levels of acute
psychological stress predict high blood pressure (Carroll, Phillips, Der, Hunt, & Benzeval, 2011;
32. 28
Matthews, Woodall, & Allen, 1993). Recreational gardening has demonstrated its ability to
reduce stress hormones (K. H. Brown & Jameton, 2000), and thereby reduce blood pressure.
According to Malakoff (1995), “simply looking at a plant can reduce stress…and lower blood
pressure” (Malakoff, 1995). These findings are consistent with the results, which indicate a
correlation between participation and lower blood pressure, and may be statistically significant
with a larger sample size.
Body mass index and the number of years in the program were also not statistically
significant. Since BMI is a relatively stable measure throughout one’s lifetime, it is difficult for
some interventions to create short-term, significant differences in the calculation. For example,
in a meta-analysis of 18 studies that examined the effects of physical activity interventions on
BMI, the results indicated that these interventions did not improve BMI among participants
(Harris, Kuramoto, Schulzer, & Retallack, 2009). A second study concluded that a combined
diet-plus-exercise intervention resulted in lower BMI than did a diet-only program (Wu, Gao,
Chen, & Van Dam, 2009). Since the results indicated no statistically significant relationship
between participation and exercise, this intervention could be categorized as a “diet-only”
intervention because of the improved access, availability, and affordability of fresh produce.
Since the majority of participants have had a garden with Re:Vision between one and four years,
this intervention would have encountered many more barriers to lowering BMI among obese
participants in such a short time frame.
Exercise and self-reported health also demonstrated a relationship to participation in the
program that was not statistically significant. Again, this finding may be attributed to the
difficulty in changing health outcomes in a short time. For example, in a survey conducted
among residents who owned a home garden between 6-10 years, there was a significant
33. 29
difference in physical activity among those who gardened and those who did not (Van den Berg,
Van Winsum-Westra, de Vries, & Van Dillen, 2010). This study is comparing physical activity
to a control group rather than the number of years each resident has had a garden, making the
study limited by self-selection (Van den Berg et al., 2010). It is, however, interesting to note the
relationship between having a garden for more than four years and increased physical exercise.
Similarly, self-reported health among residents falls victim to the same issue of obtaining data in
a short time frame. According to the 2015 Re:Vision Year 2 Evaluation Summative Report, there
seemed to be no impact on self-reported health and participation in the program after four years,
reaffirming the results from this study. Re:Vision would benefit from continued studies on
physical exercise and self-reported health in the future.
Although they do not directly relate to the research question, several statistically
significant relationships exist. The positive correlation between self-reported health and
neighborhood attachment should be discussed. There is evidence that evinces the relationship
between collective efficacy and self-reported health among urban gardeners, but neighborhood
attachment did not predict self-reported health (Litt et al., 2015). Although the results in this
thesis are not related to participation in a garden, they make an interesting addition to the field of
study and should be further explored in the context of community-based interventions to home
gardening.
The next significant relationship is that between fruit and vegetable consumption and
marital status. According to Table 2, respondents who are single reported statistically higher fruit
and vegetable intake as compared to those who are married. This finding appears to be in sharp
contrast to the literature (Woo, J. et al., 1999; Billson, Pryer, & Nichols, 1999; Serdula et al.,
1995; Kamphuis et al., 2006). In a study of 1,010 subjects in Hong Kong, it was revealed that
34. 30
single women consumed less vegetables as well as Vitamin D and iron (Woo, J. et al., 1999). In
a similar study, participants who were single reported lower fruit and vegetable intake as
compared to those who were married (Billson et al., 1999; Kamphuis et al., 2006). Perhaps the
contrast in results can be attributed to participating in a community-based intervention to home
gardening. This interesting relationship could benefit from further investigation.
The negative correlation between blood pressure and income is also noteworthy. Those
with an annual income of more than $25,000 had significantly lower blood pressure than did
those with an annual income of less than $25,000. This relationship seems to be consistent with
the literature (Evans & English, 2002; Krieger, 1990; Carroll et al., 2011). Respondents living in
poverty face psychophysiological stressors more than those who are living above the poverty
line, and therefore have higher blood pressure (Carroll et al., 2011; Evans & English, 2002;
Matthews et al., 1993). This finding may encourage residents to seek help in effective stress-
management programs. It also warrants further study on the impact of home gardens on blood
pressure, as this may prove to be a feasible way to lower blood pressure.
Lastly, the relationship between widowed respondents and obesity is significant. The
results indicate that widows have 40 times higher odds of being obese. This finding mirrors a
study conducted by Nazki (2015). In this study, the results implied that widows had a much
higher prevalence of obesity, with loneliness being a strong predictor (Nazki, 2015). The
increased pervasiveness of obesity among widows has been found to be a significant factor in
other studies, as well (Erem et al., 2004; Al-Mannai, Dickerson, Morgan, & Khalfan, 1996). In
the context of home gardening, it would be interesting to measure the impact of participating in
the garden and BMI among widows over a longer time span.
35. 31
Essentially, further research is needed to understand the impact community-based
interventions may have on improving the health of low-income residents. The direction, dose-
response relationship, and biological significance of two outcomes (diet and blood pressure) may
permit a statistically significant relationship given a larger sample size. Since Re:Vision is
situated in a primarily low-income area of Denver, the poverty that these residents suffer is a
predictor of high blood pressure (Carroll et al., 2011; Evans & English, 2002; Krieger, 1990).
Therefore, the potential benefits residents may receive in participating in this intervention is two-
fold: they are provided with accessible, available, and affordable produce in a low-income area
of Denver, as well as a garden that may intrinsically lower the blood pressure among these low-
income residents (K. H. Brown & Jameton, 2000). Given a larger sample size, this finding may
have large scale implications on health status over the long-term. High blood pressure is a
leading factor for increased risk of cardiovascular disease as well as end-stage renal failure
(General & Board, 1988). It is often a result of inappropriate protein intake and/or increased
sodium in the diet, both features that can be remedied by consuming more fruits and vegetables
from an easily accessible source (General & Board, 1988). If policies were designed to
implement community-based interventions to home gardening in low-income neighborhoods, the
rate of coronary heart disease, some types of cancer, renal failure, and gallbladder disease may
be greatly reduced (General & Board, 1988).
Although the sample size severely limited our findings, the negative correlation between
blood pressure and participation in the program should be further explored. Moreover, many of
the results reinforced the literature: fruit and vegetable consumption among gardeners, high
blood pressure in residents living below the poverty line, the difficulty in changing BMI,
physical activity, and self-reported health in the short term, and the increased prevalence of
36. 32
obesity in widows. Though no definite conclusions can be drawn, community-based
interventions may be an effective way to lower the risk of chronic disease and should be further
researched.
37. 33
Limitations
Several issues were encountered in the study design and should be brought under
consideration when interpreting the results. First, it is unknown how much bias can be attributed
to self-selection. Since residents made the choice to participate in Re:Vision International’s
gardening program, this may have influenced the results of our study. Perhaps residents with
lower blood pressure or higher fruit and vegetable consumption were more likely to join and
endure with Re:Vision. Second, our analysis did not control for the food environment in the
neighborhoods where Re:Vision’s gardens are situated. The presence, or lack thereof, of grocery
stores and other food outlets may impact resident’s dietary behaviors (Morland, Wing, & Roux,
2002). Third, the results would benefit from more robust tracking techniques. To match the
“Basic Health Examination” to the “Gardener Survey Summary Year 1” from 2014 and the
“Gardener Survey Summary 2” from 2015 was not a trivial task. The “Basic Health
Examination” measure employed a different unique identifier from the latter two surveys and
therefore left room for error.
Despite these limitations, the analysis was conducted to ensure the privacy of the
respondents. The identifiable, confidential data that was received immediately was stored onto a
personal desktop computer. All Excel workbooks with access to this data were protected with a
unique password. These precautionary steps reduced the risk of a breach in confidentiality.
Furthermore, this study employed well established measures of fruit and vegetable consumption,
self-reported health, neighborhood attachment, and trained health workers to measure
participants’ BMI and blood pressure. These measures, along with the secondary data analysis
and research, create a strong study design that would benefit from a larger sample size.
38. 34
Recommendations
Although past studies have explored the dietary behaviors associated with community-
supported agriculture, community gardens, and home gardens, the research is lacking in the field
of community-based interventions to home gardening. This thesis not only addresses health
behaviors among participants, but it also employs trained health workers to objectively measure
health status. The correlations between participation in community-based interventions to home
gardening, increased fruit and vegetable consumption, and lower blood pressure were not
statistically significant. However, the literature and biological significance of these outcomes
warrant further study with a much larger sample size. Moreover, a study that measures the long-
term effects of BMI, exercise, and self-reported health on participants would enhance the field of
knowledge. Beyond investigating health status, it is critical to study the effects that these
interventions may have on collective efficacy, neighborhood attachment, and self-reported
health. The results indicate a statistically significant relationship between neighborhood
attachment and self-reported health, but it is unclear whether or not these results are impacted by
having a garden with Re:Vision.
Ultimately, it is important for organizations like Re:Vision to feel empowered. The
commitment to creating an accessible, affordable, and available self-sustaining food system for
low-income residents should serve as inspiration for other non-profit and non-governmental
organizations. By employing community members to train residents in how to cultivate home
gardens and offer technical assistance throughout the growing season, communities have the
potential to grow over 45,000 pounds of organic produce. This was the amount of produce
families achieved with help from Re:Vision in 2014 (“Backyard Gardens,” n.d.). Partnerships
with universities, hospitals, and schools may also prove beneficial for organizations like
Re:Vision. By instructing children on how to cultivate at-home gardens, there is potential to curb
39. 35
their health behaviors and reduce the risk of developing chronic disease at an early age (Ozer,
2007). By partnering with universities, these organizations can receive statistical analyses that
indicate the impacts of their program. Re:Vision is providing value to the community and
empowering its residents through its community-based program. Further research is required to
understand community-based approaches to improve health status and health behaviors among
low-income families, but organizations like Re:Vision do show promise.
40. 36
Appendix I
Frequency Table
Question Variable Name Response Frequency (%)
During the past 7
days, how many
times did you eat
fruit?
fruit 0 – I haven’t eaten
fruit in the last 7
days
0 - less than 1 time
per day
1 - 1 time per day
2 - 2 times per day
3 - 3 times per day
4 - 4 or more times
per day
0
1 (2.78)
6 (16.67)
14 (38.89)
10 (27.78)
5 (13.89
During the past 7
days, how many
times did you eat
vegetables?
vegetable 0 – I haven’t eaten
vegetables in the last
7 days
0 - less than 1 time
per day
1 - 1 time per day
2 - 2 times per day
3 - 3 times per day
4 - 4 or more times
per day
1 (2.78)
0
4 (11.11)
11 (30.56)
14 (38.89)
6 (16.67)
Would you say that
in general your
health is…
Health 1 – poor
2 – Fair
3 – Good
4 – Very Good
5 – Excellent
3 (8.11)
11 (29.73)
16 (43.24)
6 (16.22)
1 (2.70)
This is the ideal
neighborhood for me.
Ideal 1 – Strongly disagree
2 – Disagree
3 – Neutral
4 – Agree
5 – Strongly Agree
2 (5.41)
4 (10.81)
7 (18.92)
18 (48.65)
6 (16.22)
I would like to live in
another
neighborhood.
Another_neighborhood 1 – Strongly Agree
2 – Agree
3 – Neutral
4 – Disagree
5 – Strongly disagree
4 (10.81)
10 (27.03)
9 (24.32)
8 (21.62)
6 (16.22)
It would be very hard
for me to leave this
neighborhood.
Hard_leave 1 – Strongly disagree
2 – Disagree
3 – Neutral
4 – Agree
5 – Strongly Agree
7 (18.92)
8 (21.62)
7 (18.92)
12 (32.43)
3 (8.11)
41. 37
I have nothing in
common with this
neighborhood.
Nothing_common 1 – Strongly Agree
2 – Agree
3 – Neutral
4 – Disagree
5 – Strongly disagree
3 (8.11)
3 (8.11)
8 (21.62)
14 (37.84)
9 (24.32)
I feel safe in this
neighborhood.
Safe 1 – Strongly disagree
2 – Disagree
3 – Neutral
4 – Agree
5 – Strongly Agree
3 (8.11)
5 (13.51)
7 (18.92)
17 (45.95)
5 (13.51)
I like my neighbors. Like_neighbors 1 – Strongly disagree
2 – Disagree
3 – Neutral
4 – Agree
5 – Strongly Agree
3 (8.11)
3 (8.11)
6 (16.22)
17 (45.95)
8 (21.62)
Attachment into
categories
attach_high 0 – Attachment scale
is less than 3.5
1 – Attachment scale
is more than 3.5
0 – 17 (45.95)
1 – 20 (54.05)
How long have you
had a garden with
Re:Vision
International?
Participation 1 – Less than a year
2 – Between 1 & 2
years
3 – Between 2 & 3
years
4 – 3 or more years
5 – More than 4
years
18 (50)
6 (16.67)
6 (16.67)
5 (13.89)
1 (2.78)
Participation by
category
Part_gt1year 0 – Less than a year
1 – More than a year
19 (51.35)
18 (48.65)
Which is your sex? Sex 1 – Female
2 – Male
29 (78.38)
8 (21.62)
Are you Hispanic or
Latino?
Hispanic 1 – Yes
2 – No
33 (89.19)
4 (10.81)
Are you…? Married 1 - Married
2 – Divorced
3 – Separated
4 – Widowed
5 - Single
6 - A member of an
unmarried couple
20 (55.56)
2 (5.56)
2 (5.56)
5 (13.89)
5 (13.89)
2 (5.56)
What is your annual
household income
from all sources?
Income 1 - Less than 10,000
2 - Between $10,000
and 15,000
3 - Between 15,000
and 20,000
10 (27.78)
4 (11.11)
5 (13.89)
42. 38
4 - Between 20,000-
25,000
5 - Between 25,000
and 35,000
6 - Between 35,000
and 50,000
7 - Between 50,000
and 75,000
8 - more than 75,000
2 (5.56)
8 (22.22)
4 (11.11)
2 (5.56)
1 (2.78)
Income by category income_cat 0 – Less than
$25,000
1 – More than
$25,000
21 (56.76)
16 (43.24)
How many hours in
the week are you
exercising?
Exercise 1 – 0-3
2 – 3-5
3 – 5-7
4 – 7+
20 (55.56)
9 (25)
5 (13.89)
2 (5.56)
Exercise grater than
3 hours a week
ex_gt3 0 – 0-3
1 – 4-7+
20 (55.56)
16 (44.44)
Blood Pressure
Systolic
BP_systolic 0 – Low blood
pressure
1 – Ideal blood
pressure
2 – Prehypertension
3 – High blood
pressure
0
13 (35.14)
14 (37.84)
10 (27.03)
Blood Pressure
Diastolic
BP_diastolic 0 – Low blood
pressure
1 – Ideal blood
pressure
2 – Prehypertension
3 – High blood
pressure
2 (5.41)
23 (62.16)
10 (27.03)
2 (5.41)
Blood Pressure total BP 0 – Low blood
pressure
1 – Ideal blood
pressure
2 – Prehypertension
3 – High blood
pressure
0
13 (35.14)
13 (35.14)
11 (29.73)
44. 40
Bibliography
Adam, K. (2006). Community Supported Agriculture. National Center for Appropriate
Technology.
Alaimo, K., Packnett, E., Miles, R. A., & Kruger, D. J. (2008). Fruit and Vegetable Intake among
Urban Community Gardeners. Journal of Nutrition Education and Behavior, 40(2), 94–
101.
Al-Mannai, A., Dickerson, J. W. T., Morgan, J. B., & Khalfan, H. (1996). Obesity in Bahraini
Adults. The Journal of the Royal Society for the Promotion of Health, 116(1), 30–40.
Alonso, A., de la Fuente, C., Martín-Arnau, A. M., de Irala, J., Alfredo Martínez, J., & Martínez-
González, M. Á. (2004). Fruit and vegetable consumption is inversely associated with
blood pressure in a Mediterranean population with a high vegetable-fat intake: the
Seguimiento Universidad de Navarra (SUN) Study. British Journal of Nutrition, 92(02),
311–319.
Backyard Gardens. (n.d.). Retrieved March 13, 2016, from http://www.revision.coop/backyard-
gardens/
Baker, A. H., & Izard, H. V. (1991). New England Farmers and the Marketplace, 1780-1865: A
Case Study. Agricultural History, 65(3), 29–52.
Becker, R. F. (1984). Vegetable gardening in the United States: a history, 1565-1900.
HortScience (USA).
Billson, H., Pryer, J. A., & Nichols, R. (1999). Variation in fruit and vegetable consumption
among adults in Britain. An analysis from the dietary and nutritional survey of British
adults. European Journal of Clinical Nutrition, 53(12), 946–952.
Blair, D., Giesecke, C. C., & Sherman, S. (1991). A dietary, social and economic evaluation of
the Philadelphia urban gardening project. Journal of Nutrition Education, 23(4), 161–
167.
Bonaiuto, M., Aiello, A., Perugini, M., Bonnes, M., & Ercolani, A. P. (1999). Multidimensional
Perception of Residential Environment Quality and Neighbourhood Attachment in The
Urban Environment. Journal of Environmental Psychology, 19(4), 331–352.
Brown, C., & Miller, S. (2008). The Impacts of Local Markets: A Review of Research on
Farmers Markets and Community Supported Agriculture (CSA). American Journal of
Agricultural Economics, 90(5), 1298–1302.
Brown, K. H., & Jameton, A. L. (2000). Public Health Implications of Urban Agriculture.
Journal of Public Health Policy, 21(1), 20–39.
45. 41
Brown, P., Zavestoski, S., McCormick, S., Mayer, B., Morello-Frosch, R., & Gasior Altman, R.
(2004). Embodied health movements: new approaches to social movements in health.
Sociology of Health & Illness, 26(1), 50–80.
Carleton, R. A., Lasater, T. M., Assaf, A. R., Feldman, H. A., & McKinlay, S. (1995). The
Pawtucket Heart Health Program: community changes in cardiovascular risk factors and
projected disease risk. American Journal of Public Health, 85(6), 777–785.
Carroll, D., Phillips, A. C., Der, G., Hunt, K., & Benzeval, M. (2011). Blood Pressure Reactions
to Acute Mental Stress and Future Blood Pressure Status: Data From the 12-Year Follow-
Up of the West of Scotland Study. Psychosomatic Medicine, 73(9), 737–742.
Drake, L., & Lawson, L. J. (2015). Results of a US and Canada community garden survey:
shared challenges in garden management amid diverse geographical and organizational
contexts. Agriculture and Human Values, 32(2), 241–254.
Erem, C., Arslan, C., Hacihasanoglu, A., Deger, O., Topbaş, M., Ukinc, K., … Telatar, M.
(2004). Prevalence of Obesity and Associated Risk Factors in a Turkish Population
(Trabzon City, Turkey). Obesity Research, 12(7), 1117–1127.
Evans, G. W., & English, K. (2002). The Environment of Poverty: Multiple Stressor Exposure,
Psychophysiological Stress, and Socioemotional Adjustment. Child Development, 73(4),
1238–1248.
Fields, S. (2004). The Fat of the Land: Do Agricultural Subsidies Foster Poor Health?
Environmental Health Perspectives, 112(14), A820.
Garrouste-Orgeas, M., Troché, G., Azoulay, E., Caubel, A., Lassence, A. de, Cheval, C., …
Timsit, J.-F. (2004). Body mass index. Intensive Care Medicine, 30(3), 437–443.
General, U. S. P. H. S. O. of the S., & Board, U. S. D. of H. and H. S. N. P. (1988). The Surgeon
General’s Report on Nutrition and Health [Official reports]. Retrieved November 3,
2015.
Glover, T. D., Parry, D. C., & Shinew, K. J. (2005). Building Relationships, Accessing
Resources: Mobilizing Social Capital in Community Garden Contexts. Journal of Leisure
Research, 37(4), 450–474.
Goland, C. (2002). Community Supported Agriculture, Food Consumption Patterns, and
Member Commitment. Culture & Agriculture, 24(1), 14–25.
Goodman, R. M., Wheeler, F. C., & Lee, P. R. (1995). Evaluation of the Heart To Heart Project:
lessons from a community-based chronic disease prevention project. American Journal of
Health Promotion: AJHP, 9(6), 443–455.
46. 42
Guenther, P. M., Dodd, K. W., Reedy, J., & Krebs-Smith, S. M. (2006). Most Americans Eat
Much Less than Recommended Amounts of Fruits and Vegetables. Journal of the
American Dietetic Association, 106(9), 1371–1379.
Haby, M. M., Vos, T., Carter, R., Moodie, M., Markwick, A., Magnus, A., … Swinburn, B.
(2006). A new approach to assessing the health benefit from obesity interventions in
children and adolescents: the assessing cost-effectiveness in obesity project. International
Journal of Obesity, 30(10), 1463–1475.
Harris, K. C., Kuramoto, L. K., Schulzer, M., & Retallack, J. E. (2009). Effect of school-based
physical activity interventions on body mass index in children: a meta-analysis. Canadian
Medical Association Journal, 180(7), 719–726.
Horrigan, L., Lawrence, R. S., & Walker, P. (2002). How sustainable agriculture can address the
environmental and human health harms of industrial agriculture. Environmental Health
Perspectives, 110(5), 445–456.
Hudd, S. S., Dumlao, J., Erdmann-Sager, D., Murray, D., Phan, E., Soukas, N., & Yokozuka, N.
(2000). Stress at College: Effects on Health Habits, Health Status and Self-Esteem.
College Student Journal, 34(2), 217.
Jia, H., & Lubetkin, E. I. (2005). The impact of obesity on health-related quality-of-life in the
general adult US population. Journal of Public Health, 27(2), 156–164.
Kaak, P. (2012). Urban Agriculture. In R. K. Craig, J. C. Nagle, B. Pardy, O. J. Schmitz, & W.
K. Smith (Eds.), Berkshire Encyclopedia of Sustainability (Vol. 5, pp. 390–394). Great
Barrington, MA: Berkshire.
Kamphuis, C. B. M., Giskes, K., de Bruijn, G.-J., Wendel-Vos, W., Brug, J., & van Lenthe, F. J.
(2006). Environmental determinants of fruit and vegetable consumption among adults: a
systematic review. The British Journal of Nutrition, 96(4), 620–35.
Krieger, N. (1990). Racial and gender discrimination: Risk factors for high blood pressure?
Social Science & Medicine, 30(12), 1273–1281.
Litt, J. S., Schmiege, S. J., Hale, J. W., Buchenau, M., & Sancar, F. (2015). Exploring ecological,
emotional and social levers of self-rated health for urban gardeners and non-gardeners: A
path analysis. Social Science & Medicine, 144, 1–8.
Litt, J. S., Soobader, M.-J., Turbin, M. S., Hale, J. W., Buchenau, M., & Marshall, J. A. (2011).
The Influence of Social Involvement, Neighborhood Aesthetics, and Community Garden
Participation on Fruit and Vegetable Consumption. American Journal of Public Health,
101(8), 1466–1473.
Lyson, T. A. (2004). Civic Agriculture: Reconnecting Farm, Food, and Community. UPNE.
47. 43
Matthews, K. A., Woodall, K. L., & Allen, M. T. (1993). Cardiovascular reactivity to stress
predicts future blood pressure status. Hypertension, 22(4), 479–485.
Malakoff, D. (1995). What good is community greening. Community greening review, 5, 4-11.
McFadden, S. (2015, January 1). The History of Community Supported Agriculture Part I.
Rodale University.
McKibben, B. H. | A., & 2005. (n.d.). The Cuba Diet: What will you be eating when the
revolution comes? Retrieved March 28, 2016.
Morland, K., Wing, S., & Roux, A. D. (2002). The Contextual Effect of the Local Food
Environment on Residents’ Diets: The Atherosclerosis Risk in Communities Study.
American Journal of Public Health, 92(11), 1761–1768.
Morton, L. W., Bitto, E. A., Oakland, M. J., & Sand, M. (2007). Accessing food resources: Rural
and urban patterns of giving and getting food. Agriculture and Human Values, 25(1),
107–119.
Nazki, S. G., Dolma, Y., & Kousar, J. Prevalence of Obesity Among Females Above 18 Years of
Block Hazratbal, Srinagar: A Cross Sectional Study.
Ozer, E. J. (2007). The Effects of School Gardens on Students and Schools: Conceptualization
and Considerations for Maximizing Healthy Development. Health Education &
Behavior, 34(6), 846–863.
Ploeg, M. V. (2010). Access to Affordable and Nutritious Food: Measuring and Understanding
Food Deserts and Their Consequences: Report to Congress. DIANE Publishing.
Position of the American Dietetic Association: Individual-, Family-, School-, and Community-
Based Interventions for Pediatric Overweight. (2006). Journal of the American Dietetic
Association, 106(6), 925–945.
Ruehrdanz, A. (2013). The Anatomy of Community Supported Agriculture along Colorado’s
Front Range: Understanding its role in Food Systems Planning. Unpublished work;
Completed and supported by the Denver Master of Public Health. Degree of Colorado
School of Public Health.
Sampson, R. J., Raudenbush, S. W., & Earls, F. (1997). Neighborhoods and Violent Crime: A
Multilevel Study of Collective Efficacy. Science, 277(5328), 918–924.
Schupp, J. L., & Sharp, J. S. (2011). Exploring the social bases of home gardening. Agriculture
and Human Values, 29(1), 93–105.
Serdula, M. K., Coates, R. J., Byers, T., Simoes, E., Mokdad, A. H., & Subar, A. F. (1995). Fruit
and vegetable intake among adults in 16 states: results of a brief telephone survey.
48. 44
American Journal of Public Health, 85(2), 236–239.
Sharp, J., Imerman, E., & Peters, G. (2002). Community Supported Agriculture (CSA): Building
Community Among Farmers and Non-Farmers. Journal of Extension, 40(3).
Tavakol, M., & Dennick, R. (2011). Making sense of Cronbach’s alpha. International Journal of
Medical Education, 2, 53–55.
Teig, E., Amulya, J., Bardwell, L., Buchenau, M., Marshall, J. A., & Litt, J. S. (2009). Collective
efficacy in Denver, Colorado: Strengthening neighborhoods and health through
community gardens. Health & Place, 15(4), 1115–1122.
Understanding Blood Pressure Readings. (n.d.). Retrieved February 14, 2016.
Van den Berg, A. E., van Winsum-Westra, M., de Vries, S., & van Dillen, S. M. E. (2010).
Allotment gardening and health: a comparative survey among allotment gardeners and
their neighbors without an allotment. Environmental Health: A Global Access Science
Source, 9, 74–85.
Van En, R. (n.d.). Eating for Your Community. Retrieved October 12, 2015.
Wakefield, S., Yeudall, F., Taron, C., Reynolds, J., & Skinner, A. (2007). Growing urban health:
Community gardening in South-East Toronto. Health Promotion International, 22(2),
92–101.
Ware, J. E., Brook, R. H., Davies, A. R., & Lohr, K. N. (1981). Choosing measures of health
status for individuals in general populations. American Journal of Public Health, 71(6),
620–625.
Weden, M. M., Carpiano, R. M., & Robert, S. A. (2008). Subjective and objective neighborhood
characteristics and adult health. Social Science & Medicine, 66(6), 1256–1270.
WHO | World Health Organization. (n.d.). Retrieved February 8, 2016.
Woo, J. (1999) Influence of educational level and marital status on dietary intake, obesity and
other cardiovascular risk factors in a Hong Kong Chinese population. (1999). , Published
Online: 26 May 1999; | doi:10.1038/sj.ejcn.1600777, 53(6).
Wu, T., Gao, X., Chen, M., & Van Dam, R. M. (2009). Long-term effectiveness of diet-plus-
exercise interventions vs. diet-only interventions for weight loss: a meta-analysis. Obesity
Reviews, 10(3), 313–323.