The Economic Benefits of Worksite Wellness Programs
1. THE ECONOMIC BENEFITS OF WORKSITE WELLNESS PROGRAMS
by
KRISTA LYNCH
B.B.A., University of Wisconsin, Oshkosh, 2012
A REPORT
submitted in partial fulfillment of the requirements for the degree
MASTER OF ARTS
Department of Economics
College of Arts and Sciences
KANSAS STATE UNIVERSITY
Manhattan, Kansas
2014
Approved by:
Major Professor
Dong Li
2. Abstract
Comprehensive worksite wellness programs were first introduced in the United States in
the late 1970s and early 1980s, with the goals of improving health, reducing health care
expenditures, and demonstrating senior management’s commitment to the health and well-being
of workers (Ozminkowski et al, 2002). As the annual cost of employer-sponsored family health
coverage increased four percent between 2012 and 2013 (Kaiser Family Foundation, 2013),
many companies are turning to worksite wellness programs. Wellness programs have shown not
only to reduce health care costs, but also decrease absenteeism and increase employee
satisfaction. The studies on the benefits of wellness programs are not conclusive; there seems to
be a general lack of good data collection and analysis. This report discusses what determines an
employer’s likelihood of offering a wellness program, what determines an employee’s
participation in a wellness program, and a benefits analysis of wellness programs.
3. iii
Table of Contents
List of Figures................................................................................................................................ iv
List of Tables .................................................................................................................................. v
Chapter 1 - Introduction.................................................................................................................. 1
Chapter 2 - Employers’ Interest in Offering a Wellness Program.................................................. 4
Determinants of Offering a Wellness Program at Small versus Large Companies.................... 4
The Cost of Obesity.................................................................................................................... 9
Chapter 3 - Employees’ Interest in Participating in a Wellness Program..................................... 17
Participation at Small versus Large Companies Determined by Perspectives ......................... 17
Participation Determined by Employee Characteristics ........................................................... 19
How Incentives Affect the Success of Wellness Programs ...................................................... 24
Elasticity of Demand for Wellness Programs........................................................................... 33
Chapter 4 - Benefits Analysis of Wellness Programs................................................................... 35
Studies of Specific Wellness Programs .................................................................................... 35
Johnson & Johnson’s Live for Life Program........................................................................ 35
Contract for Health and Wellness......................................................................................... 39
Health Quotient..................................................................................................................... 41
Wellness Challenge Program................................................................................................ 43
Points for Fitness Activities.................................................................................................. 44
Analysis of a Failed Program................................................................................................ 45
Meta-analyses ........................................................................................................................... 47
The Effects of Wellness Programs on Absenteeism and Job Satisfaction............................ 47
The Effects of Physical Activity Programs on Absenteeism, Job Satisfaction, Stress and
Employee Turnover .............................................................................................................. 49
Chapter 5 - Conclusion ................................................................................................................. 56
References..................................................................................................................................... 57
Appendix A - Copyright Clearance for Figure 2.1 ....................................................................... 59
4. iv
List of Figures
Figure 2.1 Medical Expenditures, Presenteeism, and Absenteeism Costs by BMI Category ...... 12
5. v
List of Tables
Table 1.1 Among Firms Offering Health Benefits, Percentage Offering a Particular Wellness
Program to Their Employees, 2013 ........................................................................................ 2
Table 2.1 Means of Importance and Perceived Effectiveness of Wellness Outcomes................... 6
Table 2.2 Regression Results of Factors that Influence Small Business’ Interest in Offering a
Wellness Program ................................................................................................................... 7
Table 2.3 Stepwise Regression Results of Small Business’ Interest in Offering a Wellness
Program................................................................................................................................... 8
Table 2.4 Incremental Medical Expenditures and Productivity Losses Due to Excess Weight... 13
Table 3.1 Summary of How Previous Exercise Habits Affect Likelihood to Sign Up for a Fitness
Program and the Likelihood of Being a Regular Exerciser Conditional on Sign Up ........... 24
Table 3.2 Incentive Schedule for Percent of Baseline Weight Lost ............................................. 27
Table 3.3 Summary Results of “A Case Study of a Workplace Wellness Program that Offers
Financial Incentives for Weight Loss” ................................................................................. 31
Table 4.1 Percent Change in Participants at Risk after Live for Life Program ............................ 37
Table 4.2 Savings per Employee per Year After Start of the Health & Wellness Program ......... 39
Table 4.3 Summary Results of Studies Discussed in this Report................................................. 52
6. 1
Chapter 1 - Introduction
The annual cost of employer-sponsored family health coverage increased four percent
between 2012 and 2013 (Kaiser Family Foundation, 2013). This is faster than the rate of
inflation, as consumer price index increased just 1.6 percent over this time period (BLS, 2013).
Health care costs are rising due to an aging work force and increased stress in the work place
(Goetzel et al, 2002). In an effort to control increasing health care costs and for other potential
benefits, many companies are turning to worksite wellness programs: 36 percent of large firms
(over 200 workers) and eight percent of small firms (under 200 workers) offer worksite wellness
programs in the United States in 2013 (Kaiser Family Foundation, 2013). Goetzel (2008) simply
defines a worksite wellness program as employer initiatives directed at improving the health and
well-being of workers. A comprehensive wellness program offers health screenings, health and
wellness education programs, and fitness programs (Atkinson, 2000). Specifically, wellness
programs can include cancer and disease screening, immunizations, tobacco cessation support,
low-fat cafeteria menus, health education classes, exercise programs, chronic disease
management, (Wallace and Fisher, 2009), stress and depression management, and preventive
care (Stave et al , 2003). Table 1.1 shows the most common components of wellness programs
in the United States in 2013.
7. 2
Table 1.1 Among Firms Offering Health Benefits, Percentage Offering a Particular
Wellness Program to Their Employees, 2013
Benefit Small Firms Large Firms
Gym Membership Discounts or On-Site Exercise Facilities 21% 69%
Smoking Cessation Program 39% 71%
Web-based Resources for Healthy Living 47% 78%
Wellness Newsletter 47% 60%
Lifestyle Behavior Coaching 33% 57%
Biometric Screening 26% 55%
Weight Loss Program 31% 58%
Employee Assistance Program 22% 79%
Flu Shots 53% 87%
Nutrition Class 20% 50%
Offer at least one of the above specified offerings 76% 99%
Kaiser Family Foundation, 2013.
Comprehensive worksite wellness programs were first introduced in the United States in
the late 1970s and early 1980s, with the goals of improving health, reducing health care
expenditures, and demonstrating senior management’s commitment to the health and well-being
of workers (Ozminkowski et al, 2002). Goals of an ongoing wellness program should include
promoting a culture of health and productivity, encouraging employees to adopt and maintain
positive health behaviors, and provide economic benefits to the company through reduced
healthcare expenditures and increased productivity (Stave et al, 2003). Wellness programs have
shown not only to reduce health care costs, but also decrease absenteeism and increase employee
satisfaction. The studies on the benefits of wellness programs are not conclusive. There seems
to be a general lack of good data collection and analysis. This report discusses what determines
8. 3
an employer’s likelihood of offering a wellness program, what determines an employee’s
participation in a wellness program, and a benefits analysis of wellness programs.
9. 4
Chapter 2 - Employers’ Interest in Offering a Wellness Program
Determinants of Offering a Wellness Program at Small versus Large
Companies
Employers’ interest in offering a wellness program stems from its potential to increase
productivity, decrease absenteeism, improve health status, improve employee retention, and
decrease the rapidly increasing cost of health insurance premiums (Wallace and Fisher, 2009).
Health promotion and wellness programs have their place in the workplace as workers eat many
meals at work and spend much of their time at work, which makes it a great place for social
interaction, information exchange, and education programs (Wallace and Fisher, 2009).
Although various studies have shown that wellness programs have a positive cost-benefit ratio
for employers (Andrus and Paul, 1995) the investment is often high while the returns do not
appear immediately. With U.S. workers changing jobs at an increasing rate, employers may
worry that they may not see the long-term effects of implementing a wellness program. The
effectiveness of a wellness program may also be lower with an increasing number of workers
who telecommute (Wallace and Fisher, 2009). Businesses may be overwhelmed by the number
of options and ways to implement a wellness program. Many of the most successful wellness
programs models were first implemented by large companies (Andrus and Paul, 1995), and
health promotion and disease prevention professionals often seek venues with large populations
to efficiently reach many people in one place (Wallace and Fisher, 2009). Thirty-six percent of
large firms (200 or more employees) offer some kind of wellness program, while only eight
percent of smaller firms do so (Kaiser Family Foundation, 2013). This is consistent with that
fact that 98 percent of large firms offer health insurance to their employees, while only 61
10. 5
percent of small firms do (Kaiser Family Foundation, 2012). Small firms may not feel they can
afford health insurance or a wellness program. Table 1.1 shows that large companies are more
likely than small companies to offer any of specific wellness benefits listed. Larger firms are
more likely to promote their wellness programs by strategies such as team competitions and
social media. Johnson & Johnson, for example, has been offering and benefiting from a
comprehensive wellness program since 1979 (Goetzel et al, 2002). Small businesses, however,
lack the economies of scale that large corporations like Johnson & Johnson have in
implementing a wellness program. Small businesses often lack the resources and expertise to
fully support a comprehensive wellness program (Wallace and Fisher, 2009). While small
businesses cannot invest millions of dollars into forming, offering, and evaluating a wellness
program like Johnson & Johnson, these smaller companies can still learn from the large
corporation models and take what they feel will work best for their company.
Chapter 4 discusses the benefits seen in various wellness programs, but here I look into
what leads employers to decide to offer a wellness program. Before a company implements a
wellness program to gain benefits, it must perceive potential benefits. To find what determines a
small business’s interest in offering a wellness program to its employees, Divine (2005) collected
187 surveys from small businesses in which they rank eight wellness outcomes on importance of
the outcomes (ranked from 1 for very important to 6 for not important) and perceived
effectiveness of wellness programs at achieving those outcomes (ranked from 1 for very
effective to 6 for not effective). The means from the survey can be seen in Table 2.1. Divine
finds that letting employees know the company cares about them, improving productivity, and
improving morale are most the most important to small businesses. Meanwhile, reducing
turnover and reducing workman’s compensation claims are the least important. As far as
11. 6
perceived effectiveness goes, the means analysis shows that letting employees know the
company cares about them and improving employees’ quality of life are perceived as the most
likely outcomes of the program. On the other hand, small businesses do not see reducing
employee turnover, reducing health insurance premiums, and reducing workman’s compensation
claims to be likely outcomes of offering a wellness program. We can also see that employers are
more confident in the importance of these outcomes than they are in the effectiveness of wellness
programs at achieving these outcomes.
Table 2.1 Means of Importance and Perceived Effectiveness of Wellness Outcomes
Outcomes
Importance of the
Outcomes
Perceived
Effectives
Let your employees know that the
company cares about them
1.48 2.46
Improve the productivity of workers 1.53 2.51
Improve employee morale 1.57 2.77
Improve employees’ quality of life 1.64 2.92
Reduce health insurance premiums 1.71 2.96
Reduce absenteeism/sick leave 1.86 3.29
Reduce employee turnover 1.93 3.30
Reduce workman’s compensation claims 2.06 3.43
Divine (2005).
Divine also uses regression analysis to find which outcomes are most responsible for a
business’s likelihood of offering a wellness program. To do this, the 16 outcomes are broken
into three factors. Factor 1 includes all eight outcomes ranked by perceived effectiveness.
12. 7
Factor 2 includes the following five outcomes ranked by importance: improve productivity of
workers, reduce employee turnover, reduce absenteeism, reduce health insurance premiums, and
reduce workman’s compensation. Divine interprets Factor 2 as representing the importance of
financial needs. Factor 3 includes the following three outcomes ranked by importance: improve
employee morale, improve employees’ quality of life, and let employees know the company
cares about them. Divine interprets Factor 3 as representing the importance of employee relation
needs. Running multiple regression on the three factors shows that Factor 1 and Factor 3 are
significant while Factor 2 is not (regression results seen in Table 2.2). This means a small
business is more likely to be interested in a wellness program if they perceive it to be effective
overall and if employee relations are of high importance. Importance of financial needs does not
significantly affect a small business’s interest in offering a wellness program.
Table 2.2 Regression Results of Factors that Influence Small Business’ Interest in Offering
a Wellness Program
Interest in Offering
a Wellness Program
Factor 1: Effectiveness
.596
(10.725)
Factor 2: Financial Outcomes
.005
(.085)
Factor 3: Employee Relations Outcomes
.353
(6.351)
Divine (2005). The numbers in parentheses are t-values.
Next Divine runs a step-wise regression all 16 individual outcomes. Only four of the
outcomes are statistically significant (see Table 2.3). Three of the predictors are outcomes
ranked by effectiveness: improving employees’ quality of life, letting employees know the
13. 8
company cares about their wellbeing, and reducing turnover. The fourth predictor is ranked by
importance: improving an employee’s quality of life.
Table 2.3 Stepwise Regression Results of Small Business’ Interest in Offering a Wellness
Program
Interest in Offering
a Wellness Program
Importance of improving employees’ quality of life
.246
(2.418)
Effectiveness of letting your employees know that
the company cares about them
.276
(3.286)
Effectiveness of reducing employee turnover
.247
(3.910)
Effectiveness of improving employees’ quality of life
.235
(2.816)
Divine (2005). The numbers in parentheses are t-values.
Divine’s overall conclusion is that “humanitarian/employee relations outcomes may have
more influence on small business than financial outcomes.” This conclusion is consistent with
that of Zula et al (2013) who sent out a similar survey asking rural organizations which outcomes
influence them in deciding whether to implement a wellness program. They find that the
majority of rural organizations are interested in improving employee health, improving employee
productivity, and improving employee morale. About three-fourths of these small companies
offer smoking cessation support, flu shots, and blood pressure screening. Over half of the
employers offer nutrition education, physical activity and fitness counseling, stress management
education, a wellness newsletter, and a health fair. These figures are larger than those reported
by the Kaiser Family Foundation in 2013. This is likely because the Kaiser Family Foundation
is a large national survey, while the study by Zula et al (2013) is on a smaller scale (only 35 rural
14. 9
businesses responded to the survey), and the businesses who choose to respond likely have more
wellness offerings. Less common benefits include subsidized gym memberships, and healthier
on site food offerings. Weight management is actually only offered by eight percent of the
employers surveyed. They also find that small companies do not evaluate the effectiveness and
returns to their wellness programs to the extent large companies do. One-third of small
businesses do not use any method to evaluate their wellness program. Sixty-three percent
claimed they realized no cost savings (Zula et al, 2013). Small businesses are also more likely
look at factors like employee satisfaction with the program than actual return on investment.
This is consistent with what Parks and Steelman (2008) discover in their meta-analysis. Through
literature review, Parks and Steelman (2008) find that employers often offer wellness programs
in an effort to reduce absenteeism and increase job satisfaction. Studies that involve complex
analysis of well-developed comprehensive wellness programs are often from large corporations.
If businesses find the potential outcomes of a wellness program important and likely to occur,
they may decide to offer one. Then the employer must attract its employees to join the wellness
program.
The Cost of Obesity
Obesity can double medical expenditures (Cawley and Meyerhoefer, 2012). Therefore
preventing obesity or reversing obesity among employees can save firms in health care
expenditures. Many of the studies reviewed in this report are based wellness programs that
include incentives for weight loss, reimbursement for gym memberships, and education on the
importance of maintaining a healthy weight. The 2010 Patient Protection and Affordable care
Act allows employers to give their employees rebates of up to 30 percent of employee-only
insurance premiums if they participate in wellness programs that include weight loss (Cawley
15. 10
and Meyerhoefer, 2012). This gives employees an incentive to exercise, thereby reducing
obesity and saving the company money. As of 2013, only three percent of companies offer
wellness programs offer lower premiums (Kaiser Family Foundation, 2013), but this can be
expected to increase with utilization of the new law and further proof that wellness programs can
reduce health care costs.
Before discussing how much a wellness program can save a company, I discuss the
mounting evidence of how much obesity of employees can cost a company. Obesity not only
increases actual medical expenditures, but also absenteeism and presenteeism, meaning workers
are present but less productive (Finkelstein, et al, 2010). “Individuals with a BMI greater than
35 represent 37 percent of the obese population, yet they are responsible for 61 percent of the
costs resulting from excess weight” (Finkelstein, et al, 2010). This illustrates the importance of
participation in wellness programs of the unhealthiest employees. If wellness programs can
reduce and prevent obesity rates, they can save a company costs in both medical claims and
absenteeism and presenteeism.
Finkelstein et al (2010) uses the 2006 Medical Expenditure Panel Survey to find the
effects of obesity of medical expenditures. In order to relate the workplace results, only full-time
working adults are considered in the sample. Many of these people have no medical
expenditures during the year. A logistic regression first shows the probability of having any
medical expenditures based on BMI category and other demographic variables. The BMI
categories are as follows: normal weight (18.5-24.9), overweight (25 – 29.9), grade I obese (30.0
– 34.9), grade II obese (35.0 – 39.9), or grade III obese (40 and up). Underweight employees
(BMI less than 18.5) are excluded from the study. Next a regression is run to estimate health
care expenditures given that the worker had any expenditures; the regressors again are BMI
16. 11
categories and other demographic variables. These results show the cost of obesity by
subtracting the estimated cost for someone who is overweight or obese from the estimated cost
of someone who is normal weight. Finkelstein et al (2010) also analyzes how obesity affects
absenteeism and presenteeism based on the Work Productivity and Activity Impairment
questionnaire in the 2008 U.S. National Health and Wellness Survey. Absenteeism is measured
by asking workers how many hours they missed work in the past seven days due to health
problems. Presenteeism is measured by asking workers to rate on scale from zero to ten how
much their health problems affect their productivity. An increase in one point on the scale is
assumed to represent a ten percent decrease in productivity with someone at a zero being fully
productive and someone at a ten completely unproductive. Two different regressions are run:
one with the dependent variable being the number of hours in the past week the worker has
missed due to health problems and the other with the dependent variable being the productivity
loss score. Both of these regressions have the same obesity categories and demographics for
independent variables. The results of these regressions are then annualized and monetized based
on age and gender-specific wage data from the Bureau of Labor Statistics. With these new
predictions, we can again compare the difference in the predictions for number of days lost due
to absenteeism and presenteeism for someone overweight or obese to someone at a normal
weight.
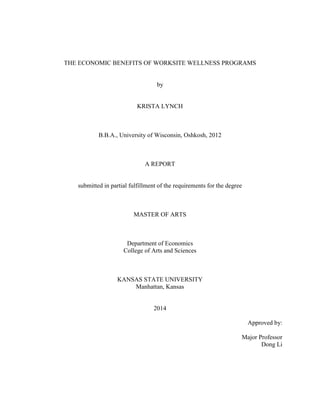
Figure 2.1 appears in Finkelstein et al (2010) and has been reproduced with permission to
show the breakdown of the cost of different levels of obesity. Presenteeism is quite obviously
noted as the most costly effect of obesity, making up over half the cost in all weight categories.
Medical care costs and absenteeism are more visible and easily monitored than presenteeism, yet
presenteeism costs companies thousands of dollars a year per overweight worker. “In aggregate,
17. 12
the cost of obesity among U.S. full-time employees is estimated to be $73.1 billion. This figure
is roughly equivalent to the cost of hiring an additional 1.8 million workers per year at $42,000,”
(Finkelstein et al, 2010). Notice also the costs increase with increasing levels of obesity.
Figure 2.1 Medical Expenditures, Presenteeism, and Absenteeism Costs by BMI Category
Reproduced with permission from Finkelstein et al (2010).
The findings in Figure 2.1 are not consistent with how rural employers view cost savings
for wellness programs. Only 21 percent report they find cost savings in lower health insurance
premiums (Zula et al, 2013). This may be because they do not have many obese employees, or
that the wellness programs do not lead to weight loss and therefore cost savings; the study does
not report weight or weight loss. Only 16 percent of the rural organizations find cost savings in
reduced absenteeism (Zula, et al 2013). Again this could be because the wellness programs are
not effective in reducing obesity. None of them realize cost savings in increased productivity,
18. 13
but, again, productivity is often not directly observed. The difference in findings may also be
due to the very small sample size (35 rural organizations who responded to the survey) used by
Zula et al (2013).
Table 2.4 shows the incremental effects of each BMI category on costs as compared to
normal weight. Overweight men are not significantly different from normal weight, but we see
that all other categories incur higher costs. The cost of presenteeism more than doubles for each
level of obesity in men, and nearly doubles for each level of obesity in women.
Table 2.4 Incremental Medical Expenditures and Productivity Losses Due to Excess
Weight
Overweight
(BMI 25.0 – 29.9)
Grade I Obese
(BMI 30.0 – 34.9)
Grade II Obese
(BMI 35.0 – 39.9)
Grade III Obese
(BMI 40 and up)
Men
Medical Costs $148 $475 $824 $1,269
Absenteeism Days 0.5 1.6 3.8 5.9
Absenteeism Cost $85 $277 $657 $1,026
Presenteeism Days -3.3 2.3 5.8 21.9
Presenteeism Cost -$555 $391 $1,010 $3,792
Total Cost -$322 $1,143 $2,491 $6,087
Women
Medical Costs $529 $1,274 $2,532 $2,395
Absenteeism Days 1.1 3.1 0.5 9.4
Absenteeism Cost $147 $407 $67 $1,262
Presenteeism Days 0.9 6.3 11 22.7
Presenteeism Cost $121 $843 $1,513 $3,037
Total Cost $797 $2,524 $4,112 $6,694
Finkelstein et al (2010).
One limitation to this study is of course the self-reported data used to estimate the cost of
absenteeism and presenteeism. While self-reported objective data such as weight and days
19. 14
missed due to illness is often biased, the measurement for presenteeism may be more flawed.
Rating on a scale from one to ten how health status affected an employee’s productivity could be
interpreted differently by various employees. Still it shows that presenteeism is very costly to a
company, so it is important to continue research in this area. Yamamoto et al (2009) suggest
biomarkers be used when estimating the effects of presenteeism. Biomarkers measure the
physiological effect of stress, such as working while sick. Combining these measures with the
self-reported data can give a more accurate measure of the costs of presenteeism. Of course
using biomarkers to track presenteeism is something that may be done in an experimental trial,
but not on a regular basis to track productivity. Still, a rigorous study utilizing biomarkers could
give better insight into the cost of presenteeism and possibly come up with a more accurate way
to measure presenteeism on a regular basis.
Obesity clearly increases medical costs for companies, but even more so, obesity costs
companies through loss productivity. Investing in a wellness program that can successfully
reduce and prevent obesity can bring these costs down. This study also emphasizes the
importance of wellness programs to attract the most obese employees as their medical,
absenteeism, and presenteeism costs are so high. While Cawley and Meyerhoefer (2012) agree
with the general result that obesity is associated higher medical costs, they suggest an
instrumental variable approach can show the increase in medical costs caused by obesity, not just
the correlation between obesity and medical costs. Simple correlation may be biased upwards if
workers become obese after suffering an injury, illness, or depression, which is what actually
caused the higher medical costs. On the other hand, correlation could be biased downwards if
obese employees tend to have less access to health care. If they have jobs that offer appropriate
access to health care, their costs would actually be higher. In order to more accurately estimate
20. 15
the medical costs caused by obesity, Cawley and Meyerhoefer (2012) choose to use the weight of
a biological relative as an instrument for the weight of the respondent. They claim this is a
powerful instrument because the weight of biological relative is correlated to the respondent’s
weight. It is a valid instrument because the weight of a biological relative will “be uncorrelated
with the respondent’s residual medical care costs after controlling for predicted respondent
weight and other observed characteristics.”
While Cawley and Meyerhoefer (2012) and Finkelstein et al (2010) both used MEPS
data, Cawley and Meyerhoefer (2012) do not limit their study to full-time employees like
Finkelstein et al (2010). Finkelstein et al (2010) is specifically looking at how obesity affected
costs in the work place (absenteeism and presenteeism in addition to medical care costs), while
Cawley and Meyerhoefer are researching medical care costs caused by obesity in the general
population. Still Cawley and Meyerhoefer (2012) only include working aged adults: adults
between the ages of 20 and 64 who have a child between the ages of 11 years and 20 years.
Ninety-one percent of the people included in Cawley and Meyerhoefer (2012) are employed.
Therefore, applying these results to a workforce is not a very far stretch. Like the previous study
discussed, a regression is first run to find the probability of any medical expenditures as many
respondents do not have any medical expenditures that year. Next a regression is run to estimate
medical expenditures given the respondent had any. Cawley and Meyerhoefer (2012) conclude
that the medical cost of obesity adjusted for endogeneity is $2,741. Running the model without
the instrument, which is what Finkelstein et al (2010) does, shows that the costs associated with
obesity is just $656. This is closer to what Finkelstein et al (2010) finds: increased medical care
costs of $475 for Grade I obese, $824 for Grade II obese, and $1,269 for Grade III obese.
21. 16
To see how the results in this study could be generalized to adults without biological
children between the ages of 11 and 20, Cawley and Meyerhoefer (2012) compare a regression
without the instrumental variable on the adults with biological children between 11 and 20 to the
full sample of adults. They find medical care expenditures associated with obesity to be 16
percent higher in the full population. They suggest that the obese with children are relatively
healthier than those without. This would mean that the IV estimations in this study actually
underestimate the medical costs caused by obesity in the full population. In conclusion, Cawley
and Meyerhoefer (2012) show that the medical care costs caused by obesity are much higher
than previously estimated by just correlation. With the very high costs for obesity, which also
leads to increased absenteeism and presenteeism, employers can decrease their costs and increase
productivity if they lower obesity rates among their employees. While reducing obesity rates is
good for the employer, it is also of course great for the employee. If employees realize the
potential health risks of obesity, they may be more willing to make a change, especially if they
have guidance and support. A wellness program can help achieve this goal.
22. 17
Chapter 3 - Employees’ Interest in Participating in a Wellness
Program
Participation at Small versus Large Companies Determined by Perspectives
As employers can benefit from wellness programs through reduced medical care costs
and absenteeism, employees should also be interested in participating in wellness programs to
improve their individual health status (Stein et al, 2000). While employees generally hold a
positive view on workplace wellness programs, participation rates are often lower than what
employers would like to see. This may be due to employees’ unwillingness to reveal their health
status to their employers, their lack of experience with wellness activities (Wallace and Fisher,
2009), or time constraints (Abraham et al, 2011). A major challenge for any wellness program is
to attract employees that have a high-risk health status (Stave et al, 2003). Andrus and Paul
(1995) claim that what determines the success or failure of a wellness program is the
participation rate of employees and view employees as consumers of wellness programs.
Therefore their study takes a marketing theory approach and looks into what employees want
from a wellness program rather than what management wants. This study emphasizes the
importance of employee input when designing a wellness program; employees are more likely to
participate when they have input in the program. Therefore it is important to look at what
determines an employee’s participation and success. Just as small companies act differently
from large companies when it comes to offering wellness programs, employees at small
company may be interested in participating in wellness programs for different reasons from
employees at large companies.
23. 18
To explore these differences, employees from both large and small companies ranked
statements about various aspects of wellness programs on a scale from one for “very unlikely” to
four for “very likely.” The 24 questions in the model are broken into four factors. Factor 1 is the
General Wellness Factor where employees rank statements like, “An employee wellness program
would increase my morale.” Other statements in this factor gauge employees’ thoughts on how a
wellness program could affect productivity, stress levels at work, employee loyalty, and whether
financial incentives would increase participation. Factor 2 is the Early Detection factor. This is
where employees rank statements like, “I would participate in annual blood pressure testing.”
Factor 3 is the Financial Sponsorship Factor where employees rate statements like, “the company
should pay for a family membership at a privately-owned local fitness facility.” Factor 4
measures employees’ interest in aerobic exercise by having them rate statements like, “I would
participate in an aerobics class three times a week.” These factors are predictors for the
likelihood that an employee would participate in a wellness program.
Overall, as expected, employees with more positive feelings toward wellness programs
are more likely to participate. Employees at both small and large firms are most strongly
influenced by the General Wellness Factor followed by the Aerobic Exercise Factor. However,
unlike employees at small firms, employees at large firms are also significantly affected by the
Early Detection Factor. Andrus and Paul claim that medical screenings used to detect health
problems early could have a major impact on lowering health care costs through at large
companies. The study gives no hypotheses as to why employees at small firms would differ
from employees at large firms in their preference for early detection medical tests. Then in
addressing how small firms can be cost effective with their limited resources, they state,
“employees at small businesses need to be informed about the benefits of early detection testing
24. 19
for diseases.” They talk about small firms taking advantage of free or low cost health screening
available from various nonprofit organizations, but if the small firm employees are not interested
in these programs, this goes against Andrus and Pauls’ marketing approach of viewing the
employees as consumers of the wellness program.
Participation Determined by Employee Characteristics
Abraham et al (2011) also looked at what determines an employee’s likelihood of
participating in a wellness program. Instead of asking employees about their feelings towards
different aspects of a wellness program, though, they focus on the demographics and reported
behaviors for the employees such as age, wage, how many fitness centers are near their home or
work, their exercise frequency, and whether or not they suffered various diagnoses in the past
few years. The study specifically focuses on 17,348 employees at the University of Minnesota
who were enrolled in their medical insurance program in 2008. Experiencing rising costs in
health insurance, the university is looking for ways to decrease costs by promoting healthy
lifestyles. Starting in 2008, employees had the opportunity to enroll in a Fitness Rewards
Program, which paid up to $20 a month for an employee’s gym membership if he or she went at
least eight times a month. By 2010, 6,905 employees were enrolled in the Fitness Rewards
Program. The study is based on two steps of regression. The first step shows the probability an
employee will sign up for the Fitness Rewards Program. The next step shows the probability
that an employee would exercise at least eight times in a month given that he or she signed up for
the program. Both regressions have the same predictors including variables such as exercise
frequency and preferences (fitness center or not) prior to the program, wage, and demographics
such a marital status, age, and presence of young children.
25. 20
The main finding from the first regression is that that “the effect of prior exercise and
attitudes about exercise are statistically significant and large in magnitude.” Prior exercise is
measured by putting employees into one of four categories based on their reported exercise
habits for 2007. Table 3.1 below explains these categories. The fact that regular non-fitness
center exercisers are actually less likely to sign up for the fitness program than the non-exercises
suggests very low willingness to substitute one form of fitness for another. As expected, and
consistent with Andrus and Pauls’ (1995) conclusions of both small and large firm employees,
this study also shows that employees with stronger positive feelings toward exercise are more
likely to sign up for the program. Similarly, Stein, et al (2000) finds that employees who
participate in activity related programs within a wellness program are more likely to be the more
active employees. This illustrates the issues that the employers may be paying for gym
memberships for employees who would have a gym membership either way, thereby not
improving the overall health of its employees and thereby not decreasing cost.
Stein et al (2000) also finds that overweight employees are more likely to participate in
weight reduction programs. This implies that overweight employees may not be as willing to get
active but are interested in participating in programs to change their lifestyles to lose weight.
Employees with higher perceived opportunity costs of exercise are less likely to join (Abraham,
et al, 2011). The time cost of exercise is significant in an employee’s decision to sign up for the
program. The number of exercise facilities on an employee’s specific campus location and in the
same zip code as his or her residence both increased the likelihood he or she would participate in
the program. These two facts show that the more barriers there are in getting to a fitness center,
the less likely an employee will go.
26. 21
Younger workers, 18 to 34 years, are more likely to sign up for a fitness program than
employees 55 years and older (Abraham et al 2011). Joslin et al (2006), however, finds that
participants in health education programs, which included exercise contests, are more likely to be
older workers, over 44 years old. Meanwhile, Stein et al (2000) finds that middle aged to older
workers, 35 to 54, are more likely to participate in wellness program activities than are
employees under 25 or over 55. The difference in the findings on how age can affect
participation in wellness programs may be that Abraham et al (2011) looks at participation in an
“exercise-focused” program, while Joslin et al (2006) groups together participation in “health
education offerings”, which include Lunch and Learn sessions and personal health appointments
along with exercise contests. Furthermore, the older participants could be more interested in the
other health education offerings than the exercise contests and fitness programs that seem to
attract younger workers. Joslin et al (2006) finds no correlation between age and likelihood to
participate in medical offerings (vaccines and medical screenings); this suggests that all ages of
workers are equally like to participate in medical offerings. Stein et al (2000) has an even
broader wellness program which included smoking cessation support and medical screenings as
well. This broad wellness program is more likely to attract the full middle aged ranged of
workers than the younger or older ones. Like Stein et al (2000), Aldana et al (2005) finds
employees in the 30 to 39 age range are most likely to participate in a comprehensive wellness
program. This shows how wellness programs are categorized makes a difference in finding what
employee characteristics are correlated to participation. Still, all four studies show women are
more likely to participate in the wellness programs than men.
Participation in the fitness program among employees with chronic conditions varies.
Employees with low back pain and diabetes are less likely to sign up for the fitness program,
27. 22
while those with musculoskeletal problems are actually more likely to sign up (Abraham et al,
2011). Medical expenditures in the year before the program began does not play a role in an
employee’s decision to sign up. Joslin et al (2006) finds that employees who participate in the
medical offerings (vaccines and health screenings) are more likely to be chronically ill, but
chronic illness is not related to participation in health education offerings (Lunch and Learn and
exercise contests). Employees who signed up for either of the health education offerings or the
medical offerings are more likely to report a poorer quality of living. Quality of living is based
on the Short Form 36, which is a widely used form to measure overall health-related quality of
life from physical state to social and emotional aspects (Joslin et al, 2006). While these two
studies both use similar predictors to find employees’ likelihood of participating in employer
sponsored wellness programs, the two studies’ wellness program offerings are very different.
The wellness program in Abraham et al (2011) just focuses on increasing exercise, while the
wellness programs in Joslin et al (2006) offers more options from basic health education to
medical screenings. It is therefore reasonable that the workers with poorer quality of life are not
as interested in going to fitness center, but more interested in benefits like medical screenings
and education. This is consistent with Stein et al (2000), which finds that employees who
suffered from high blood pressure or high cholesterol are more likely to participate in health
promotion activities to reduce these issues, but overall healthier employees are more likely to
participate in fitness activities.
Wage does not play a significant role in the decision for an employee to sign up for the
fitness program (Abraham et al, 2001) nor does it play a role for employees to sign up for health
education offerings (Joslin et al, 2006). Workers who sign up for the medical offerings are likely
to make less than the average salary of $60,000 (Joslin et al, 2006). This again may point to the
28. 23
fact that workers with lower incomes are interested in vaccines and health screenings but not
fitness. Abraham et al (2011) do find a difference in likelihood to participate in a fitness
program based on type of job: academic professionals, faculty, and civil service employees are
are all more likely to sign up than bargaining-unit employees. This is consistent with Aldana et
al (2005) which finds certified employees (teachers and administrators) in a school district-wide
wellness program are more likely to participate than classified employees (staff members, bus
drivers, cafeteria workers, and facilities personnel). Similarly, part-time and non-managerial
employees are less likely to participate in wellness activities (Stein, 2000). The various results
on how income and occupation affect likelihood to participate in a wellness program stem from
two opposing effects. Employees with higher incomes have higher opportunity costs to
exercising, which means they are less likely to do so. Higher socioeconomic status as shown by
wage and type of job, however will be higher correlated with willingness to exercise, as higher
socioeconomic status shows a willingness to invest in one’s overall wellbeing.
Abraham et al (2011) continues on to a second regression that measures the likelihood an
employee will be a regular exerciser (go to the fitness center at least eight times per month)
given he or she signed up for the fitness program. The regression is based on the same variables
that led them to sign up. Again prior exercise plays a key role in the likelihood they would be a
regular exerciser. These results can be found in Table 3.1. The number of fitness centers in
their zip code does not play a role in how often the participants go to the gym like it does in their
likelihood to sign up, but employees at the smaller campuses go more often. While younger
workers and females are more likely sign up for the program, they are less likely to exercise
frequently. Watson and Gauthier (2003) similarly find that men’s actual participation in a
wellness programs as shown by the number of points they accrue for physical activity is higher
29. 24
compared to women in their study. This shows that simply willing to sign up for a program does
not mean employees will actually change or improve their behavior.
Table 3.1 Summary of How Previous Exercise Habits Affect Likelihood to Sign Up for a
Fitness Program and the Likelihood of Being a Regular Exerciser Conditional on Sign Up
Category Description
Increased likelihood
to sign up relative to
control group*
Increased likelihood to be a
regular exerciser given employee
signed up for the program
relative to control group*
Regular Fitness
Center
Exerciser
Exercised at least 2-3
times per week in a
fitness center
30.6 18.8
Sporadic
Fitness Center
Exerciser
Exercised one time per
week at fitness center
21.6 -12.6
Regular Non-
fitness center
exerciser
Exercised at least 2-3
times per week outside
of a fitness center
-16.7 0
*Control group (non-exerciser): Exercised zero times per week in a fitness center and one time or less outside of a
fitness center
Abraham et al, 2011.
How Incentives Affect the Success of Wellness Programs
Once an employer sees the potential benefits to the company from offering a wellness
program and decides to do so, it is then up to the employees to decide to participate. As
discussed throughout this chapter, the participants in wellness programs tend to be the more fit,
healthy, and active employees. Because these employees have already built and maintained a
healthy lifestyle for themselves, their participation in a wellness program will not lead to the
decreases in medical care costs that we would expect to see from an unhealthy employee
participating in the wellness program. To see the highest cost-benefit ratio of a wellness
program, it must attract the unhealthy employees. Chapter 2 reviews the costs of obesity, which
30. 25
is why many wellness programs focus on weight loss. If simply offering the wellness program,
which may include an onsite fitness center or reimbursements for a membership to private fitness
center, only attracts the employees who already exercise, maybe offering additional financial
incentives will attract the other employees. Incentives may attract employees who would
otherwise not be willing to participate in a wellness program. Incentives will make a wellness
program more successful if they attract more participants who lost weight or otherwise improve
their health, leading to lower health care costs for the employer and lower levels of absenteeism.
Eight percent of firms that offer some kind of wellness program give incentives to
encourage participation. Incentives may be cash but also include gift cards, merchandise, and
prizes. A few of these firms even offer lower premiums or deductibles (Kaiser Family
Foundation, 2013). In a study of rural organizations, Zula et al (2013) finds that about 40
percent of these firms offer incentives for participation. Again this is much higher than the
figure provided by the nation-wide Employer Health Benefits Survey. Gift cards, gifts, and
reduction in medical plan costs are actually more common incentives than cash or monetary
incentives. Paid time off is equally as common as cash or monetary incentives.
Offering financial incentives for weight loss may overcome the problem of salience.
That is, the benefits of losing weight (better health and quality of life) are not realized in the
short run, yet the costs and discomfort of dieting and exercise are immediate (Cawley and Pierce,
2013). A financial incentive would offer a more short term benefit to weight loss; leading to the
hypothesis that participants who are offered financial incentives for weight loss will lose more
weight than those who are not offered any financial incentives (Cawley and Pierce, 2013).
Cawley and Pierce (2013) also hypothesize that participants are less likely to quit a weight loss
program when they are offered financial incentives for weight loss. Several methods of offering
31. 26
financial incentives have been tried. Cawley and Pierce (2013) predict that offering a forfeitable
bond rather than a reward of the same size would be more effective as people tend to be risk
averse; the employees would work harder to avoid losing $100 than they would to earn $100.
This idea lead to an experiment with four different incentive schedules offered to employees who
are overweight (BMI of at least 25). The data comes from a company that specializes in helping
employers provide financial incentives to their employees for losing weight. The employer
decides which set of incentives would be offered to its employees. This may be a problem if the
incentive program an employer chooses is correlated with unobserved employee characteristics
that affect attrition and weight loss. To address this potential issue, the employers are asked
about their decision of incentive schedules. Their answers are based on financial factors like not
wanting to invest in the incentives or wanting to pay all incentives at the end. While this does
not prove that the employers’ decisions are not related to the factors that determine a
participant’s weight loss or likelihood of quitting the program, it does not seem to cause a bias in
the analysis (Cawley and Pierce, 2013). Another potential bias comes from the fact that
participants self-selected to volunteer for the program, and it is likely that the participants are
significantly different (possibly more motivated to begin with) from the non-participants.
Therefore the results of this study cannot be applied to the entire population of employees. Still,
as Cawley and Pierce (2013) point out, most incentive programs of this kind are voluntary
participation; therefore, other employers can expect similar results. Another potential for bias is
differential selection if participants in an incentive program would not have chosen to participate
in a control group.
Participants in all four groups have access to some basic tools including daily emails with
tips and recommendations on how to exercise and eat better, call center support, and monthly
32. 27
weigh-ins. All groups except the control group have access to an exercise program in which they
chose foundation, intermediate, or advanced level. The first group is the continuous payment
group. Participants in this group pay no enrollment fee and received quarterly payments
determined by percent of baseline weight lost to date. The specific incentive schedule is shown
in Table 3.2. Cawley and Price (2013) measure the rewards earned by participants based on
pound-years, where one pound lost in the first quarter counted as one pound-year, but a pound
lost in the fourth quarter only counted as one quarter pound-year. On average, participants in
this program earn $2.10 for each pound-year of weight loss.
Table 3.2 Incentive Schedule for Percent of Baseline Weight Lost
Percentage
points of baseline
weight loss
Continuous
Payment
Group
Deposit Contract with
Lump Sum Repayment
Deposit
Contract with
Continuous
Repayment
Control
Quarters 1-4 Quarters 1-3 Quarter 4 Quarters 1-4 Quarters 1-4
1 $3 $0 $0 $15 $0
2 $6 $0 $0 $21 $0
3 $9 $0 $0 $30 $0
4 $12 $0 $0 $36 $0
5 $15 $0 $109.45 $45 $0
6 $15 $0 $109.45 $45 $0
7 $15 $0 $109.45 $51 $0
10 $30 $0 $209.45 $60 $0
15 $45 $0 $209.45 $75 $0
20 $75 $0 $209.45 $90 $0
25 $105 $0 $209.45 $90 $0
30 $150 $0 $209.45 $90 $0
Cawley and Price, 2013.
The second group is a deposit contract with lump sum repayment. Participants pay $9.95
per month, except the first month, which is free. All of these fees are refunded by the end of the
33. 28
year-long program if the participant loses at least five percent of his or her baseline weight. If
the participant loses ten percent or more of his or her baseline weight by the end of the year, she
will receive a $100 bonus. The program also offers monthly drawings for those who lost the
most weight along with an extra $250 for the biggest loser. Even with these extra bonuses and
prizes, the average participant actually lost $19.42 for each pound-year of weight loss. This is
because so many participants pay the monthly fee to be in the program but do lose at least five
percent of baseline weight, thereby meaning they do not get their fees back or the bonuses.
The third group is the deposit contract with continuous repayment. This group is actually
the second year program for those who participated in the deposit contract with lump sum
repayment for the first year. Again the participants pay $9.95 a month to be in the program, but
this time incentives are paid quarterly. Rewards begin with one percent of baseline weight loss
and increase up to twenty percent of baseline weight loss. On average, participants in this
program earned $1.66 for each pound-year of weight loss.
The fourth group is the control group. The only incentive these participants are offered is
$20 for participating for the entire year, which meant weighing in once each quarter. The
participants are offered the same support as the other groups but have no monetary incentive to
lose weight.
To test the hypothesis that financial incentives decrease attrition, Cawley and Price
(2013) estimate a hazard model of probability based on age, whether the participant is obesity or
morbidly obese, incentive group, fitness level selected, email open rate, whether not they
participated in a team competition, and lagged percent weight loss. Sixty-five percent of all
enrollees dropped out before the end of the program. Participants in the continuous payment
schedule are 88 percent more likely to quit the program than those in the control group, and
34. 29
participants in the deposit contract with continuous repayment group are 55 percent more likely
to quit than those in the control group. The likelihood of attrition in the deposit contract with
lump sum repayment does not significantly differ from the control group. It is expected that
attrition among the two deposit contract groups will be lower than the control group for two main
reasons. The first reason is that since these employees are willing to pay the monthly fees they
are likely more motivated or confident about weight loss. The second reason is risk aversion—if
an employee drops out of one of these programs he or she is forfeiting the fees. The results show
that the participants in the deposit contracts are not less likely than those in the control group to
quit. This may be because the participants in the deposit contract groups see the monthly fees
they already paid as sunk costs, and once they realize they are not going to be successful in the
program, decide to drop out to avoid losing any more. This is supported by the fact attrition is
negatively correlated with success in a program; the marginal effect of one percentage point of
baseline weight loss is a 2.7 percent decrease in the likelihood of quitting in the next quarter.
Another reason participants in the control group are actually less likely to drop out may be
because they do not have to pay anything, and they would receive $20 just for weighing in each
quarter. The obese and morbidly obese are more likely to quit than participants who are not
obese. This again relates to the problem that wellness programs may not be helping the
unhealthiest employees.
The large amount of attrition plays a big role in the way this data could be analyzed, as
we want to know the total weight loss, but there is no record of final weight for all the employees
who quit the program early. Participants who complete the program could be compared among
the four groups (completers’ analysis), but this would likely show a bias towards the positive
impact of the program. Another way to look at it is to compare all of the participants among the
35. 30
four groups assuming that the quitters either maintained the weight they were when they left the
program or that they returned to their baseline weight. The former would likely create a positive
bias for the effect of the program, while the latter would create a negative bias. The fact that
success in the program is negatively correlated to attrition suggests that carrying forward the
dropouts’ weights at the time they quit the program is a good measure.
To test the hypothesis that financial incentives increase weight loss, Cawley and Price
(2013) run a regression model for each of the three ways to account for the weight of those who
quit the program that predicted weight loss in pounds. Contrary to the hypothesis, none of the
models show a significant difference in weight loss between the continuous repayment group and
the control group. Looking at just those who completed the program, participants in the deposit
contract with lump sum repayment lost on average 7.7 more pounds than participants in the
control group. By comparing all participants and assuming quitters return to their baseline
weight, the deposit contract with continuous repayment participants only lost two pounds more
than those in the control group. Participants in the deposit contract with continuous repayment
show a similar pattern: the completers’ analysis show that participants typically lost 9.1 pounds
more than the control group, but this advantage falls to around two pounds when assuming that
those who quit either return to their base weight or stay at their last recorded weight. In all
groups, weight loss is higher in the first two quarters of participation than the following two for
all groups. Table 3.3 gives a summary of the results from this study.
36. 31
Table 3.3 Summary Results of “A Case Study of a Workplace Wellness Program that
Offers Financial Incentives for Weight Loss”
Group
Enrollment
Fee
Reward System
Average
Reward
Amount for
each
pound-year
of weight
loss
Significant
Difference
in the
Likelihood
of Attrition
Compared
to Control
Group
Significant
Difference
in the Total
Pounds
Lost
Compared
to Control
Group
Continuous
Payment
None
Quarterly payments
for percent of
baseline weight lost
$2.10 88%
CA: 0
BCF: 0
LCF: 0
Deposit
Contract
with Lump
Sum
Repayment
First month
free then
$9.95 per
month
Gets fees back if
participants loses
5% of baseline
weight; $100 bonus
if participant loses
10% of baseline
weight
($19.42) 0%
CA: 7.708
BCF: 2.082
LCF: 0
Deposit
Contract
with
Continuous
Repayment
First month
free then
$9.95 per
month
Quarterly payments
for percent of
baseline weight loss
$1.66 55%
CA: 9.127
BCF: 1.944
LCF: 2.301
Control Group: Paid $20 at the end of the year if the participant weighed in each quarter
Cawley and Price, 2013. CA= Completers’ Analysis, BCF= Baseline weight Carried Forward, LCF= Last recorded
weight carried forward.
In conclusion, this study finds that incentives to lose weight make little or no difference
in the amount of weight participants lost and does not keep them from quitting the program.
This real world event shows much higher attrition than past studied pilot programs. This is not
surprising as pilot programs often perform better than the actual implementation as they soon run
into diseconomies of scale and trouble adapting to different local environments. One suggested
issue is that the rewards for weight loss are likely to compete with weight gain in muscle mass
when participants begin to work out. Another problem may be the complexity of the incentive
37. 32
schedule (shown in Table 3.2); the large number of thresholds may make the programs
confusing. Attrition may also be reduced if rewards are paid monthly instead of quarterly, since
fees to stay in the program are paid monthly by participants in the programs that required a fee.
This gave participants incentive to quit if they are not on track to reaching the repayment
thresholds. Requiring one large fee at the beginning could fix this issue. Of course the size and
type of financial reward will play a role in this success of the program. Future studies could
determine whether there are diminishing returns to the size of the reward. The elasticity of
weight loss to financial weight loss could also be useful in implementing the most efficient
incentive schedule. There may be differences in this elasticity of demand on the type of
payment: certain or lottery.
Kane et al (2004) researches how economic incentives affected consumers’ preventive
behavior. This study does not focus only on employees or workplace wellness programs, but it
does give information on how people react to incentives when it comes to preventive health care.
These studies are broken into two categories: simple and complex preventive care. Simple
preventive care is direct and can often be completed in one visit, such as immunizations.
Complex preventive care requires sustained behavior change such as diet. Simple studies tend to
involve populations of low socio-economic status, while the complex studies tend to involve
generally healthy, middle class populations, sometimes based on work sites. All studies involve
incentives for participating in preventive care. These incentives vary greatly and included cash,
free transportation to the event, entries into lotteries and drawings, prizes, and coupons. Rewards
for participation or achieving goals are effective in changing behaviors. Most of these
experiments involve incentives for participation, not based on actual achievement as in Cawley
and Price (2013), which may be why they are more effective. These behavior changes seem to
38. 33
only last in the short-run, though. As expected, higher cash incentives lead to higher response to
the incentive. The studies shows an overall lack in attempt to actually calculate a cost-benefit
ratio in most of these events. While it has been shown that small incentives can change short-
term behavior, none of them find what level of incentive is necessary to cause a major sustained
effect.
Elasticity of Demand for Wellness Programs
While there is not any research yet in the elasticity of weight loss with respect to financial
incentives, we do have an idea of the own price elasticity of wellness programs. Some
employers offer financial incentives for participation in a wellness programs, some employees
have to pay for wellness benefits. After confirming with previous research that the own price
elasticity of health insurance is near zero, Royalty and Hagens (2004) took their study further to
find the own price elasticities of what they call auxiliary benefits such as dental insurance, vision
benefits, long-term care insurance, and wellness benefits. In this study participants are able to
enroll in various wellness program offerings that included different combinations of benefits
such as fitness center discounts, an on-site fitness center, health risk assessments, and support in
areas such as smoking cessation or weight loss. Enrollment in these wellness programs cost $25
to $1,000 a year. To find the elasticity of demand for wellness benefits, employees are given a
list of wellness benefit options and chose the ones they are interested in. Then they decide if
they would actually participate in these programs under three different price scenarios: baseline,
75 percent of baseline, and 125 percent of baseline. This method shows only the effect of the
price change instead of capturing changes in the quality of the program. They find a price
elasticity of wellness benefits of -0.766. While this is still an inelastic demand, it is much more
elastic than that of health insurance. This means that consumers are more price sensitive to the
39. 34
cost of wellness programs than they are to the cost of health insurance. This finding is important
to employers interested in offering a wellness program because it gives a measure of how many
more employees can be expected to participate if the cost decreases. A wellness program will
only be beneficial to a company if the employees are willing to participate.
40. 35
Chapter 4 - Benefits Analysis of Wellness Programs
Studies of Specific Wellness Programs
Johnson & Johnson’s Live for Life Program
After discussing what determines employers’ interest in offering a wellness program and
what determines employees’ willingness to participate, the question now is what is the return on
investment for an employer offering a wellness program? Johnson & Johnson has invested
millions of dollars in its comprehensive wellness program (Goetzel, et al, 2002). A successful
wellness program will reduce the health risks of employees and must help the highest risk
employees. Johnson & Johnson has been working towards those goals since 1979 with its Live
for Life Program. Evaluations from the 1980s and 1990s show that the Live for Life Program
lead to “improved employee health, reduced impatient health care expenditures, decrease
employee absenteeism, and better employee attitudes.” The corporation continually invests in
external program evaluation to find ways to improve its wellness program. Wallace and Fisher
(2009) also suggest wellness programs be continuously reevaluated, redirected, and enhanced.
In 1993, Johnson and Johnson began a transformation within its wellness program to better
integrate its various health and wellness offerings. To be more cost effective than previously, the
new wellness program focuses on changing behaviors and psychosocial risk factors to avoid
health issues before they become costly. To encourage participation, the company offers
participants a $500 medical benefit credit. Ninety percent of approximately 43,000 employees
participate in the program. This is an unusually high participation rate which may be due to
longstanding support for health promotion in the corporation. It cannot be concluded that the
incentives lead to the higher participation because there is no control group.
41. 36
The first step of the program is a health risk assessment, which included biometric
screenings and a survey to assess risky behaviors. Employees who are high risk in terms of high
blood pressure, high cholesterol, or who smoke, are referred to a high risk intervention program
known as Pathways to Change (PTC). After five years of participation in the program, analysis
shows how all employees’ health statuses have changed and whether the proportion of high-risk
employees differed significantly between the PTC participants and non-participants. To find if
the PTC programs actually made a difference, employees in the program must be compared to
those not in the program; otherwise we could just be observing an overall trend in decreased
blood pressure for example. As seen in Table 4.1, the percentage of all participants with high
blood pressure and high cholesterol decreased, but these percent changes are larger among those
in the PTC programs. This shows that the targeted efforts of reducing high blood pressure and
high cholesterol are successful. While smoking does significantly decrease among those in the
PTC program, those not in the PTC program actually saw greater decreases. The study suggests
that this is not a problem with the smoking cessation program but a reporting issue. Blood
pressure and cholesterol levels are collected through medical screenings whereas smoking is self-
reported. It is likely that many employees lied about their smoking habits as a higher percentage
of employees not in the PTC smoked than those in the PTC program. Overall, the data shows
that the Johnson & Johnson wellness program successfully improved employees’ health.
42. 37
Table 4.1 Percent Change in Participants at Risk after Live for Life Program
Percent Change
in All
Participants at
High Risk
%
Percent Change
in PTC
Participants at
High Risk
%
Non PTC
Participants at
High Risk
%
Impact of PTC
Compared to
all Participants
Poor aerobic exercise habits -10.7 * -11.9 * -10.9 * Better
Cigarette Smoking -8.8 * -2.5 * -16.8 * Worse
High Body Weight 2.1* 0.4 3.4 * Better
High Blood Pressure -8.4 * -2.8 * -0.2 Better
High Total Cholesterol -23.0 * -35.8 * -14.2 * Better
Poor Seat Belt Use -1.8 * -1.4 * -2.3 * Worse
Drinking and Driving -0.6 * -0.3 -1.2 * Worse
High Fat Intake 3.0 * 2.8 * 3.6 * Better
Low Fiber Intake -8.6 * -8.9 * -9.6 * Worse
Diabetes Risk 2.3 * 0.9 2.9 * Better
Goetzel et al (2002).*Indicates statistically significant difference at the 95% confidence level.
Beyond analyzing the differences in risk profiles of the participations, Johnson &
Johnson also wanted to know how its health and wellness program affected expenditures. To do
this, Ozminkowski et al (2002) analyzes participants’ health care utilization before and after
participation in the program. Emergency room visits, outpatient and doctors’ office
appointments, mental health care visits, and impatient hospital days are all recorded. Medical
claims that are not expected to be influenced by participation in the wellness program (such as
maternity care, chemotherapy, speech therapy, and ambulance use) are not included in this study.
43. 38
Medical utilization is recorded instead of direct medical expenditures because one quarter of
employees are part of a health maintenance organization that unfortunately could not provide
expenditures for specific individuals. The impact of the program is determined by the change in
health care utilization for each year of the program as compared to the period before the program
began. One benefit of this data is health care utilization for the four years prior to
implementation of the health care program is available. By comparing to a longer period of time
instead of just one year before the start of the program, we can differentiate decreases in health
care utilization due to the wellness program from decreases that may have been trending over
time due to other reasons. This is especially important in this study because there is no control
group as the wellness program is offered to all employees and so many decided to participate.
The estimates of change in health care utilization are then monetized by multiplying them by the
corresponding average cost of the service. A fixed effect regression model controls for
employee characteristics to give a more accurate picture of the effects of the program. The
results are shown in Table 4.2. Small increases in emergency room visits are largely offset by
savings in the other types of care for an overall average savings of $224.66 per employee per
year. The overall savings increases each year of the study. Studies based on longer periods of
time would be beneficial to find where diminishing returns actually set in. It may also be that
some studies do not show decreased costs because they do not occur in the first two years in
which many wellness programs are analyzed but would occur later. The costs of this program
are not given in order to calculate a cost-benefit analysis. Still, taken together, Goetzel et al
(2002) and Ozminkowski et al (2002) show that Johnson & Johnson’s Live for Life program has
successfully improved the health of its at-risk employee and decreased health care costs by
decreasing utilization.
44. 39
Table 4.2 Savings per Employee per Year After Start of the Health & Wellness Program
Type of Care
1 Year
After
Start
2 Years
After
Start
3 Years
After
Start
4 Years
After
Start
Weighted
Average Per
Employee
Per Year
Overall Savings $91.99 $131.02 $355.54 $413 $224.66
Emergency Room Visits -$12.15 -$14.43 -$7.27 -$8.06 -$10.87
Outpatient/Doctors’ Office Visits -$35.04 -$3.85 $146.60 $121.93 $45.17
Mental Health Visits $78.42 $55.05 $51.49 $103.43 $70.69
Impatient Days $60.76 $94.25 $164.72 $195.80 $119.67
Ozminkowski et al (2002).
Contract for Health and Wellness
Employers are concerned that selection bias will prevent a wellness program from
actually saving them any money: if the employees who participate in the wellness programs are
the same employees who would frequently exercise, eat healthy food and monitor their health
without an employer-sponsored wellness programs, then no savings will result. Johnson &
Johnson conquered this problem by giving incentives to participate and their longstanding
managerial support for the program. Stave et al (2003) finds that the participants in the Contract
for Health and Wellness actually have higher average health care costs than non-participants in
the year prior to its implementation. The Contract for Health and Wellness is based on the
concept that employees would be more committed to completing a program if they signed a
contract to do so. This program has five focus areas: avoid tobacco use, better nutrition, increase
activity, manage stress, and encourage preventive health practices. This program focused on all
45. 40
five of these areas for all participants regardless of risk. At the beginning of each year,
participants reported where they are in a “readiness-for-change continuum” for the first four
focus areas. The five stages of readiness-for-change are precontemplation, contemplation,
planning, action, and maintenance. Then the participants signed a Contract for Health and
Wellness, which is a commitment of health behaviors for the following year. The company
offers seminars and support to aid with those commitments. Employees also have to participate
in medical screenings which included blood pressure, pulse, respiratory rate, and weight.
Employees received points for participation in these programs and earned rewards at the end of
the year based on the number of points. The average reward is valued at less $50.
Beyond the self-reported readiness-for-change and the medical screening data, the study
also included short-term and long-term disability claims and the associated workers’
compensation, health care costs paid by the employer, and prescription drug cost. The study also
uses employee demographics such as age, tenure, gender, race, marital status, full or part-time
status, and salary. These are used as covariates to control for differences between participants
and non-participants. First, the change in total health cost from one year to the next is the
dependent variable in regression analysis. Using this approach, as opposed to estimating the
total health care costs, allows individuals to act their own control: “the effect of program
participation can be measured independently of factors affecting the likelihood of participation,”
Stave et al, 2003. Each year saw progression along the stages of readiness-for-progression. This
includes large increases in the proportion of participants in the maintenance stage in the
nutrition, physical activity, and stress management categories. Broken down by year, the savings
for each participant (as calculated by the difference between that particular employee’s total
health care costs from one year to the next) increase each year, showing improved health among
46. 41
the participants. This also suggests diminishing returns for wellness programs do not set in until
sometime after the third year. Savings per employee went from $233 in the first year to $375 in
the second year to $944 in the third year. By the fourth year of the program, the expected
savings per participant is $950. Just $185 in savings is due to lower health care costs; most of
the savings come from reduced use of nonoccupational disability benefits. With an average of
around $600 in savings per participant and average cost around just $100 per participant, the
return on this investment is over 600 percent. These findings are consistent with Ozminkowski
et al (2002) who find the average saving per year per employee due to decreased health care
utilization is $225. Furthermore Ozminkowski et al (2002) also find savings to increase over
time. Whether or not signing a contract increased success and participation cannot be concluded
because there is no control group.
The next step is to compare the decrease in total costs between employees who
participated for all three years and those who had never participated. Employees who
participated in the wellness program for three years have $777 higher savings on average per
year in total health care costs than nonparticipants (Stave et al, 2003). Not only do participants
have more cost savings than non-participants, but as stated before, the participants actually have
higher average total costs in the year before the program was implemented than non-participants.
Overall, this study indicates that the Contract for Health and Wellness successfully reduced
health care costs not only through lower medical costs but also lower disability costs and
increased productivity.
Health Quotient
Stein et al (2000) measures changes in employees’ Health Quotient throughout the years
of participation in a wellness program. Participants in the Health Quotient program are awarded
47. 42
a positive or negative number of points following a medical screening, which translate to
positive or negative dollars to be applied to their cafeteria benefit plan. Where Stave et al (2003)
measures differences in participants’ total costs, Stein et al (2000) measures the difference in
participants’ Health Quotient points. Stave et al (2003) finds the savings increased throughout
the Contract for Health and Wellness, whereas Stein et al (2000) finds improvements in Health
Quotient diminished over time. The study concludes that this ss due to “reduced novelty factor.”
Stein et al (2000) finds that absenteeism among wellness participants is reduced, by 0.15 days on
average per employee. Unfortunately, this study does not come to the same conclusion about
savings due to reduced short-term disability. The study shows reduced short-term disability in
most years but not all. They conclude this is due to the fact that not many workers claim short-
term disability in any given year, but the individuals who do, missed a substantial number of
days. This variability does not allow them to statistically significantly conclude that the wellness
program reduced short-term disability claims. Stein et al (2000) hypothesizes that employees
with the lowest Health Quotient scores would be the most likely to participate, but this trend only
held for the first year. In the following three years there is no relationship between Health
Quotient and participation in the overall wellness program, but, as mentioned earlier, there is a
relationship between participation in specific activities and specific health risks: employees with
higher body fat are more likely to participate in weight loss programs, and employees with high
blood pressure high cholesterol participated in activities specifically to combat those issues.
Participants in activity-related programs are more likely to be the more fit and active employees.
Stein et al (2000) is able to conclude that wellness programs do reduce absenteeism and could
increase Health Quotients in specific areas.
48. 43
Wellness Challenge Program
Aldana et al (2005) studies how a short-term comprehensive wellness program could
decrease health care costs and absenteeism. The study is based on a wellness program offered in
2001 and 2002 Washoe County School District. The wellness program offers a variety of
voluntary challenges, most of which participants tracked and reported their own success. The
challenges include becoming more active, weight management, getting enough sleep, fitness, and
proper nutrition. Of the 6,246 eligible employees, 22.5 percent participated the first year, and
20.2 percent participated in the second year. The results show no relationship between
participation in the wellness program and medical claims. They do, however, find that
participants in the wellness program have 20 percent less absenteeism. Absenteeism among
teachers has extra costs as the district is not only paying them to not be there but also have to pay
for a substitute. Due to the differences in absenteeism among wellness program participants, the
cost-benefit ratio of the program is 15.6. Aldana et al (2005) admits, however, that the lower
absenteeism among wellness program participants may not actually be due to better health, but
may actually be showing a correlation with devotion to their employer. It may be that the
employees who volunteer for the wellness programs are the same employees who try harder to
avoid sick days; both are actually showing employee morale. Stave et al (2003) avoids this issue
by comparing individual’s change in health care costs and absenteeism before and after
participation in a wellness program instead of just comparing participants and non-participants.
Another reason this study may not have found a decrease in health care costs is the lack of rigor
in the wellness program itself. Many challenges involve activities such as participants self-
reporting on their improvement in eating enough fruits and vegetables. The wellness program
described by Stave et al (2003) is much more interactive and involved data recorded from
medical screenings. Aldana et al (2005) also suggests that the effects of wellness programs on
49. 44
health care costs may come after longer period of time as more costly chronic diseases are
prevented.
Points for Fitness Activities
In their study of wellness program participation and success, Watson and Gauthier (2003)
state that “the activities that compromise organizational wellness efforts cover a broad spectrum,
which results in substantial differences in employee outcomes.” Watson and Gauthier study
wellness programs offered by two different employers. The first is a large service company who
offered a wellness program that involves employees accruing point for fitness activities such as
swimming, running, tennis, cycling, etc. at a local fitness center. The participants could
exchange their points for prizes such as restaurant gift cards, movie passes, books. Because all
employees in this study are offered the same prize incentives there is no control for how the
potential to earn prizes affected participation or success. It would be beneficial, however, in
future research to compare how frequent, small prizes for participation like the one in this study
compare to monetary incentives for losing a percentage of baseline body weight as in Cawley
and Price (2013). Although the prizes described in Watson and Gauthier (2003) are likely less
valuable than the monetary incentives explained in Cawley and Price (2013), they may be more
effective, as they are easier to earn. Giving out small prizes for participation could encourage
employees to keep participating regardless of actual change in health, which may eventually lead
to improved health. In the experiment described in Cawley and Price (2013), participants who
have to pay to participate with the promise of their fees back if they lose enough weight have an
incentive to quit if they are not on track. Watson and Gauthier (2003) find that participants who
accrue more points take fewer sick days due to illness; participants who increased their aerobic
capacity also took fewer sick days. Weight, however, does not play a role in the number of sick
50. 45
days as would be suggested by Finkelstein et al (2010). This may be because Watson and
Gauthier (2003) show how weight loss in pounds related to sick days, while Finkelstein et al
(2001) show how obesity level related to absenteeism as compared to health weight individuals.
The participants in Watson and Gauthier (2003) may not have lost a substantial amount of
weight or may not have been very overweight on average to begin with; this information is not
available. Meanwhile, Finkelstein et al (2010) specifically focused on obese workers and shows
how obesity related to increased absenteeism.
Analysis of a Failed Program
The second wellness program studied in Watson and Gauthier (2003) is studying low
participation in a program that ended up being cancelled after two years of its introduction due to
low participation and lack of funds. This wellness program is offered by a city government and
consisted of both physical activities and educational seminars on stress management, nutrition,
and smoking cessation. Just a year and a half after the program began; a survey was distributed
to employees and managers to look into why participation had been so low. While 82 percent of
managers think participation would increase productivity, 80.7 percent of them admit to not
participating themselves. Their main reasons for not participating is that they are members of
private gyms or due to time constraints. This is consistent with Abraham et al (2011) who finds
low willingness to substitute previously held exercise habits for ones that fit in with a wellness
program and that perceived opportunity cost of exercise played a significant role in participation.
When asked what would increase their participation, 71.8 percent of managers say decreased
insurance rates. Cawley and Price (2013) find that financial incentives to lose weight do not
actually reduce attrition in a wellness program, but the potential to decrease insurance rates may
have a different result. Again, further research should compare how the incentive of decreased
51. 46
insurance rates based on participation (events attended and amount of time doing physical
activity) versus based on measured success (reduced BMI, reduced blood pressure, or reduced
cholesterol for example) would increase participation, and decrease attrition, health care costs,
absenteeism, and presenteeism. Further research may also show that there is a difference in the
effectiveness of offering cash incentives and offer incentives in the form of lower premiums.
Despite low management participation, only 7.7 percent of managers attribute low
employee participation to lack of management support. When employees are asked to rate the
support they felt from management on a scale from one for no support to five for very supported,
the average is a moderate 3.36. Almost half of managers attribute low employee participation to
lack of time. 25.5 percent of employees said they would attend wellness program events more
often if they were offered at times other than lunch and just after work. Seventeen percent of
employees say they would participate with better incentives. Despite low participation in the
wellness program, 56.4 percent of employees report they exercise elsewhere. Watson and
Gauthier (2003) suggest that the low participation in the wellness group even with employees
who show interest in fitness is due to lack of management support. Part of the unwillingness of
employees to switch from their regular activities to the wellness program may come from the
fact they fear the program will not be available for long anyway.
Watson and Gauthier (2003) go on to discuss whether work-site fitness centers are
comparable to and can compete with private fitness centers, whose prices have been decreasing.
Viewing workplace fitness centers and private fitness centers as substitutes, if all a wellness
program is doing is convincing employees to switch from paying for their own fitness center
memberships to exercising in work-site fitness centers, how could this save the company any
money? Watson and Gauthier (2003) point out that many employees who are not physically
52. 47
active at all. These employees who have not gone out and found their own physical activities
centers may exercise with this free option at the work place but still take a longer time to join.
Non-exercisers may be more likely to join once the program is well developed and supported by
management and throughout the company. In conclusion, the company needs the employees
who are already active to jump on board with a new wellness program in order to spread
promotion, support, and some social pressure for others to join. When a program is properly
implemented and fully supported by all levels of management and employees, Watson and
Gauthier (2003) suggest positive returns on investment are definitely possible.
Meta-analyses
The Effects of Wellness Programs on Absenteeism and Job Satisfaction
In a meta-analysis of seventeen studies written between 1980 and 2005 focused on how
wellness programs can affect job satisfaction and absenteeism, Parks and Steelman (2008) find
two main categories of studies: large corporate intervention studies and controlled studies. The
large corporate intervention studies involve corporations that offer comprehensive wellness
programs with the goal of decreasing medical costs and lost productivity, while closely analyzing
the success of their programs through these objectives. The controlled studies, on the other hand,
typically involve fewer than 75 workers and involve an experiment in which participants are
randomly assigned an exercise regimen and then compared across time. All of the studies
involve comparing employees who participated in a wellness program to those who had not.
There are also two main categories of wellness programs: fitness only and comprehensive.
The meta-analysis finds that those who participated in wellness programs have lower
levels of absenteeism. The type of wellness program does not significantly play a role in this
relationship. This means that participation in fitness only programs is correlated to lower
53. 48
absenteeism as is participation in comprehensive wellness programs that include health
education. The meta-analysis also finds that participation in wellness programs is linked to
higher job satisfaction. Joslin et al (2006) shows that job satisfaction is actually negatively
correlated with participation in medical offerings such as vaccines and medical screenings. That
study finds no correlation, however, between job satisfaction and the likelihood to participate in
health education offerings, which include exercise contents and Lunch and Learn sessions. This
suggests that what should be included in a wellness program will change depending on what
kinds of employees are interested in it. For a thorough analysis, the wellness program should be
studied in different categories such as fitness, education, and medical screenings, for example.
Even though a few particular studies do not show the relationship between job
satisfaction and participation in a wellness program, that is why the meta-analysis is performed:
to find an overall conclusion. Parks and Steelman (2008) are able to conclude that participation
in a wellness program is related to both higher employer satisfaction and lower rates of
absenteeism. It is, however possible, that wellness programs do not directly increase employee
satisfaction or lower absenteeism. It may be that happier, healthier employees are just more
likely to participate. Parks and Steelman suggest more methodological rigor in future studies.
Many studies simply report proportions; they need to include means, standard deviations, and
compare the characteristics between participants and non-participants.
This meta-analysis shows the potential benefits of wellness programs, but data on the
costs is not included. Parks and Steelman (2008) suggest there may be cheaper options that
would offer the same benefit: a more flexible work schedule could reduce absenteeism due to
health issues and increase employee satisfaction. As they also point out, a wellness program
more directly addresses health issues. Furthermore, they suggest that future research be more
54. 49
comprehensive and seek to answer the questions why some employees participate and others do
not. Abraham et al (2011) seems to fit that suggestion with their in depth study of what
determines employees to participate in wellness programs.
The Effects of Physical Activity Programs on Absenteeism, Job Satisfaction, Stress
and Employee Turnover
Proper et al (2002) conduct a meta-analysis of worksite physical activity programs that
evaluated the effect of work-related outcomes compared to a reference group. The analysis finds
limited evidence for decreased absenteeism among program participants. All studies but one
show that participation is related to decreased absenteeism; the other study does not show a
change. Most of these studies are of low methodological quality, so the results are likely biased.
Still Proper et al (2002) values the results from the only high-quality randomized controlled trial,
leading them to conclude there is some evidence for decreased absenteeism. They find
inconclusive evidence for the effects of participation in a worksite physical activity program on
job satisfaction due to inconsistent results. These inconsistent results are also seen in Parks and
Steelman (2008) and Joslin et al (2006). As suggested earlier, Proper et al (2002) agrees that the
inconsistency of results is due to differences in programs and how success and participation are
defined. For the same reasons, the meta-analysis finds inconclusive evidence for the effect of
participation on job stress. Measurements and definitions of job stress and job satisfaction are
both inconsistent. There is no evidence linking participation in physical activity wellness
programs and productivity. The relationship depends on whether objective or subjective
measures of productivity are used.
Only the randomized controlled trial shows participation in a physical activity program
increased perceived productivity. This trial, along with another randomized controlled trial, does
55. 50
not show a relationship between participation in physical activity programs and actual
production. Proper et al (2002) suggests that the lack of difference may be due to the fact that
actual production in these cases is determined by the machines the employees are using
regardless of how efficient they may have been. Only one study in this meta-analysis analyzes
how participation in a physical activity program affected employee turnover. While the study
shows reduced employee turnover, this is not a randomized, controlled study. Therefore, Proper
et al (2002) states there is inconclusive evidence about the relationship between participation in a
physical activity program and employee turnover. While Proper et al (2002) is not able to find
much evidence to support physical activity programs, this is mostly due to lack of good data and
good analysis. Most studies do not use randomized, controlled experiments.
Marshall (2004) performs a meta-analysis as a follow up to Proper et al (2002). Thirty-
two new papers that involve interventions with changes in physical activity as a key outcome
variable are analyzed. Marshall (2004) finds that programs often target multiple risk factors and
promote physical activities through various strategies including health checks, education
programs, motivational material, and incentive based programs. In an effort to change the
behavior of the most at-risk employees, these employees are often referred to their physician, the
onsite fitness center, or educational programs and seminars. Marshall (2004) concludes that
“none of these strategies was particularly effective at changing behavior.” Financial incentives
nor health rebates seemed to significantly affect physical activity, consistent with Cawley and
Price (2013). Many of these studies find that the participants of the education programs fitness
centers are the already active and healthy employees. Still, education programs that are based on
behavior change theories and tailored to individual needs are more effective than generic
workshops. Similarly, tailored motivational materials are more effective than the generic ones.
56. 51
Encouraging incidental activity, such as decreasing prolonged periods of sitting at work and
encouraging workers to use the stairs, have proven effective in these studies. Overall, Marshall
(2004) finds “little evidence to support the long-term effectiveness of workplace physical activity
programs” but offers advice on how to improve future endeavors and research. Although
Marshall (2004) does not find strong evidence for physical activity programs, the studies suggest
that a tailored program is more effective than generic efforts and suggests that physical activity
programs should not be viewed as short-term programs but as a part of the culture. This is the
view taken by the successful Live for Life health and wellness programs (Goetzel et al, 2002).
Marshall (2004), like Parks and Steel (2008) and Proper et al (2002) advises that future research
involve better data and analysis. Therefore, managers need to come up with better ways to
measure absenteeism and productivity in order to truly find the benefits of these programs.
Table 4.3 provides a short summary of the findings for each of the studies discussed in this report
broken down by chapter.