1. Pre-1940 Home Abatement and Elevated Blood Lead Levels
in Milwaukee, WI
Kevin M. Smith1, Robert Colla2, Lisa Lien2, Elise Papke1, Steve Gradus3, and Sanjib Bhattacharrya1,3
1 UW-Milwaukee, Joseph J. Zilber School of Public Health, 2 City of Milwaukee Health Department - Lead Abatement Program, 3 City of Milwaukee Health Department – Public Health Laboratories
ABSTRACT
• Introduction
• Healthy People2020 set the goal to eliminate childhood blood lead levels (BLLs) ≥ 10 µg/dL and disparities between
race and social class. In 2011, 0.56% of U.S. children had BLLs ≥ 10 µg/dL. From 1996 to 2011, the City of
Milwaukee Lead Primary Prevention Program reduced these rates from 33.18% to 3.45%, however, Milwaukee
contains relatively high prevalence rates.
• Objectives
• We evaluated the influence of housing and community characteristics on prevalence of elevated BLLs and their
effect on successes of Milwaukee lead abatement between 1996 - 2011.
• Method
• City of Milwaukee Health Department Lead Safe Registry, Systematic Tracking of Elevated Lead Levels and
Remediation (STELLAR) and Master Property Records were used to correlate year of construction, owner versus
renter occupancy and history of home lead abatement with prevalence of elevated BLLs was conducted. Spatial
analyses were performed using Geographical Information System (GIS) software.
• Results
• Correlations were revealed among prevalence of elevated BLLs and year of construction (RR = 5.83, 95% CI = 5.57 –
6.11) renter occupancy (RR = 2.01, 95% CI = 1.96 – 2.08) and decrease correlation between elevated BLLs and
history of abatement was found (RR = 0.69, 95% CI = 0.66 – 0.73). Number of units abated was also inversely
correlated with prevalence of elevated BLLs with a negative exponential relationship between prevalence and
number of units abated.
• Conclusion
• Housing and community characteristics are correlated with prevalence of elevated BLLs and reductions of elevated
BLLs. An inverse relationship between number of units abated and prevalence of elevated BLLs was found that was
affected by housing characteristics. We propose future lead abatement programs consider these characteristics.
INTRODUCTION & OBJECTIVES
• Approximately 535,000 children living in the United States have blood lead levels (BLLs) 5 ≥μg/dL; a level deemed
unsafe for children (CDC, 2014).
• The most common sources of lead exposure are lead based paint and contaminated soil near homes and high
traffic road ways (U.S. Department of Housing and Urban Development, 2010).
• Estimates of 37.1 million homes in the United States contain lead based paint (HUD, 2010).
• Nearly 5.7 million homes with children under the age of 6 years old have lead based paint (HUD, 2010).
• The greatest risk factor for lead paint exposure is the Year of Construction of a home
• Children 6 years old and younger are at the highest risk for lead poisoning
• Populations of low household income, minority races have the highest rates of lead poisoning
• In the City of Milwaukee, lead poisoning rates have declined from 31.9% to 3.2% of all children under 6 years old
between 1996 - 2011.
• In the City of Milwaukee, 16,885 housing units have been abated between 1997 – 2011.
• Objectives: Identify the level of hazard posed by pre-1940 housing, non-owner occupancy and
risk reduction following home lead abatement efforts in the City of Milwaukee, WI.
METHODS
• Using data sets from STELLAR, City of Milwaukee Lead Safe Housing Registry (LSHR) and
Milwaukee Master Property Records (MPROP) 186,167 children were assessed for elevated BLLs
(≥ 10 μg/dL). Children were dichotomized into case and no-case groups with 22,769
and 163,398 individuals in each group respectively. Dates from first confirmed
elevated (or non-confirmed) tests were used to identify the addresses of the homes
children were living in at the time of the test. The address was joined with MPROP
data and the LSHR data sets to identify the year of construction and owner vs. non-
owner occupancy, and the date of lead abatement if any. Homes were grouped into
pre-1940 homes and post-1940 homes. The relative risk for lead poisoning was
calculated for each of these three variables over the complete 15 year period (1996-
2011) and for annual estimates of relative risk. Annual RR was plotted in Excel for
each year. Geographical Information Software was used to create spatial
representations of the Year of Construction for the homes, history of lead poisonings
at each home and a history lead abatement.
• Annual Incidences of Lead Poisoning were
highest during the summer months (Figure
1. Seasonal Variation in Lead Poisoning
Incidences 1996-2011)
• Seasonal Variation in Lead Poisoning
Incidence has been observed in the
literature and is likely caused by opening
windows due to the warm summer months
and increased outdoor activities.
• The severity of annual incidences declined
between 1996 and 2011 and the seasonal
variation was largely reduced overall.
• Type a caption for the data content or pictures here.
RESULTS
• Result 1
• Result 2
• Result 3
RESULTS
CONCLUSIONS
• Our investigation confirms the increased risk for lead poisoning associated with Pre-1940s Homes, Non-
owner occupied units and the decreased risk of lead poisoning following Lead Abatement (15 yr
Aggregate Relative Risks).
• Interestingly, Lead Abatement efforts seem indicate a short term increase in the risk for lead poisoning –
however a number of counfounding variables may be present and requires further investigation. In the
City of Milwaukee, lead abatements are addressed in two ways:
• Base–line: Abatement of the home following potential for a child to have lead poisoning.
• Primary Prevention: Abatement of the home at owner’s request without suspicion of lead poisoning,
• Annual risk following lead abatement may be an indication of children that were confirmed to be lead
poisoning after a Base-line abatement. After 9 months from abatement risk begins to decline (data not
shown) and this may suggest that these homes were abated after the child was lead poisoned. This
likely explains why the 15 yr Aggregate Risk is reduced following lead abatement, but not the annual
incidences.
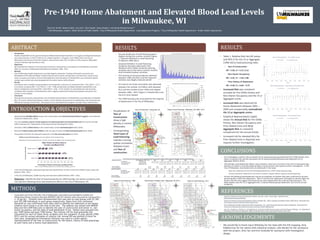
Year of Construction, Owner Occupancy and Prior Abatement Relative Risk Calculations with 95% Confidence Intervals for Aggregate and Annual Lead Poisoning Rates
Relative Risk (95% CI) 15 year Aggregate (1996 - 2011) 1996 1997 1998 1999 2000 2001 2002
Pre-1940 Unit 5.83 (5.57, 6.11) 3.64 (3.32, 3.98) 3.79 (3.42, 4.20) 5.68 (4.78, 6.75) 4.77 (4.04, 5.63) 4.55 (3.87, 5.36) 5.45 (4.51, 6.59) 5.43 (4.45, 6.64)
Non-Owner Occupied 2.01 (1.96, 2.08) 1.73 (1.65, 1.84) 1.76 (1.65, 1.88) 1.89 (1.71, 2.10) 1.85 (1.67, 2.05) 1.64 (1.47, 1.82) 1.77 (1.58, 1.99) 1.77 (1.57, 2.01)
Prior Abatement 0.6908 (0.66, 0.73) 1.01 (0.45, 2.25) 0.92 (0.60, 1.41) 1.06 (0.77, 1.47) 0.8792 (0.68, 1.13) 1.24 (1.04, 1.48) 1.58 (1.35, 1.85)
Case (≥ 10 μg/dL) 22769 5816 3696 1725 1657 1438 1396 1269
No Case (≤ 10 μg/dL) 163398 13709 11352 9534 7373 8123 9364 9908
0
2000
4000
6000
8000
10000
12000
14000
16000
18000
0
1,000
2,000
3,000
4,000
5,000
6,000
7,000
8,000
NumberofUnitsAbated
ChildrenwithElevatedBloodLead
Elevated Blood Lead Levels and # of Units Abated
Pre-1940 Units Abated Total Units Abated Prevalance
Relative Risk (95% CI) 2003 2004 2005 2006 2007 2008 2009 2010 2011
Pre-1940 Unit 7.06 (5.51, 9.05) 8.22 (6.32, 10.69) 5.70 (4.48, 7.25) 7.47 (5.43, 10.26) 5.86 (4.37, 7.86) 8.32 (5.81, 11.92) 8.33 (5.81, 11.95) 5.98 (4.32, 8.29) 5.66 (4.01, 7.98)
Non-Owner Occupied 1.70 (1.48, 1.95) 2.02 (1.75, 2.24) 1.76 (1.51, 2.05) 1.85 (1.53, 2.23) 2.25 (1.85, 2.74) 1.56 (1.28, 1.91) 1.86 (1.49, 2.31) 1.57 (1.23, 1.99) 2.05 (1.56, 2.70)
Prior Abatement 1.89 (1.63, 2.19) 1.69 (1.44, 1.99) 1.59 (1.35, 1.87) 1.42 (1.15, 1.75) 1.22 (0.99, 1.51) 1.18 (0.95, 1.47) 1.08 (0.85, 1.37) 0.83 (0.63, 1.10) 1.21 (0.93, 1.55)
Case (≥ 10 μg/dL) 1046 936 838 589 600 520 461 401 381
No Case (≤ 10 μg/dL) 9514 9939 9296 8968 10296 10598 11122 12680 11622
• An inverse non-linear association was observed
between the number of children with elevated
BLLs and the number of pre-1940 units abated
between 1996 – 2011 (Figure 2. Elevated BLLs and
the # of Units Abated
• Pre-1940 housing units accounted for the majority
of abatements in the City of Milwaukee.
• Visualization of
Year of
Construction
show a high
density in central
Milwaukee.
• Corresponding
Total Cases of
Lead Poisoning
indicate a strong
spatial correlation
between Cases
and Year of
construction.
0
2
4
6
8
10
12
14
1994 1996 1998 2000 2002 2004 2006 2008 2010 2012
RelativeRiskRatio
Year
Risk of Elevated BLLs - Pre-1940s Homes
Annual Risk 15 yr Aggregate Risk
REFERENCES
AKNOWLEDGEMENTS
• Center for Disease Control and Prevention (2014, June 19). Lead – Home Page. Retrieved from:
http://www.cdc.gov/nceh/lead/
• Center for Disease Control and Prevention (2014, October 30). LCDC’s national Surveillance Data (1997-2013). Retrieved from:
http://www.cdc.gov/nceh/lead/data/national.htm
• City of Milwaukee Health Department (2014, September, 12). Lead Poisoning Prevention Data and Reports. Received from:
http://city.milwaukee.gov/Lead-Poisoning-Prevention-Data#.VI88wqecteU
• Cox, D.C., Dewalt, G., O’Haver, R., and Salatino, B. American Health Homes Survey; Lead and Arsenic Findings. U.S. Department
of Housing and Urban Development: Office of Healthy Homes and Lead Hazard Control, April, 2011.
• We would like to thank Joyce Witebsky for her help with the GIS mapping, Amy
Kalkbrenner for her advice with statistical analysis, Julie Becker for her assistance
with the project, Alice Yan and Kurt Svoboda for assistance with investigation
design.
0
0.5
1
1.5
2
2.5
1994 1996 1998 2000 2002 2004 2006 2008 2010 2012
RelativeRiskRatio
Year
Risk of Elevated BLLs - Prior Abated Units
Annual Risk 15 yr Aggregate Risk
0
0.5
1
1.5
2
2.5
3
1994 1996 1998 2000 2002 2004 2006 2008 2010 2012
RelativeRiskRatio
Year
Risk of Elevated BLLs - Non-Owner Occupied Units
Annual Risk 15 yr Aggregate Risk
• Table 1. Relative Risk lists RR values
and 95% CI for the 15 yr Aggregate
(1996-2011) lead poisoning rates.
• Year of Construction:
RR = 5.83, CI = 5.57, 6.13
• Non-Owner Occupancy:
RR = 2.01, CI – 1.96, 2.08
• Prior History of Abatement:
RR = 0.69, CI = 0.66 – 0.73
• Increased Risk was consistent
annually for Pre-1940s Homes and
Non-Owner Occupancy and the 15 yr
Aggregate scores
• Increased Risk was observed for
Home Abatement between 2001 –
2004 and unexpectedly contradicted
the 15 yr Aggregate scores.
• Graphical Representation (right)
shows the Annual Risk for Pre-1940s
Homes, Non-Owner Occupancy and
Prior Abated Units and 15 yr
Aggregate Risk as a baseline
comparison for the annual trends.
• Increased risk for elevated BLLs for
Prior Abated Units in depicted and
requires further investigation.