Autism spectrum disorder symptomology and resting state alpha-band power
1. • Autism Spectrum Disorder (ASD) is characterized
by a range of neurodevelopmental disorders that
manifest as specific deficits in cognition, learning
and behavior, while sometimes conversely
coexisting with advantages in the areas of
computation and memory. The high variability of
genetic and behavioral phenotypes in ASD make it
difficult to study and challenging to develop strict
symptomology
• Research on the electrophysiology of ASD shows
that specific power spectrum specific differences
in resting state alpha power (8-13 Hz) might exist
in individuals with ASD (Figure 1, Wang, 2013);
providing a useful tool for early detection and
diagnosis of ASD.
• This pattern of results has been inconsistent
across studies due possible to a lack of electrode
density, difference in age, and insufficient
statistical power.
• To test the hypothesis, we rectify these
inconsistencies and explore differences in resting
state alpha-band power using a high density
electrode array (128 channels) in adolescent aged
groups of typical developing (TD) and ASD
patients.
• Coming to a null hypothesis (disruptions in alpha-
power does not contribute to the symptomology of
ASD), we used Bayesian inference to suggest that
the null hypothesis is on average 3 times more
likely to account for the data than the hypothesis
of a significant difference in alpha power between
ASD and typically developing individuals
Introduction Background Results
EEG data was recorded using a high density electrode array
(128 channels, figure 2) in adolescent aged groups of TD (17
participants) and ASD (29 participants).
Discussion
Power abnormality inconsistencies
Autism spectrum disorder symptomology and resting state
alpha-band power
Kenneth Rauen, Jesse Bengson
Sonoma State University Department of Psychology
Fig. 3 Individual Channel Means. Compared mean power
density for each channel for both TD and ASD groups. Note:
remarkably consistent similarity across ASD and typical
developing at all electrodes. Some outliers, but none significant.
(Slides for channels 63-84, 105-128 arbitrarily omitted)
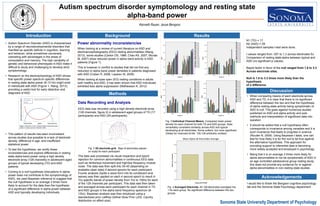
Fig. 4 Averaged Electrode. All 128 electrodes averaged into
1 for each group. No significant difference between the two
groups
Fig. 2 3D electrode grid. Map of electrodes placed
on scalp for each participant
Methods
When looking at a review of current literature on ASD and
electroencephalography (EEG) resting abnormalities (Wang,
2013), some studies (Cantor DS, 1986, Chan AS, 2007, Murias
M, 2007) show reduced power in alpha band activity in ASD
patients (Figure 1).
This is however in conflict to studies that did not find any
reduction in alpha band power densities in patients diagnosed
with ASD (Coben R, 2008, Lazarev W, 2009)
When looking at eyes open (EO) resting conditions in adults
both healthy and ASD, it has been shown that ASD individuals
exhibited less alpha suppression (Mathewson K, 2012)
Data Recording and Analysis
The data was processed via visual inspection and epoch
rejection for common abnormalities in continuous EEG data
such as blinks/eye movement and high/low frequency muscle
noise. The data was then split into 30-40 (depending on
available clean data) 4 second epochs for each participant.
Fourier analysis (Splits a wave form into its constituent sine
waves) was then applied on each 4 second epoch to result in
1hz specific bands of power density from 1hz to 100hz for each
of the 128 channels per participant. This data was then taken
and averaged across each participant for each channel in TD
and ASD groups in the alpha band frequency spectrum (8-
13hz). Bayesian analysis was then employed using a
standardized prior (Jeffrey-Zellner-Siow Prior (JZS, Cauchy
distribution on effect size).
Mean Alpha All Electrodes Average
N1 (TD) = 17
N2 (ASD) = 29
Independent samples t-test were done.
t values ranged from .007 to 1.3 across electrodes for
Comparison of resting state alpha between typical and
ASD (no significant p-values).
Bayes factor in favor of the null ranged from 1.8 to 3.3
Across electrode sites.
Null is 1.8 to 3.3 times more likely than the
hypothesis
of a difference.
• When comparing means of each electrode across
ASD and TD, it is clear that there is no significant
difference between the two and that the hypothesis
of alpha resting-state activity being symptomatic of
ASD is null. This goes against numerous studies
published on ASD and alpha activity and puts
methods and interpretation of significant data into
question.
• It should be added that a null hypothesis often
corresponds to invariance among variables and it is
such invariance that leads to progress in science
(Rouder N, 2009). Using Bayesian t tests, one can
test for how likely it is for the null to be true against
the alternative hypothesis. This approach for
providing support to inferential data is becoming
more widely accepted and employed in psychology
• Being that it is on average 3 times more likely for
alpha abnormalities to not be symptomatic of ASD in
an age controlled adolescence group resting study,
this does not provide any evidence for or against
alpha abnormalities in non-resting state studies.
I would like to thank the Bengson cognitive psychology
lab and the Sonoma State Psychology department
Acknowledgements