More Related Content Similar to AssessmentReportDayWithOurStudents-SimpleSixData2015 Similar to AssessmentReportDayWithOurStudents-SimpleSixData2015 (10) More from Kenneth Olden (6) 1.
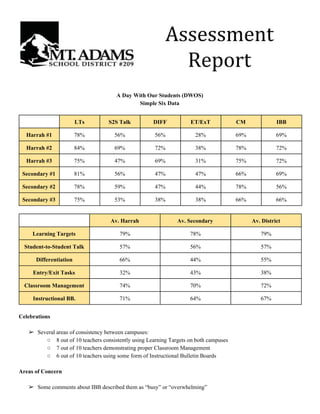
A Day With Our Students (DWOS)
Simple Six Data
LTs S2S Talk DIFF ET/ExT CM IBB
Harrah #1 78% 56% 56% 28% 69% 69%
Harrah #2 84% 69% 72% 38% 78% 72%
Harrah #3 75% 47% 69% 31% 75% 72%
Secondary #1 81% 56% 47% 47% 66% 69%
Secondary #2 78% 59% 47% 44% 78% 56%
Secondary #3 75% 53% 38% 38% 66% 66%
Av. Harrah Av. Secondary Av. District
Learning Targets 79% 78% 79%
StudenttoStudent Talk 57% 56% 57%
Differentiation 66% 44% 55%
Entry/Exit Tasks 32% 43% 38%
Classroom Management 74% 70% 72%
Instructional BB. 71% 64% 67%
Celebrations
➢ Several areas of consistency between campuses:
○ 8 out of 10 teachers consistently using Learning Targets on both campuses
○ 7 out of 10 teachers demonstrating proper Classroom Management
○ 6 out of 10 teachers using some form of Instructional Bulletin Boards
Areas of Concern
➢ Some comments about IBB described them as “busy” or “overwhelming”
3. Looking at the comparison data, it appears that if the No Data indicators are assumed to be either a No or the total number
of No Data indicators are split 50/50 between Yes/No, the overall walkthrough data (n=274) seems to very closely match
the “Day With Our Students” data (n=32). Assuming they are a Yes provides us with similar data for Learning Targets
and StudenttoStudent Talk and higher rates of observed behavior for Differentiation and Entry/Exit Tasks. However, it
seems unlikely that the observation team (building administrators, district administrators, and coaches) would have not
marked clear evidence of those practices on the observation form. Therefore, it is unlikely that the No Data indicators
represent a Yes beyond a few random occurrences.
It is therefore unlikely these results are a fluke, are coincidental, or are the product of insufficient observed data. It is
possible that the higher rates of Differentiation and StudenttoStudent Talk on DWOS are the result of the teachers
knowing they would be observed by outside parties (Reactivity/Observer Effect). It is also possible that those higher
numbers may also be the result of improved implementation of Simple Six.
Monthly trend data may reveal which is the case:
StudenttoStudent Talk Av. Observed Data Av. Observed+DWOS Data
September 39% 39%
October 41% 41%
November 45% 57%
December (Predicted) 48% 61%
January (Predicted) 51% 69%
February (Predicted) 54% 77%
Using average observation data from September to November for StudenttoStudent Talk, we can predict a possible
observation rate of 48% for December, slightly higher than the yeartodate average of 43%. Using the DWOS data in
place of the observed data for November, we get a predicted rate of 61% for December. The actual observed rate for
December was 65% over the course of 20 observations. If further observations in January reveal a rate around 50%, it
is possible that both the DWOS and the higher December rates are a fluke (due to small n), while a rate around 70% may
reveal an increasing trend due to improved Simple Six implementation.
Replicating this process for the other main components of Simple Six reveals similar predictive trends. Learning Target
and StudenttoStudent Talk observed rates track fairly close to the DWOS data predicted trend. The observed data for
Differentiated Instruction is much higher than predicted and the observed data for Entry/Exit Tasks is substantially lower.
Additional walkthrough data in January with a sufficiently high n should help determine which predictive data set is
accurate.
The following table has the complete trend predictions using the SeptemberNovember observation data, the DWOS data
in place of the November data, and the actual December results with possible JanuaryFebruary resulting trends: