City of Bellevue Past Recycling Collection Events Memo
1. MEMORANDUM
To: Stephanie Schwenger
From: Ken Mullins & Emma Hewitt
Date: August 31, 2015
Re: Past Recycling Collection Events
______________________________________________________________________________
This report analyzes the City of Bellevue’s Spring & Fall Recycling Collection Event (RCE)
from 2000 until 2014. The RCEs allow Bellevue residents to dispose of items such as televisions,
computers, electronic equipment, appliances, scrap metal, auto batteries, porcelain sinks and
toilets, tires and mattresses. However, hazardous waste such as motor oil, antifreeze, paint and
pesticides are not collected at this time. Currently, the RCEs are operated and managed by Paul
Devine, a private contractor who also works with the cities of Sammamish and Mercer Island.
The analysis and recommendations provided are intended to help the City of Bellevue determine
whether they should continue participating in the RCEs or consider alternate options.
ANALYSIS OF RECYCLING COLLECTION DAY TRENDS
Our analysis first examines individual trends for total cost, total tonnage and total number of
vehicles calculated and collected at each RCE. We then examine these trends collectively to
determine any similar tendencies and patterns and to compare factors that have remained
consistent with those that have changed. This side-by-side comparison brings to light several
noteworthy observations, particularly regarding the cost of the events and the number of tons of
recyclable materials collected at each event.
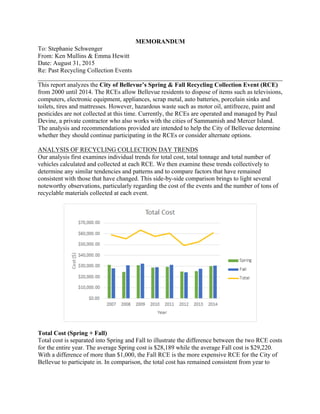
Total Cost (Spring + Fall)
Total cost is separated into Spring and Fall to illustrate the difference between the two RCE costs
for the entire year. The average Spring cost is $28,189 while the average Fall cost is $29,220.
With a difference of more than $1,000, the Fall RCE is the more expensive RCE for the City of
Bellevue to participate in. In comparison, the total cost has remained consistent from year to
2. year, averaging $57,409/year since 2007. However, this is well above the city’s targeted RCE
budget of $45,000/year.
Total Cost (Vendor + Additional)
Total cost is separated into vendor and additional costs. Vendor costs include the costs for
appliances/scrap metal, battery recycling, paper shredding, temporary helpers, event supplies,
flyer printing, flyer sorting, rentals, lunch, mileage, management/staff time and HH battery
recycling, bulky wood recycling and mattress recycling fees. Additional costs are paid for by the
City of Bellevue Utilities Department and include multifamily brochure printing, flyer postage,
crowd/traffic control and temporary use permit fees.
The average vendor cost is $39,884/year while the average additional cost is only $17,524/year.
However, additional costs increased from $12,989 in 2012 to $22,344 in 2014 (+ 72%). This
increase can be most attributed to the cost of multifamily brochure printing. In 2014, multifamily
brochure printing cost $1,368.75 for the Spring RCE and $1,200 for the Fall RCE. Notably,
participation in the event, measured by the number of vehicles present, decreased despite this
increased advertising.
3. Total Tonnage
Since 2008, total tonnage collected has steadily decreased, with the biggest decrease occurring
from 2008 to 2009. During that year, total tonnage collected decreased from 200.47 tons in 2008
to 139.61 tons in 2009 (-30%). This can be partially attributed to a change in accepted
materials. Until 2008, Bellevue accepted an extensive list of household recyclables, including
newspaper, cardboard, mixed paper, tin cans, glass bottles, #1 and #2 plastics, #6 plastics,
polycoated paperboard, and aluminum cans. From 2008 onward, this list of accepted household
recyclables was reduced to only cardboard and #6 plastics. This caused the number of tons of
household recyclables collected to drop from an average of 2.55 tons between 2001 and and
2009 to an average of only .89 tons from 2008 to 2015 (-65%). Bellevue also stopped accepting
tires at their recycling events in the Fall of 2007 and #7 plant containers in 2009. Number 7 plant
containers accounted for an average of 1.75 tons/event, and tires accounted for an average of
3.87 tons/event. There was also a significant drops in tonnage of television sets collected in 2008
(13.56 tons) versus 2009 (3.51 tons).
4. Total Number of Vehicles
Between 2000 and 2009, an average of 2,996 vehicles/year attended the RCEs (with Spring and
Fall averaging 1,417 and 1,579 vehicles/year, respectively). However, since 2009 the total
number of vehicles has steadily decreased, averaging only 2,481 vehicles/year. This drop is seen
by the decrease of vehicles/year attending the Spring RCE. The Spring RCE decreased to only
973 vehicles/year (-31%), while Fall decreased only to 1,508 (-4%). The biggest gap between
Spring and Fall attendance occurred in 2011, when only 945 vehicles attended the Spring RCE
while 2,036 attended the Fall RCE (a difference 1,091 vehicles). This is consistent with our
findings regarding tonnage. It appears that 2008 marked the beginning of a steady decrease in
event participation and tons of materials collected.
5. Tonnage & Total Cost
The relationship between tonnage and total cost displays the most drastic comparison for the City
of Bellevue when considering whether to continue participating in the Spring and Fall RCEs.
While total cost has remained consistent since 2007 (averaging $57,409/year), tonnage collected
has rapidly decreased. Since 2007, tonnage collected decreased from 199.59 tons to 103.52 tons
in 2014 (-48%), meaning that significantly fewer tons of recyclables are being collected for
roughly the same price.
6. Number of Vehicles & Total Cost
The relationship between the number of vehicles and the total cost demonstrates that the decrease
in total tonnage cannot be fully attributed to participants bringing in fewer or lighter items. The
number of vehicles attending RCEs has decreased from 3,324 vehicles in 2007 to 2,214 in 2014
(-33%). This decrease may suggest that more participants are taking their challenging recyclable
items to other drop-off locations, such as the Factoria Transfer Station and Bartell Drugstore.
Additionally, more items, such as household batteries and fluorescent light bulbs, can now be
collected through curbside pickup, eliminating the need for them to be dropped off at a RCE. As
participation in RCEs decreases, and total costs remains relatively constant, it becomes
increasingly important to evaluate the usefulness of the RCEs.
Tonnage & Number of Vehicles
When examining the relationship between tonnage collected and the number of vehicles, a direct
relationship becomes apparent. Fewer participants are attending the RCEs, which leads to a
decrease in total tonnage collected. As the chart demonstrates, tonnage began to decrease slightly
faster than number of vehicles after 2008.
7. Tonnage & Number of Items
This chart compares the tonnage of collected items at each event with the number of items
collected. Notably, the decrease in items collected (-34% from 2000 to 2014) is less significant
than the decrease in tonnage (-48% from 2000 to 2014). This indicates that the drop in tonnage
can be at least partially attributed to participants bringing in lighter items, rather than participants
bringing in fewer items. This pattern is most apparent between 2000 and 2008. After 2008,
however, tonnage and number of items begin to mirror each other more closely, meaning that
they are decreasing at roughly the same pace, and the drop in tonnage is likely due to participants
bringing in fewer items.
COMPARISONS TO KIRKLAND’S RCEs
Compared to Kirkland’s RCEs, Bellevue’s RCEs are less expensive, where both cost per ton and
cost per participant are lower than Kirkland, while total tonnage collected per year is higher.
Kirkland Bellevue % Difference
Event Cost (since 2008) $479,429.49 $400,035.88 -16%
Cost/Ton $470.99 $409.37 -13%
Cost/Participant $25.56 $20.39 -20%
Total Tonnage/Year 103.5 156.16 51%
8. Total Tonnage
Total Tonnage
When comparing the two RCEs trends graphically, we see opposite patterns. In contrast to
Bellevue, Kirkland is actually experiencing an increase in the total tonnage collected and total
number of vehicles attending their RCEs.
9. Number of Vehicles
Number of Vehicles
RECOMMENDATION
To efficiently use the City of Bellevue’s Utilities budget, we recommend researching the
possibility of operating the RCEs without a private vendor. Vendor costs account for over
69% of the total cost to operate an RCE, with the city spending an average of $40,553/year
10. (more than 90% of the target RCE budget of $45,000/year) on vendors. Operating their own
RCE allows the city to control and monitor vendor costs and ensures that the budget actually
reflects the services provided. Federal Way, Redmond and Renton all coordinate their own
recycling events and provide examples and guidelines for how to operate a separate RCE and the
associated costs.
If the city continues its current participation in the Spring and Fall RCEs, we suggest
determining a cut-off threshold for total cost, total tonnage, and total number of vehicles
attending. This cut-off allows the city to assess each RCEs performance and determine when
participation in the RCEs becomes inefficient.
CONCLUSIONS
While the Bellevue Recycling Collection Events have decreased in popularity since the early
2000s, they are still a convenient and well-utilized option for recycling difficult items. However,
as alternative recycling options become increasingly available, it is important for the city to
regularly evaluate the necessity of these events. If a portion of the RCE budget were spent on
increased outreach to educate residents on other recycling drop-off locations, the Bellevue
Spring and Fall RCE could potentially be canceled in the future, saving the city thousands of
dollars each year.