SlideShare a Scribd company logo
1 of 11
Download to read offline
NYSE: WMT May 16, 2019 stock.walmart.com
Walmart U.S. Q1 comp sales1
grew 3.4% and Walmart U.S. eCommerce sales grew 37%,
Company reports Q1 FY'20 GAAP EPS of $1.33; Adjusted EPS2
of $1.13, led by strength at Walmart U.S.
Total revenue was $123.9 billion, an increase of $1.2
billion, or 1.0%. Excluding currency2
, total revenue
was $125.8 billion, an increase of $3.1 billion, or 2.5%.
"We're changing to enable more innovation, speed
and productivity, and we're seeing it in our results.
We're especially pleased with the combination of
comparable sales growth from stores and
eCommerce in the U.S. Our team is demonstrating
an ability to serve customers today while building
new capabilities for the future, and I want to thank
them for a strong start to the year."
Doug McMillon
President and CEO, Walmart
Walmart U.S. comp sales of 3.4% marks the best Q1
comp in 9 years and is the fourth consecutive quarter
above 3%. Operating income was better than
expected, up 5.5%.
Walmart U.S. eCommerce sales growth of 37%
reflects strong growth in online grocery, as well as the
Home and Fashion categories on Walmart.com.
Sam's Club comp sales1
increased 0.3%, and eCommerce sales grew about 28%. Reduced tobacco sales
negatively affected comp sales by 270 basis points.
Net sales at Walmart International were $28.8 billion, a decline of 4.9%. Excluding currency2
, net sales were
$30.6 billion, an increase of 1.2%.
Operating income declined 4.1%, or 3.0% in constant currency2
, which was better than planned as strong
results from Walmart U.S. and Sam's Club were offset by the inclusion of Flipkart this year.
Adjusted EPS2
excludes an unrealized gain, net of tax, of $0.20 on the company's equity investment in JD.com.
Key results
(Amounts in billions, except as noted. Dollar and percentage changes may not recalculate due to rounding.)
Q1 FY20 Q1 FY19 Change
Revenue $123.9 $122.7 $1.2 1.0%
Revenue (constant currency)2
$125.8 $122.7 $3.1 2.5%
Operating income $4.9 $5.2 -$0.2 -4.1%
Operating income (constant currency)2
$5.0 $5.2 -$0.2 -3.0%
Free Cash Flow2
Q1 FY20 $ Change Returns to Shareholders Q1 FY20 % Change
Operating cash flow $3.6 -$1.6 Dividends $1.5 -0.8%
Capital expenditures $2.2 $0.4 Share repurchases3
$2.1 296.1%
Free cash flow2
$1.4 -$2.0 Total $3.7 76.4%
1
13-week period ended April 26, 2019 compared to 13-week period ended April 27, 2018, and excludes fuel. See Supplemental Financial Information for
additional information.
2
See additional information at the end of this release regarding non-GAAP financial measures.
3
$9.2 billion remaining of $20 billion authorization approved in October 2017. The company repurchased approximately 22 million shares in the first quarter
of fiscal 2020.
2
NYSE: WMT May 16, 2019 stock.walmart.com
Segment results
(Amounts in billions, except as noted. Dollar and percentage changes may not recalculate due to rounding.)
U.S.
Q1 FY20 Q1 FY19 Change
Net sales $80.3 $77.7 $2.6 3.3%
Comp sales (ex. fuel)1
3.4% 2.1% 130 bps N/A
Transactions2
1.1% 1.4% -30 bps N/A
Ticket2
2.3% 0.7% 160 bps N/A
eCommerce ~140 bps ~100 bps ~40 bps N/A
Operating income $4.1 $3.9 $0.2 5.5%
Q1 FY20 Q1 FY19 Change
Net sales $28.8 $30.3 -$1.5 -4.9%
Net sales (constant currency)3
$30.6 $30.3 $0.4 1.2%
Operating income $0.7 $1.3 -$0.5 -41.7%
Operating income (constant currency)3
$0.8 $1.3 -$0.5 -37.5%
Q1 FY20 Q1 FY19 Change
Net sales $13.8 $13.6 $0.2 1.5%
Comp sales (ex. fuel)1
0.3% 3.8% -350 bps N/A
Transactions 4.7% 5.6% -90 bps N/A
Ticket -4.4% -1.8% -260 bps N/A
eCommerce ~140 bps ~100 bps ~40 bps N/A
Operating income $0.5 $0.3 $0.1 38.8%
1
13-week period ended April 26, 2019 compared to 13-week period ended April 27, 2018, and excludes fuel. See Supplemental Financial Information for
additional information.
2
In the first quarter of FY20, we updated our definition of traffic as a component of comparable sales to be all sales transactions in our stores as well as for
eCommerce. Traffic will now be called transactions. For comparability, we revised this metric for FY19 and have provided a quarterly summary on our
website at http://www.stock.walmart.com.
3
See additional information at the end of this release regarding non-GAAP financial measures.
3
NYSE: WMT May 16, 2019 stock.walmart.com
Additional highlights for the first quarter
• Introduced increased rewards and protected PTO for U.S. associates
• Launched free NextDay delivery from Walmart.com with plans to reach 75% of U.S. population by year's end
• Introduced Walmart Voice Order, initially through the Google Assistant, to make basket building for online
grocery orders even easier
• Launched new personalized baby registry on Walmart.com
• Introduced first online pet pharmacy, Walmartpetrx.com
• Announced participation in the USDA's SNAP online purchasing pilot
• Announced partnership with Affirm to allow customers to make purchases and pay over time at Walmart
stores and online
• Launched exclusive line of denim on Walmart.com with Sofia Vergara
• Launched exclusive MoDRN brand in the Home category
• Launched exclusive Hello Bello brand in the Baby category with Kristen Bell and Dax Shepard
• Launched exclusive Flower brand in the Home category on Walmart.com with Drew Barrymore
• Launched Evolution_18, a health & wellness line from Bobbi Brown, in stores and online
• Announced partnership with KIDBOX to deliver personalized kids fashion through Walmart.com
• Announced the creation of a new Angus beef supply chain to service 500 U.S. stores
• Launched new Intelligent Retail Lab in a live shopping environment to help unlock the possibilities of Artificial
Intelligence
• Acquired natural language processing startup, Aspectiva
• Acquired assets of Polymorph Labs to expand in-house advertising technology
• Announced the launch of PhonePe as a payment option at Walmart's "B2B Cash & Carry" stores in India
• Opened next generation Sam's Club in Shanghai
• Launched a Super App solution with PhonePe in India
• Launched Flipkart venture capital fund
• Launched new reusable shopping bag campaign in U.S. stores
• Announced new plastic packaging waste reduction commitments
About Walmart
Walmart Inc. (NYSE: WMT) helps people around the world save money and live better - anytime and anywhere - in
retail stores, online, and through their mobile devices. Each week, over 275 million customers and members visit
our more than 11,300 stores under 58 banners in 27 countries and eCommerce websites. With fiscal year 2019
revenue of $514.4 billion, Walmart employs over 2.2 million associates worldwide. Walmart continues to be a
leader in sustainability, corporate philanthropy and employment opportunity. Additional information about
Walmart can be found by visiting http://corporate.walmart.com, on Facebook at http://facebook.com/walmart
and on Twitter at http://twitter.com/walmart.
Investor Relations contact
Dan Binder (479) 258-7172
Media Relations contact
Randy Hargrove (800) 331-0085
4
Walmart Inc.
Condensed Consolidated Statements of Income
(Unaudited)
Three Months Ended
April 30,
(Amounts in millions, except per share data) 2019 2018
Percent
Change
Revenues:
Net sales $122,949 $121,630 1.1 %
Membership and other income 976 1,060 (7.9)%
Total revenues 123,925 122,690 1.0 %
Costs and expenses:
Cost of sales 93,034 91,707 1.4 %
Operating, selling, general and administrative expenses 25,946 25,829 0.5 %
Operating income 4,945 5,154 (4.1)%
Interest:
Debt 588 437 34.6 %
Finance, capital lease and financing obligations 85 93 (8.6)%
Interest income (48) (43) 11.6 %
Interest, net 625 487 28.3 %
Other (gains) and losses (837) 1,845 (145.4)%
Income before income taxes 5,157 2,822 82.7 %
Provision for income taxes 1,251 546 129.1 %
Consolidated net income 3,906 2,276 71.6 %
Consolidated net income attributable to noncontrolling interest (64) (142) (54.9)%
Consolidated net income attributable to Walmart $ 3,842 $ 2,134 80.0 %
Net income per common share:
Basic net income per common share attributable to Walmart $ 1.34 $ 0.72 86.1 %
Diluted net income per common share attributable to Walmart $ 1.33 $ 0.72 84.7 %
Weighted-average common shares outstanding:
Basic 2,869 2,950
Diluted 2,886 2,967
Dividends declared per common share $ 2.12 $ 2.08
5
Walmart Inc.
Condensed Consolidated Balance Sheets
(Unaudited)
April 30, January 31, April 30,
(Amounts in millions) 2019 2019 2018
ASSETS
Current assets:
Cash and cash equivalents $ 9,255 $ 7,722 $ 7,885
Receivables, net 5,342 6,283 4,568
Inventories 44,751 44,269 43,303
Prepaid expenses and other 2,391 3,623 3,486
Total current assets 61,739 61,897 59,242
Property and equipment, net 104,604 104,317 107,622
Operating lease right of use assets, net 16,833 — —
Finance lease right of use assets, net 3,804 — —
Property under capital lease and financing obligations, net — 7,078 7,178
Goodwill 31,416 31,181 18,850
Other long-term assets 16,148 14,822 12,035
Total assets $ 234,544 $ 219,295 $ 204,927
LIABILITIES AND EQUITY
Current liabilities:
Short-term borrowings $ 4,828 $ 5,225 $ 7,762
Accounts payable 45,110 47,060 44,612
Dividends payable 4,551 — 4,607
Accrued liabilities 21,023 22,159 20,782
Accrued income taxes 729 428 718
Long-term debt due within one year 1,464 1,876 1,576
Operating lease obligations due within one year 1,748 — —
Finance lease obligations due within one year 435 — —
Capital leases obligations due within one year — 729 700
Total current liabilities 79,888 77,477 80,757
Long-term debt 47,425 43,520 29,477
Long-term operating lease obligations 15,719 — —
Long-term finance lease obligations 3,810 — —
Long-term obligations under capital leases — 6,683 6,828
Deferred income taxes and other 12,792 11,981 9,541
Commitments and contingencies
Equity:
Common stock 286 288 294
Capital in excess of par value 2,734 2,965 2,557
Retained earnings 76,276 80,785 82,982
Accumulated other comprehensive loss (11,091) (11,542) (10,281)
Total Walmart shareholders’ equity 68,205 72,496 75,552
Noncontrolling interest 6,705 7,138 2,772
Total equity 74,910 79,634 78,324
Total liabilities and equity $ 234,544 $ 219,295 $ 204,927
The Company adopted ASU 2016-02, Leases (Topic 842), and related amendments as of February 1, 2019 under the modified retrospective
approach and, therefore, has not revised comparative periods.
6
Walmart Inc.
Condensed Consolidated Statements of Cash Flows
(Unaudited)
Three Months Ended
April 30,
(Amounts in millions) 2019 2018
Cash flows from operating activities:
Consolidated net income $ 3,906 $ 2,276
Adjustments to reconcile consolidated net income to net cash provided by operating activities:
Depreciation and amortization 2,714 2,678
Unrealized (gains) and losses (783) 1,845
Deferred income taxes 124 (50)
Other operating activities 75 265
Changes in certain assets and liabilities, net of effects of acquisitions:
Receivables, net 970 1,134
Inventories (421) 547
Accounts payable (1,854) (1,770)
Accrued liabilities (1,514) (1,813)
Accrued income taxes 346 49
Net cash provided by operating activities 3,563 5,161
Cash flows from investing activities:
Payments for property and equipment (2,205) (1,818)
Proceeds from the disposal of property and equipment 42 198
Proceeds from disposal of certain operations 833 —
Payments for business acquisitions, net of cash acquired (56) —
Other investing activities 251 (62)
Net cash used in investing activities (1,135) (1,682)
Cash flows from financing activities:
Net change in short-term borrowings (399) 2,501
Proceeds from issuance of long-term debt 3,978 —
Repayments of long-term debt (364) (2,521)
Dividends paid (1,520) (1,533)
Purchase of Company stock (2,135) (539)
Dividends paid to noncontrolling interest (96) (66)
Other financing activities (310) (328)
Net cash used in financing activities (846) (2,486)
Effect of exchange rates on cash, cash equivalents and restricted cash (46) 143
Net increase (decrease) in cash, cash equivalents and restricted cash 1,536 1,136
Cash, cash equivalents and restricted cash at beginning of year 7,756 7,014
Cash, cash equivalents and restricted cash at end of period $ 9,292 $ 8,150
7
Walmart Inc.
Supplemental Financial Information
(Unaudited)
Net sales and operating income
Net Sales Operating Income
Three Months Ended Three Months Ended
April 30, April 30,
(dollars in millions) 2019 2018
Percent
Change 2019 2018
Percent
Change
Walmart U.S. $ 80,344 $ 77,748 3.3% $ 4,142 $ 3,927 5.5%
Walmart International 28,775 30,260 -4.9% 738 1,265 -41.7%
Sam's Club 13,830 13,622 1.5% 451 325 38.8%
Corporate and support — — N/A (386) (363) 6.3%
Consolidated $ 122,949 $ 121,630 1.1% $ 4,945 $ 5,154 -4.1%
U.S. comparable sales results
With Fuel Without Fuel Fuel Impact
13 Weeks Ended 13 Weeks Ended 13 Weeks Ended
4/26/2019 4/27/2018 4/26/2019 4/27/2018 4/26/2019 4/27/2018
Walmart U.S. 3.4% 2.2% 3.4% 2.1% 0.0% 0.1%
Sam's Club 1.1% 5.3% 0.3% 3.8% 0.8% 1.5%
Total U.S. 3.0% 2.6% 2.9% 2.3% 0.1% 0.3%
Comparable sales is a metric that indicates the performance of our existing stores and clubs and it is important to
review in conjunction with the Company's financial results reported in accordance with GAAP. Comparable sales
excluding fuel is also an important, separate metric that indicates the performance of our existing stores and clubs
without considering fuel, which is volatile and unpredictable. Other companies in our industry may calculate
comparable sales differently, limiting the comparability of the metric.
8
Walmart Inc.
Reconciliations of and Other Information Regarding Non-GAAP Financial Measures
(Unaudited)
The following information provides reconciliations of certain non-GAAP financial measures presented in the press
release to which this reconciliation is attached to the most directly comparable financial measures calculated and
presented in accordance with generally accepted accounting principles (GAAP). The company has provided the
non-GAAP financial information presented in the press release, which is not calculated or presented in accordance
with GAAP, as information supplemental and in addition to the financial measures presented in the press release
that are calculated and presented in accordance with GAAP. Such non-GAAP financial measures should not be
considered superior to, as a substitute for or alternative to, and should be considered in conjunction with, the GAAP
financial measures presented in the press release. The non-GAAP financial measures in the press release may
differ from similar measures used by other companies.
Constant Currency
In discussing our operating results, the term currency exchange rates refers to the currency exchange rates we use
to convert the operating results for countries where the functional currency is not the U.S. dollar into U.S. dollars or
for countries experiencing hyperinflation. We calculate the effect of changes in currency exchange rates as the
difference between current period activity translated using the current period's currency exchange rates and the
comparable prior year period's currency exchange rates. Additionally, no currency exchange rate fluctuations are
calculated for non-USD acquisitions until owned for 12 months.
Throughout our discussion, we refer to the results of this calculation as the impact of currency exchange rate
fluctuations. When we refer to constant currency operating results, this means operating results without the impact
of the currency exchange rate fluctuations. The disclosure of constant currency amounts or results permits
investors to better understand Walmart's underlying performance without the effects of currency exchange rate
fluctuations.
The table below reflects the calculation of constant currency for total revenues, net sales and operating income for
the three months ended April 30, 2019.
Three Months Ended April 30,
Walmart
International Consolidated
(Dollars in millions) 2019
Percent
Change1
2019
Percent
Change1
Total revenues:
As reported $ 29,073 -5.1% $ 123,925 1.0%
Currency exchange rate fluctuations 1,853 N/A 1,853 N/A
Constant currency total revenues $ 30,926 1.0% $ 125,778 2.5%
Net sales:
As reported $ 28,775 -4.9% $ 122,949 1.1%
Currency exchange rate fluctuations 1,838 N/A 1,838 N/A
Constant currency net sales $ 30,613 1.2% $ 124,787 2.6%
Operating income:
As reported $ 738 -41.7% $ 4,945 -4.1%
Currency exchange rate fluctuations 52 N/A 52 N/A
Constant currency operating income $ 790 -37.5% $ 4,997 -3.0%
1
Change versus prior year comparable period.
9
Free Cash Flow
We define free cash flow as net cash provided by operating activities in a period minus payments for property and
equipment made in that period. We had net cash provided by operating activities of $3.6 billion for the three months
ended April 30, 2019, which declined when compared to $5.2 billion for the three months ended April 30, 2018
primarily due to an increase in inventory related to accelerated buying in certain categories, the timing of sell
through for summer seasonal merchandise, increased eCommerce fulfillment center mirroring, and the timing of
payments. We generated free cash flow of $1.4 billion for the three months ended April 30, 2019, which declined
when compared to $3.3 billion for the three months ended April 30, 2018 due to the same reasons as the decline in
net cash provided by operating activities, as well as $0.4 billion in increased capital expenditures.
Free cash flow is considered a non-GAAP financial measure. Management believes, however, that free cash flow,
which measures our ability to generate additional cash from our business operations, is an important financial
measure for use in evaluating the company's financial performance. Free cash flow should be considered in
addition to, rather than as a substitute for, consolidated net income as a measure of our performance and net cash
provided by operating activities as a measure of our liquidity.
Additionally, Walmart's definition of free cash flow is limited, in that it does not represent residual cash flows
available for discretionary expenditures, due to the fact that the measure does not deduct the payments required for
debt service and other contractual obligations or payments made for business acquisitions. Therefore, we believe it
is important to view free cash flow as a measure that provides supplemental information to our Consolidated
Statements of Cash Flows.
Although other companies report their free cash flow, numerous methods may exist for calculating a company's free
cash flow. As a result, the method used by Walmart's management to calculate our free cash flow may differ from
the methods used by other companies to calculate their free cash flow.
The following table sets forth a reconciliation of free cash flow, a non-GAAP financial measure, to net cash provided
by operating activities, which we believe to be the GAAP financial measure most directly comparable to free cash
flow, as well as information regarding net cash used in investing activities and net cash used in financing activities.
Three Months Ended
April 30,
(Dollars in millions) 2019 2018
Net cash provided by operating activities $ 3,563 $ 5,161
Payments for property and equipment (capital expenditures) (2,205) (1,818)
Free cash flow $ 1,358 $ 3,343
Net cash used in investing activities1
$ (1,135) $ (1,682)
Net cash used in financing activities (846) (2,486)
1
"Net cash used in investing activities" includes payments for property and equipment, which is also included in our computation of free cash
flow.
10
Adjusted EPS
Adjusted diluted earnings per share attributable to Walmart (Adjusted EPS) is considered a non-GAAP financial
measure under the SEC's rules because it excludes certain amounts not excluded in the diluted earnings per share
attributable to Walmart calculated in accordance with GAAP (EPS), the most directly comparable financial measure
calculated in accordance with GAAP. Management believes that Adjusted EPS is a meaningful measure to share
with investors because it best allows comparison of the performance for the comparable period. In addition,
Adjusted EPS affords investors a view of what management considers Walmart's core earnings performance and
the ability to make a more informed assessment of such core earnings performance.
We have calculated Adjusted EPS for the three months by adjusting EPS for the unrealized gains and losses on the
company's equity investment in JD.com. We adjust for these unrealized gains and losses because although the
Company's investment in JD.com was a strategic decision for the company's retail operations in China,
management's measurement of that strategy is primarily focused on the Walmart China financial results rather than
the investment value of JD.com. Additionally, management does not forecast changes in fair value of its equity
investments. Accordingly, management adjusts EPS for the unrealized JD.com investment gains/losses.
Three Months Ended April 30, 2019
Diluted earnings per share:
Reported EPS $ 1.33
Adjustments:
Pre-Tax
Impact Tax Impact1
Net Impact
Unrealized (gains) and losses on JD.com investment $ (0.27) $ 0.07 $ (0.20)
Adjusted EPS $ 1.13
1
Calculated based on nature of item, including any realizable deductions, and statutory rate in effect for relevant jurisdictions.
11
As previously disclosed in our fiscal year ended April 30, 2018 press release, we have calculated Adjusted EPS for
the three months ended April 30, 2018 by adjusting EPS for the following: (1) unrealized gains and losses on
JD.com, and (2) adjustment to the provisional amount recorded in Q4 fiscal 2018 related to Tax Reform. The
Company completed its accounting for Tax Reform during the fourth quarter of fiscal 2019. The most directly
comparable financial measure calculated in accordance with GAAP is EPS for the three months ended April 30,
2018.
Three Months Ended April 30,
2018
Diluted earnings per share:
Reported EPS $0.72
Adjustments:
Pre-Tax
Impact
Tax
Impact1
Net
Impact
Unrealized (gains) and losses on JD.com investment 0.62 (0.15) 0.47
Adjustment to provisional amount for Tax Reform — (0.05) (0.05)
Net adjustments $0.42
Adjusted EPS $1.14
1
Calculated based on nature of item and statutory rate in effect for relevant jurisdictions.
2
Change versus prior year comparable period

More Related Content

What's hot

P&G Delivers 17% EPS Growth - Raises Fiscal Year Outlook
P&G Delivers 17% EPS Growth - Raises Fiscal Year Outlook P&G Delivers 17% EPS Growth - Raises Fiscal Year Outlook
P&G Delivers 17% EPS Growth - Raises Fiscal Year Outlook finance3
 
Q4 2013 earnings_presentation_slides
Q4 2013 earnings_presentation_slidesQ4 2013 earnings_presentation_slides
Q4 2013 earnings_presentation_slidesir_styronllc
 
I-Byte Retail and consumer goods Industry
I-Byte Retail and consumer goods IndustryI-Byte Retail and consumer goods Industry
I-Byte Retail and consumer goods IndustryEGBG Services
 
I-Bytes Retail & Consumer Goods Industry
I-Bytes Retail & Consumer Goods IndustryI-Bytes Retail & Consumer Goods Industry
I-Bytes Retail & Consumer Goods IndustryEGBG Services
 
I-Bytes Retail & Consumer Goods Industry
I-Bytes Retail & Consumer Goods IndustryI-Bytes Retail & Consumer Goods Industry
I-Bytes Retail & Consumer Goods IndustryEGBG Services
 
ConAgra Q3Mar04
ConAgra Q3Mar04ConAgra Q3Mar04
ConAgra Q3Mar04finance21
 
AVY_3Q_2006_NR_102406
AVY_3Q_2006_NR_102406AVY_3Q_2006_NR_102406
AVY_3Q_2006_NR_102406finance45
 
10740603_786451778068578_954157789_n
10740603_786451778068578_954157789_n10740603_786451778068578_954157789_n
10740603_786451778068578_954157789_nmehedee shamim
 
Supermarket annual report_2012
Supermarket annual report_2012Supermarket annual report_2012
Supermarket annual report_2012IvonaPoyntz
 
P&G Reports Strong Sales and Earnings Growth, Increases Fiscal Year Outlook
P&G Reports Strong Sales and Earnings Growth, Increases Fiscal Year Outlook P&G Reports Strong Sales and Earnings Growth, Increases Fiscal Year Outlook
P&G Reports Strong Sales and Earnings Growth, Increases Fiscal Year Outlook finance3
 
P&G Delivers Strong Sales and EPS Results Despite Hurricane Impacts
P&G Delivers Strong Sales and EPS Results Despite Hurricane ImpactsP&G Delivers Strong Sales and EPS Results Despite Hurricane Impacts
P&G Delivers Strong Sales and EPS Results Despite Hurricane Impactsfinance3
 
Food-and-Beverage-Report-Profitability-in-competitive-landscapes
Food-and-Beverage-Report-Profitability-in-competitive-landscapesFood-and-Beverage-Report-Profitability-in-competitive-landscapes
Food-and-Beverage-Report-Profitability-in-competitive-landscapesMelissa Krakar, CPA, CA
 
altria group Quarter Results 2007 1st
altria group Quarter Results 2007 1staltria group Quarter Results 2007 1st
altria group Quarter Results 2007 1stfinance7
 
P&G Reports First Quarter EPS of $1.03 Up 12% on 9% Sales Growth
P&G Reports First Quarter EPS of $1.03 Up 12% on 9% Sales GrowthP&G Reports First Quarter EPS of $1.03 Up 12% on 9% Sales Growth
P&G Reports First Quarter EPS of $1.03 Up 12% on 9% Sales Growthfinance3
 
morgan stanley Earnings Archive 2005 3rd
morgan stanley Earnings Archive 2005 3rd morgan stanley Earnings Archive 2005 3rd
morgan stanley Earnings Archive 2005 3rd finance2
 
P&G Delivers Results Above Expectations - Raises Fiscal Year Outlook
P&G Delivers Results Above Expectations - Raises Fiscal Year OutlookP&G Delivers Results Above Expectations - Raises Fiscal Year Outlook
P&G Delivers Results Above Expectations - Raises Fiscal Year Outlookfinance3
 

What's hot (20)

P&G Delivers 17% EPS Growth - Raises Fiscal Year Outlook
P&G Delivers 17% EPS Growth - Raises Fiscal Year Outlook P&G Delivers 17% EPS Growth - Raises Fiscal Year Outlook
P&G Delivers 17% EPS Growth - Raises Fiscal Year Outlook
 
Q4 2013 earnings_presentation_slides
Q4 2013 earnings_presentation_slidesQ4 2013 earnings_presentation_slides
Q4 2013 earnings_presentation_slides
 
I-Byte Retail and consumer goods Industry
I-Byte Retail and consumer goods IndustryI-Byte Retail and consumer goods Industry
I-Byte Retail and consumer goods Industry
 
Ebay News 2005 4 20 Earnings
Ebay News 2005 4 20 EarningsEbay News 2005 4 20 Earnings
Ebay News 2005 4 20 Earnings
 
I-Bytes Retail & Consumer Goods Industry
I-Bytes Retail & Consumer Goods IndustryI-Bytes Retail & Consumer Goods Industry
I-Bytes Retail & Consumer Goods Industry
 
I-Bytes Retail & Consumer Goods Industry
I-Bytes Retail & Consumer Goods IndustryI-Bytes Retail & Consumer Goods Industry
I-Bytes Retail & Consumer Goods Industry
 
Assignment on BAT_Final
Assignment on BAT_FinalAssignment on BAT_Final
Assignment on BAT_Final
 
ConAgra Q3Mar04
ConAgra Q3Mar04ConAgra Q3Mar04
ConAgra Q3Mar04
 
AVY_3Q_2006_NR_102406
AVY_3Q_2006_NR_102406AVY_3Q_2006_NR_102406
AVY_3Q_2006_NR_102406
 
10740603_786451778068578_954157789_n
10740603_786451778068578_954157789_n10740603_786451778068578_954157789_n
10740603_786451778068578_954157789_n
 
Ebay News 2005 10 19 Earnings
Ebay News 2005 10 19 EarningsEbay News 2005 10 19 Earnings
Ebay News 2005 10 19 Earnings
 
Supermarket annual report_2012
Supermarket annual report_2012Supermarket annual report_2012
Supermarket annual report_2012
 
Bat justprint
Bat justprintBat justprint
Bat justprint
 
P&G Reports Strong Sales and Earnings Growth, Increases Fiscal Year Outlook
P&G Reports Strong Sales and Earnings Growth, Increases Fiscal Year Outlook P&G Reports Strong Sales and Earnings Growth, Increases Fiscal Year Outlook
P&G Reports Strong Sales and Earnings Growth, Increases Fiscal Year Outlook
 
P&G Delivers Strong Sales and EPS Results Despite Hurricane Impacts
P&G Delivers Strong Sales and EPS Results Despite Hurricane ImpactsP&G Delivers Strong Sales and EPS Results Despite Hurricane Impacts
P&G Delivers Strong Sales and EPS Results Despite Hurricane Impacts
 
Food-and-Beverage-Report-Profitability-in-competitive-landscapes
Food-and-Beverage-Report-Profitability-in-competitive-landscapesFood-and-Beverage-Report-Profitability-in-competitive-landscapes
Food-and-Beverage-Report-Profitability-in-competitive-landscapes
 
altria group Quarter Results 2007 1st
altria group Quarter Results 2007 1staltria group Quarter Results 2007 1st
altria group Quarter Results 2007 1st
 
P&G Reports First Quarter EPS of $1.03 Up 12% on 9% Sales Growth
P&G Reports First Quarter EPS of $1.03 Up 12% on 9% Sales GrowthP&G Reports First Quarter EPS of $1.03 Up 12% on 9% Sales Growth
P&G Reports First Quarter EPS of $1.03 Up 12% on 9% Sales Growth
 
morgan stanley Earnings Archive 2005 3rd
morgan stanley Earnings Archive 2005 3rd morgan stanley Earnings Archive 2005 3rd
morgan stanley Earnings Archive 2005 3rd
 
P&G Delivers Results Above Expectations - Raises Fiscal Year Outlook
P&G Delivers Results Above Expectations - Raises Fiscal Year OutlookP&G Delivers Results Above Expectations - Raises Fiscal Year Outlook
P&G Delivers Results Above Expectations - Raises Fiscal Year Outlook
 

Similar to Walmart Reports Q1 FY20 EPS of $1.33 on Revenue of $123.9B

T-Bytes Digital customer experience
T-Bytes Digital customer experience T-Bytes Digital customer experience
T-Bytes Digital customer experience EGBG Services
 
Child development classTopic Divorce Impact and Conseque
Child development classTopic Divorce Impact and ConsequeChild development classTopic Divorce Impact and Conseque
Child development classTopic Divorce Impact and ConsequeJinElias52
 
Sumr investor presentation sep 2015 v1
Sumr investor presentation sep 2015 v1Sumr investor presentation sep 2015 v1
Sumr investor presentation sep 2015 v1summerinfant
 
I-Bytes Technology Industry
I-Bytes Technology IndustryI-Bytes Technology Industry
I-Bytes Technology IndustryEGBG Services
 
Fy14 q4earningsreleasefinal wal mart
Fy14 q4earningsreleasefinal wal martFy14 q4earningsreleasefinal wal mart
Fy14 q4earningsreleasefinal wal martFrank Ragol
 
Sumr investor presentation dec 2015
Sumr investor presentation dec 2015Sumr investor presentation dec 2015
Sumr investor presentation dec 2015summerinfant
 
T Bytes Agile & AI Operations
T Bytes Agile & AI OperationsT Bytes Agile & AI Operations
T Bytes Agile & AI OperationsEGBG Services
 
I-Bytes Retail & consumer Goods Industry
I-Bytes Retail & consumer Goods IndustryI-Bytes Retail & consumer Goods Industry
I-Bytes Retail & consumer Goods IndustryEGBG Services
 
FLFLInvestor_PPT_Q3FY19.pdf
FLFLInvestor_PPT_Q3FY19.pdfFLFLInvestor_PPT_Q3FY19.pdf
FLFLInvestor_PPT_Q3FY19.pdfSanketPingale12
 
I-Byte Retail and consumer goods Industry
I-Byte Retail and consumer goods IndustryI-Byte Retail and consumer goods Industry
I-Byte Retail and consumer goods IndustryEGBG Services
 
First Quarter Earnings Call Presentation, April 2014
First Quarter Earnings Call Presentation, April 2014First Quarter Earnings Call Presentation, April 2014
First Quarter Earnings Call Presentation, April 2014Myers_Investors
 
Walmart Q2 FY21 Earnings
Walmart Q2 FY21 EarningsWalmart Q2 FY21 Earnings
Walmart Q2 FY21 EarningsWalmart
 
20180509 sauc q1 2018 teleconference slides final
20180509 sauc q1 2018 teleconference slides final20180509 sauc q1 2018 teleconference slides final
20180509 sauc q1 2018 teleconference slides finaldrhincorporated
 
Q4 2015 earnings conference call presentation 24 2_16_final
Q4 2015 earnings conference call presentation 24 2_16_finalQ4 2015 earnings conference call presentation 24 2_16_final
Q4 2015 earnings conference call presentation 24 2_16_finalMyers_Investors
 
LinkedIn Q1 2014 Earnings Call
LinkedIn Q1 2014 Earnings CallLinkedIn Q1 2014 Earnings Call
LinkedIn Q1 2014 Earnings CallLinkedIn
 
Monsanto Q4 2008 Financial Results
Monsanto Q4 2008 Financial ResultsMonsanto Q4 2008 Financial Results
Monsanto Q4 2008 Financial Resultsearningsreport
 
I Bytes Healthcare Industry
I Bytes Healthcare IndustryI Bytes Healthcare Industry
I Bytes Healthcare IndustryEGBG Services
 
4 t15 arezzo_apresentacao_call ing
4 t15 arezzo_apresentacao_call ing4 t15 arezzo_apresentacao_call ing
4 t15 arezzo_apresentacao_call ingArezzori
 

Similar to Walmart Reports Q1 FY20 EPS of $1.33 on Revenue of $123.9B (20)

T-Bytes Digital customer experience
T-Bytes Digital customer experience T-Bytes Digital customer experience
T-Bytes Digital customer experience
 
Child development classTopic Divorce Impact and Conseque
Child development classTopic Divorce Impact and ConsequeChild development classTopic Divorce Impact and Conseque
Child development classTopic Divorce Impact and Conseque
 
Sumr investor presentation sep 2015 v1
Sumr investor presentation sep 2015 v1Sumr investor presentation sep 2015 v1
Sumr investor presentation sep 2015 v1
 
MARKETING
MARKETINGMARKETING
MARKETING
 
I-Bytes Technology Industry
I-Bytes Technology IndustryI-Bytes Technology Industry
I-Bytes Technology Industry
 
Fy14 q4earningsreleasefinal wal mart
Fy14 q4earningsreleasefinal wal martFy14 q4earningsreleasefinal wal mart
Fy14 q4earningsreleasefinal wal mart
 
Sumr investor presentation dec 2015
Sumr investor presentation dec 2015Sumr investor presentation dec 2015
Sumr investor presentation dec 2015
 
T Bytes Agile & AI Operations
T Bytes Agile & AI OperationsT Bytes Agile & AI Operations
T Bytes Agile & AI Operations
 
I-Bytes Retail & consumer Goods Industry
I-Bytes Retail & consumer Goods IndustryI-Bytes Retail & consumer Goods Industry
I-Bytes Retail & consumer Goods Industry
 
FLFLInvestor_PPT_Q3FY19.pdf
FLFLInvestor_PPT_Q3FY19.pdfFLFLInvestor_PPT_Q3FY19.pdf
FLFLInvestor_PPT_Q3FY19.pdf
 
I-Byte Retail and consumer goods Industry
I-Byte Retail and consumer goods IndustryI-Byte Retail and consumer goods Industry
I-Byte Retail and consumer goods Industry
 
First Quarter Earnings Call Presentation, April 2014
First Quarter Earnings Call Presentation, April 2014First Quarter Earnings Call Presentation, April 2014
First Quarter Earnings Call Presentation, April 2014
 
Walmart Q2 FY21 Earnings
Walmart Q2 FY21 EarningsWalmart Q2 FY21 Earnings
Walmart Q2 FY21 Earnings
 
20180509 sauc q1 2018 teleconference slides final
20180509 sauc q1 2018 teleconference slides final20180509 sauc q1 2018 teleconference slides final
20180509 sauc q1 2018 teleconference slides final
 
Q4 2015 earnings conference call presentation 24 2_16_final
Q4 2015 earnings conference call presentation 24 2_16_finalQ4 2015 earnings conference call presentation 24 2_16_final
Q4 2015 earnings conference call presentation 24 2_16_final
 
LinkedIn Q1 2014 Earnings Call
LinkedIn Q1 2014 Earnings CallLinkedIn Q1 2014 Earnings Call
LinkedIn Q1 2014 Earnings Call
 
Monsanto Q4 2008 Financial Results
Monsanto Q4 2008 Financial ResultsMonsanto Q4 2008 Financial Results
Monsanto Q4 2008 Financial Results
 
Ebay News 2006 4 19 Earnings
Ebay News 2006 4 19 EarningsEbay News 2006 4 19 Earnings
Ebay News 2006 4 19 Earnings
 
I Bytes Healthcare Industry
I Bytes Healthcare IndustryI Bytes Healthcare Industry
I Bytes Healthcare Industry
 
4 t15 arezzo_apresentacao_call ing
4 t15 arezzo_apresentacao_call ing4 t15 arezzo_apresentacao_call ing
4 t15 arezzo_apresentacao_call ing
 

Recently uploaded

No 1 AMil Baba In Islamabad No 1 Amil Baba In Lahore No 1 Amil Baba In Faisl...
No 1 AMil Baba In Islamabad  No 1 Amil Baba In Lahore No 1 Amil Baba In Faisl...No 1 AMil Baba In Islamabad  No 1 Amil Baba In Lahore No 1 Amil Baba In Faisl...
No 1 AMil Baba In Islamabad No 1 Amil Baba In Lahore No 1 Amil Baba In Faisl...First NO1 World Amil baba in Faisalabad
 
Sustainability Leadership, April 26 2024
Sustainability Leadership, April 26 2024Sustainability Leadership, April 26 2024
Sustainability Leadership, April 26 2024TeckResourcesLtd
 
Collective Mining | Corporate Presentation - April 2024
Collective Mining | Corporate Presentation - April 2024Collective Mining | Corporate Presentation - April 2024
Collective Mining | Corporate Presentation - April 2024CollectiveMining1
 
VIP Kolkata Call Girls Bidhannagar 8250192130 Available With Room
VIP Kolkata Call Girls Bidhannagar 8250192130 Available With RoomVIP Kolkata Call Girls Bidhannagar 8250192130 Available With Room
VIP Kolkata Call Girls Bidhannagar 8250192130 Available With Roomrran7532
 
The Concept of Humanity in Islam and its effects at future of humanity
The Concept of Humanity in Islam and its effects at future of humanityThe Concept of Humanity in Islam and its effects at future of humanity
The Concept of Humanity in Islam and its effects at future of humanityJohanAspro
 
Russian Call Girls Kolkata Amaira 🤌 8250192130 🚀 Vip Call Girls Kolkata
Russian Call Girls Kolkata Amaira 🤌  8250192130 🚀 Vip Call Girls KolkataRussian Call Girls Kolkata Amaira 🤌  8250192130 🚀 Vip Call Girls Kolkata
Russian Call Girls Kolkata Amaira 🤌 8250192130 🚀 Vip Call Girls Kolkataanamikaraghav4
 
如何办理伦敦大学毕业证(文凭)London学位证书
如何办理伦敦大学毕业证(文凭)London学位证书如何办理伦敦大学毕业证(文凭)London学位证书
如何办理伦敦大学毕业证(文凭)London学位证书Fis s
 
如何办理北卡罗来纳大学教堂山分校毕业证(文凭)UNC学位证书
如何办理北卡罗来纳大学教堂山分校毕业证(文凭)UNC学位证书如何办理北卡罗来纳大学教堂山分校毕业证(文凭)UNC学位证书
如何办理北卡罗来纳大学教堂山分校毕业证(文凭)UNC学位证书Fir La
 
WheelTug PLC Pitch Deck | Investor Insights | April 2024
WheelTug PLC Pitch Deck | Investor Insights | April 2024WheelTug PLC Pitch Deck | Investor Insights | April 2024
WheelTug PLC Pitch Deck | Investor Insights | April 2024Hector Del Castillo, CPM, CPMM
 
Short-, Mid-, and Long-term gxxoals.pptx
Short-, Mid-, and Long-term gxxoals.pptxShort-, Mid-, and Long-term gxxoals.pptx
Short-, Mid-, and Long-term gxxoals.pptxHenryBriggs2
 
Osisko Gold Royalties Ltd - Corporate Presentation, April 23, 2024
Osisko Gold Royalties Ltd - Corporate Presentation, April 23, 2024Osisko Gold Royalties Ltd - Corporate Presentation, April 23, 2024
Osisko Gold Royalties Ltd - Corporate Presentation, April 23, 2024Osisko Gold Royalties Ltd
 
VIP Kolkata Call Girl Entally 👉 8250192130 Available With Room
VIP Kolkata Call Girl Entally 👉 8250192130  Available With RoomVIP Kolkata Call Girl Entally 👉 8250192130  Available With Room
VIP Kolkata Call Girl Entally 👉 8250192130 Available With Roomdivyansh0kumar0
 
《加州大学圣克鲁兹分校学位证书复制》Q微信741003700美国学历疑难问题指南|挂科被加州大学圣克鲁兹分校劝退没有毕业证怎么办?《UCSC毕业证购买|加...
《加州大学圣克鲁兹分校学位证书复制》Q微信741003700美国学历疑难问题指南|挂科被加州大学圣克鲁兹分校劝退没有毕业证怎么办?《UCSC毕业证购买|加...《加州大学圣克鲁兹分校学位证书复制》Q微信741003700美国学历疑难问题指南|挂科被加州大学圣克鲁兹分校劝退没有毕业证怎么办?《UCSC毕业证购买|加...
《加州大学圣克鲁兹分校学位证书复制》Q微信741003700美国学历疑难问题指南|挂科被加州大学圣克鲁兹分校劝退没有毕业证怎么办?《UCSC毕业证购买|加...wyqazy
 

Recently uploaded (20)

young call girls in Yamuna Vihar 🔝 9953056974 🔝 Delhi escort Service
young  call girls in   Yamuna Vihar 🔝 9953056974 🔝 Delhi escort Serviceyoung  call girls in   Yamuna Vihar 🔝 9953056974 🔝 Delhi escort Service
young call girls in Yamuna Vihar 🔝 9953056974 🔝 Delhi escort Service
 
No 1 AMil Baba In Islamabad No 1 Amil Baba In Lahore No 1 Amil Baba In Faisl...
No 1 AMil Baba In Islamabad  No 1 Amil Baba In Lahore No 1 Amil Baba In Faisl...No 1 AMil Baba In Islamabad  No 1 Amil Baba In Lahore No 1 Amil Baba In Faisl...
No 1 AMil Baba In Islamabad No 1 Amil Baba In Lahore No 1 Amil Baba In Faisl...
 
Sustainability Leadership, April 26 2024
Sustainability Leadership, April 26 2024Sustainability Leadership, April 26 2024
Sustainability Leadership, April 26 2024
 
Collective Mining | Corporate Presentation - April 2024
Collective Mining | Corporate Presentation - April 2024Collective Mining | Corporate Presentation - April 2024
Collective Mining | Corporate Presentation - April 2024
 
VIP Kolkata Call Girls Bidhannagar 8250192130 Available With Room
VIP Kolkata Call Girls Bidhannagar 8250192130 Available With RoomVIP Kolkata Call Girls Bidhannagar 8250192130 Available With Room
VIP Kolkata Call Girls Bidhannagar 8250192130 Available With Room
 
The Concept of Humanity in Islam and its effects at future of humanity
The Concept of Humanity in Islam and its effects at future of humanityThe Concept of Humanity in Islam and its effects at future of humanity
The Concept of Humanity in Islam and its effects at future of humanity
 
Call Girls in South Ex⎝⎝9953056974⎝⎝ Escort Delhi NCR
Call Girls in South Ex⎝⎝9953056974⎝⎝ Escort Delhi NCRCall Girls in South Ex⎝⎝9953056974⎝⎝ Escort Delhi NCR
Call Girls in South Ex⎝⎝9953056974⎝⎝ Escort Delhi NCR
 
Russian Call Girls Kolkata Amaira 🤌 8250192130 🚀 Vip Call Girls Kolkata
Russian Call Girls Kolkata Amaira 🤌  8250192130 🚀 Vip Call Girls KolkataRussian Call Girls Kolkata Amaira 🤌  8250192130 🚀 Vip Call Girls Kolkata
Russian Call Girls Kolkata Amaira 🤌 8250192130 🚀 Vip Call Girls Kolkata
 
young call girls in Hauz Khas,🔝 9953056974 🔝 escort Service
young call girls in Hauz Khas,🔝 9953056974 🔝 escort Serviceyoung call girls in Hauz Khas,🔝 9953056974 🔝 escort Service
young call girls in Hauz Khas,🔝 9953056974 🔝 escort Service
 
如何办理伦敦大学毕业证(文凭)London学位证书
如何办理伦敦大学毕业证(文凭)London学位证书如何办理伦敦大学毕业证(文凭)London学位证书
如何办理伦敦大学毕业证(文凭)London学位证书
 
如何办理北卡罗来纳大学教堂山分校毕业证(文凭)UNC学位证书
如何办理北卡罗来纳大学教堂山分校毕业证(文凭)UNC学位证书如何办理北卡罗来纳大学教堂山分校毕业证(文凭)UNC学位证书
如何办理北卡罗来纳大学教堂山分校毕业证(文凭)UNC学位证书
 
Model Call Girl in Uttam Nagar Delhi reach out to us at 🔝9953056974🔝
Model Call Girl in Uttam Nagar Delhi reach out to us at 🔝9953056974🔝Model Call Girl in Uttam Nagar Delhi reach out to us at 🔝9953056974🔝
Model Call Girl in Uttam Nagar Delhi reach out to us at 🔝9953056974🔝
 
WheelTug PLC Pitch Deck | Investor Insights | April 2024
WheelTug PLC Pitch Deck | Investor Insights | April 2024WheelTug PLC Pitch Deck | Investor Insights | April 2024
WheelTug PLC Pitch Deck | Investor Insights | April 2024
 
Short-, Mid-, and Long-term gxxoals.pptx
Short-, Mid-, and Long-term gxxoals.pptxShort-, Mid-, and Long-term gxxoals.pptx
Short-, Mid-, and Long-term gxxoals.pptx
 
young call girls in Govindpuri 🔝 9953056974 🔝 Delhi escort Service
young call girls in Govindpuri 🔝 9953056974 🔝 Delhi escort Serviceyoung call girls in Govindpuri 🔝 9953056974 🔝 Delhi escort Service
young call girls in Govindpuri 🔝 9953056974 🔝 Delhi escort Service
 
Call Girls In South Delhi 📱 9999965857 🤩 Delhi 🫦 HOT AND SEXY VVIP 🍎 SERVICE
Call Girls In South Delhi 📱  9999965857  🤩 Delhi 🫦 HOT AND SEXY VVIP 🍎 SERVICECall Girls In South Delhi 📱  9999965857  🤩 Delhi 🫦 HOT AND SEXY VVIP 🍎 SERVICE
Call Girls In South Delhi 📱 9999965857 🤩 Delhi 🫦 HOT AND SEXY VVIP 🍎 SERVICE
 
Osisko Gold Royalties Ltd - Corporate Presentation, April 23, 2024
Osisko Gold Royalties Ltd - Corporate Presentation, April 23, 2024Osisko Gold Royalties Ltd - Corporate Presentation, April 23, 2024
Osisko Gold Royalties Ltd - Corporate Presentation, April 23, 2024
 
VIP Kolkata Call Girl Entally 👉 8250192130 Available With Room
VIP Kolkata Call Girl Entally 👉 8250192130  Available With RoomVIP Kolkata Call Girl Entally 👉 8250192130  Available With Room
VIP Kolkata Call Girl Entally 👉 8250192130 Available With Room
 
Escort Service Call Girls In Shalimar Bagh, 99530°56974 Delhi NCR
Escort Service Call Girls In Shalimar Bagh, 99530°56974 Delhi NCREscort Service Call Girls In Shalimar Bagh, 99530°56974 Delhi NCR
Escort Service Call Girls In Shalimar Bagh, 99530°56974 Delhi NCR
 
《加州大学圣克鲁兹分校学位证书复制》Q微信741003700美国学历疑难问题指南|挂科被加州大学圣克鲁兹分校劝退没有毕业证怎么办?《UCSC毕业证购买|加...
《加州大学圣克鲁兹分校学位证书复制》Q微信741003700美国学历疑难问题指南|挂科被加州大学圣克鲁兹分校劝退没有毕业证怎么办?《UCSC毕业证购买|加...《加州大学圣克鲁兹分校学位证书复制》Q微信741003700美国学历疑难问题指南|挂科被加州大学圣克鲁兹分校劝退没有毕业证怎么办?《UCSC毕业证购买|加...
《加州大学圣克鲁兹分校学位证书复制》Q微信741003700美国学历疑难问题指南|挂科被加州大学圣克鲁兹分校劝退没有毕业证怎么办?《UCSC毕业证购买|加...
 

Walmart Reports Q1 FY20 EPS of $1.33 on Revenue of $123.9B

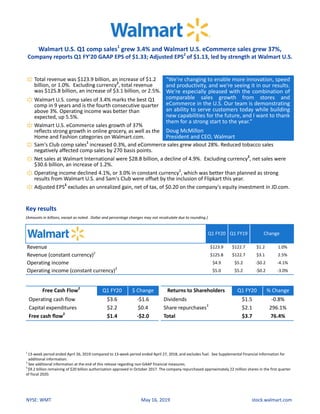
  • 1. NYSE: WMT May 16, 2019 stock.walmart.com Walmart U.S. Q1 comp sales1 grew 3.4% and Walmart U.S. eCommerce sales grew 37%, Company reports Q1 FY'20 GAAP EPS of $1.33; Adjusted EPS2 of $1.13, led by strength at Walmart U.S. Total revenue was $123.9 billion, an increase of $1.2 billion, or 1.0%. Excluding currency2 , total revenue was $125.8 billion, an increase of $3.1 billion, or 2.5%. "We're changing to enable more innovation, speed and productivity, and we're seeing it in our results. We're especially pleased with the combination of comparable sales growth from stores and eCommerce in the U.S. Our team is demonstrating an ability to serve customers today while building new capabilities for the future, and I want to thank them for a strong start to the year." Doug McMillon President and CEO, Walmart Walmart U.S. comp sales of 3.4% marks the best Q1 comp in 9 years and is the fourth consecutive quarter above 3%. Operating income was better than expected, up 5.5%. Walmart U.S. eCommerce sales growth of 37% reflects strong growth in online grocery, as well as the Home and Fashion categories on Walmart.com. Sam's Club comp sales1 increased 0.3%, and eCommerce sales grew about 28%. Reduced tobacco sales negatively affected comp sales by 270 basis points. Net sales at Walmart International were $28.8 billion, a decline of 4.9%. Excluding currency2 , net sales were $30.6 billion, an increase of 1.2%. Operating income declined 4.1%, or 3.0% in constant currency2 , which was better than planned as strong results from Walmart U.S. and Sam's Club were offset by the inclusion of Flipkart this year. Adjusted EPS2 excludes an unrealized gain, net of tax, of $0.20 on the company's equity investment in JD.com. Key results (Amounts in billions, except as noted. Dollar and percentage changes may not recalculate due to rounding.) Q1 FY20 Q1 FY19 Change Revenue $123.9 $122.7 $1.2 1.0% Revenue (constant currency)2 $125.8 $122.7 $3.1 2.5% Operating income $4.9 $5.2 -$0.2 -4.1% Operating income (constant currency)2 $5.0 $5.2 -$0.2 -3.0% Free Cash Flow2 Q1 FY20 $ Change Returns to Shareholders Q1 FY20 % Change Operating cash flow $3.6 -$1.6 Dividends $1.5 -0.8% Capital expenditures $2.2 $0.4 Share repurchases3 $2.1 296.1% Free cash flow2 $1.4 -$2.0 Total $3.7 76.4% 1 13-week period ended April 26, 2019 compared to 13-week period ended April 27, 2018, and excludes fuel. See Supplemental Financial Information for additional information. 2 See additional information at the end of this release regarding non-GAAP financial measures. 3 $9.2 billion remaining of $20 billion authorization approved in October 2017. The company repurchased approximately 22 million shares in the first quarter of fiscal 2020.
  • 2. 2 NYSE: WMT May 16, 2019 stock.walmart.com Segment results (Amounts in billions, except as noted. Dollar and percentage changes may not recalculate due to rounding.) U.S. Q1 FY20 Q1 FY19 Change Net sales $80.3 $77.7 $2.6 3.3% Comp sales (ex. fuel)1 3.4% 2.1% 130 bps N/A Transactions2 1.1% 1.4% -30 bps N/A Ticket2 2.3% 0.7% 160 bps N/A eCommerce ~140 bps ~100 bps ~40 bps N/A Operating income $4.1 $3.9 $0.2 5.5% Q1 FY20 Q1 FY19 Change Net sales $28.8 $30.3 -$1.5 -4.9% Net sales (constant currency)3 $30.6 $30.3 $0.4 1.2% Operating income $0.7 $1.3 -$0.5 -41.7% Operating income (constant currency)3 $0.8 $1.3 -$0.5 -37.5% Q1 FY20 Q1 FY19 Change Net sales $13.8 $13.6 $0.2 1.5% Comp sales (ex. fuel)1 0.3% 3.8% -350 bps N/A Transactions 4.7% 5.6% -90 bps N/A Ticket -4.4% -1.8% -260 bps N/A eCommerce ~140 bps ~100 bps ~40 bps N/A Operating income $0.5 $0.3 $0.1 38.8% 1 13-week period ended April 26, 2019 compared to 13-week period ended April 27, 2018, and excludes fuel. See Supplemental Financial Information for additional information. 2 In the first quarter of FY20, we updated our definition of traffic as a component of comparable sales to be all sales transactions in our stores as well as for eCommerce. Traffic will now be called transactions. For comparability, we revised this metric for FY19 and have provided a quarterly summary on our website at http://www.stock.walmart.com. 3 See additional information at the end of this release regarding non-GAAP financial measures.
  • 3. 3 NYSE: WMT May 16, 2019 stock.walmart.com Additional highlights for the first quarter • Introduced increased rewards and protected PTO for U.S. associates • Launched free NextDay delivery from Walmart.com with plans to reach 75% of U.S. population by year's end • Introduced Walmart Voice Order, initially through the Google Assistant, to make basket building for online grocery orders even easier • Launched new personalized baby registry on Walmart.com • Introduced first online pet pharmacy, Walmartpetrx.com • Announced participation in the USDA's SNAP online purchasing pilot • Announced partnership with Affirm to allow customers to make purchases and pay over time at Walmart stores and online • Launched exclusive line of denim on Walmart.com with Sofia Vergara • Launched exclusive MoDRN brand in the Home category • Launched exclusive Hello Bello brand in the Baby category with Kristen Bell and Dax Shepard • Launched exclusive Flower brand in the Home category on Walmart.com with Drew Barrymore • Launched Evolution_18, a health & wellness line from Bobbi Brown, in stores and online • Announced partnership with KIDBOX to deliver personalized kids fashion through Walmart.com • Announced the creation of a new Angus beef supply chain to service 500 U.S. stores • Launched new Intelligent Retail Lab in a live shopping environment to help unlock the possibilities of Artificial Intelligence • Acquired natural language processing startup, Aspectiva • Acquired assets of Polymorph Labs to expand in-house advertising technology • Announced the launch of PhonePe as a payment option at Walmart's "B2B Cash & Carry" stores in India • Opened next generation Sam's Club in Shanghai • Launched a Super App solution with PhonePe in India • Launched Flipkart venture capital fund • Launched new reusable shopping bag campaign in U.S. stores • Announced new plastic packaging waste reduction commitments About Walmart Walmart Inc. (NYSE: WMT) helps people around the world save money and live better - anytime and anywhere - in retail stores, online, and through their mobile devices. Each week, over 275 million customers and members visit our more than 11,300 stores under 58 banners in 27 countries and eCommerce websites. With fiscal year 2019 revenue of $514.4 billion, Walmart employs over 2.2 million associates worldwide. Walmart continues to be a leader in sustainability, corporate philanthropy and employment opportunity. Additional information about Walmart can be found by visiting http://corporate.walmart.com, on Facebook at http://facebook.com/walmart and on Twitter at http://twitter.com/walmart. Investor Relations contact Dan Binder (479) 258-7172 Media Relations contact Randy Hargrove (800) 331-0085
  • 4. 4 Walmart Inc. Condensed Consolidated Statements of Income (Unaudited) Three Months Ended April 30, (Amounts in millions, except per share data) 2019 2018 Percent Change Revenues: Net sales $122,949 $121,630 1.1 % Membership and other income 976 1,060 (7.9)% Total revenues 123,925 122,690 1.0 % Costs and expenses: Cost of sales 93,034 91,707 1.4 % Operating, selling, general and administrative expenses 25,946 25,829 0.5 % Operating income 4,945 5,154 (4.1)% Interest: Debt 588 437 34.6 % Finance, capital lease and financing obligations 85 93 (8.6)% Interest income (48) (43) 11.6 % Interest, net 625 487 28.3 % Other (gains) and losses (837) 1,845 (145.4)% Income before income taxes 5,157 2,822 82.7 % Provision for income taxes 1,251 546 129.1 % Consolidated net income 3,906 2,276 71.6 % Consolidated net income attributable to noncontrolling interest (64) (142) (54.9)% Consolidated net income attributable to Walmart $ 3,842 $ 2,134 80.0 % Net income per common share: Basic net income per common share attributable to Walmart $ 1.34 $ 0.72 86.1 % Diluted net income per common share attributable to Walmart $ 1.33 $ 0.72 84.7 % Weighted-average common shares outstanding: Basic 2,869 2,950 Diluted 2,886 2,967 Dividends declared per common share $ 2.12 $ 2.08
  • 5. 5 Walmart Inc. Condensed Consolidated Balance Sheets (Unaudited) April 30, January 31, April 30, (Amounts in millions) 2019 2019 2018 ASSETS Current assets: Cash and cash equivalents $ 9,255 $ 7,722 $ 7,885 Receivables, net 5,342 6,283 4,568 Inventories 44,751 44,269 43,303 Prepaid expenses and other 2,391 3,623 3,486 Total current assets 61,739 61,897 59,242 Property and equipment, net 104,604 104,317 107,622 Operating lease right of use assets, net 16,833 — — Finance lease right of use assets, net 3,804 — — Property under capital lease and financing obligations, net — 7,078 7,178 Goodwill 31,416 31,181 18,850 Other long-term assets 16,148 14,822 12,035 Total assets $ 234,544 $ 219,295 $ 204,927 LIABILITIES AND EQUITY Current liabilities: Short-term borrowings $ 4,828 $ 5,225 $ 7,762 Accounts payable 45,110 47,060 44,612 Dividends payable 4,551 — 4,607 Accrued liabilities 21,023 22,159 20,782 Accrued income taxes 729 428 718 Long-term debt due within one year 1,464 1,876 1,576 Operating lease obligations due within one year 1,748 — — Finance lease obligations due within one year 435 — — Capital leases obligations due within one year — 729 700 Total current liabilities 79,888 77,477 80,757 Long-term debt 47,425 43,520 29,477 Long-term operating lease obligations 15,719 — — Long-term finance lease obligations 3,810 — — Long-term obligations under capital leases — 6,683 6,828 Deferred income taxes and other 12,792 11,981 9,541 Commitments and contingencies Equity: Common stock 286 288 294 Capital in excess of par value 2,734 2,965 2,557 Retained earnings 76,276 80,785 82,982 Accumulated other comprehensive loss (11,091) (11,542) (10,281) Total Walmart shareholders’ equity 68,205 72,496 75,552 Noncontrolling interest 6,705 7,138 2,772 Total equity 74,910 79,634 78,324 Total liabilities and equity $ 234,544 $ 219,295 $ 204,927 The Company adopted ASU 2016-02, Leases (Topic 842), and related amendments as of February 1, 2019 under the modified retrospective approach and, therefore, has not revised comparative periods.
  • 6. 6 Walmart Inc. Condensed Consolidated Statements of Cash Flows (Unaudited) Three Months Ended April 30, (Amounts in millions) 2019 2018 Cash flows from operating activities: Consolidated net income $ 3,906 $ 2,276 Adjustments to reconcile consolidated net income to net cash provided by operating activities: Depreciation and amortization 2,714 2,678 Unrealized (gains) and losses (783) 1,845 Deferred income taxes 124 (50) Other operating activities 75 265 Changes in certain assets and liabilities, net of effects of acquisitions: Receivables, net 970 1,134 Inventories (421) 547 Accounts payable (1,854) (1,770) Accrued liabilities (1,514) (1,813) Accrued income taxes 346 49 Net cash provided by operating activities 3,563 5,161 Cash flows from investing activities: Payments for property and equipment (2,205) (1,818) Proceeds from the disposal of property and equipment 42 198 Proceeds from disposal of certain operations 833 — Payments for business acquisitions, net of cash acquired (56) — Other investing activities 251 (62) Net cash used in investing activities (1,135) (1,682) Cash flows from financing activities: Net change in short-term borrowings (399) 2,501 Proceeds from issuance of long-term debt 3,978 — Repayments of long-term debt (364) (2,521) Dividends paid (1,520) (1,533) Purchase of Company stock (2,135) (539) Dividends paid to noncontrolling interest (96) (66) Other financing activities (310) (328) Net cash used in financing activities (846) (2,486) Effect of exchange rates on cash, cash equivalents and restricted cash (46) 143 Net increase (decrease) in cash, cash equivalents and restricted cash 1,536 1,136 Cash, cash equivalents and restricted cash at beginning of year 7,756 7,014 Cash, cash equivalents and restricted cash at end of period $ 9,292 $ 8,150
  • 7. 7 Walmart Inc. Supplemental Financial Information (Unaudited) Net sales and operating income Net Sales Operating Income Three Months Ended Three Months Ended April 30, April 30, (dollars in millions) 2019 2018 Percent Change 2019 2018 Percent Change Walmart U.S. $ 80,344 $ 77,748 3.3% $ 4,142 $ 3,927 5.5% Walmart International 28,775 30,260 -4.9% 738 1,265 -41.7% Sam's Club 13,830 13,622 1.5% 451 325 38.8% Corporate and support — — N/A (386) (363) 6.3% Consolidated $ 122,949 $ 121,630 1.1% $ 4,945 $ 5,154 -4.1% U.S. comparable sales results With Fuel Without Fuel Fuel Impact 13 Weeks Ended 13 Weeks Ended 13 Weeks Ended 4/26/2019 4/27/2018 4/26/2019 4/27/2018 4/26/2019 4/27/2018 Walmart U.S. 3.4% 2.2% 3.4% 2.1% 0.0% 0.1% Sam's Club 1.1% 5.3% 0.3% 3.8% 0.8% 1.5% Total U.S. 3.0% 2.6% 2.9% 2.3% 0.1% 0.3% Comparable sales is a metric that indicates the performance of our existing stores and clubs and it is important to review in conjunction with the Company's financial results reported in accordance with GAAP. Comparable sales excluding fuel is also an important, separate metric that indicates the performance of our existing stores and clubs without considering fuel, which is volatile and unpredictable. Other companies in our industry may calculate comparable sales differently, limiting the comparability of the metric.
  • 8. 8 Walmart Inc. Reconciliations of and Other Information Regarding Non-GAAP Financial Measures (Unaudited) The following information provides reconciliations of certain non-GAAP financial measures presented in the press release to which this reconciliation is attached to the most directly comparable financial measures calculated and presented in accordance with generally accepted accounting principles (GAAP). The company has provided the non-GAAP financial information presented in the press release, which is not calculated or presented in accordance with GAAP, as information supplemental and in addition to the financial measures presented in the press release that are calculated and presented in accordance with GAAP. Such non-GAAP financial measures should not be considered superior to, as a substitute for or alternative to, and should be considered in conjunction with, the GAAP financial measures presented in the press release. The non-GAAP financial measures in the press release may differ from similar measures used by other companies. Constant Currency In discussing our operating results, the term currency exchange rates refers to the currency exchange rates we use to convert the operating results for countries where the functional currency is not the U.S. dollar into U.S. dollars or for countries experiencing hyperinflation. We calculate the effect of changes in currency exchange rates as the difference between current period activity translated using the current period's currency exchange rates and the comparable prior year period's currency exchange rates. Additionally, no currency exchange rate fluctuations are calculated for non-USD acquisitions until owned for 12 months. Throughout our discussion, we refer to the results of this calculation as the impact of currency exchange rate fluctuations. When we refer to constant currency operating results, this means operating results without the impact of the currency exchange rate fluctuations. The disclosure of constant currency amounts or results permits investors to better understand Walmart's underlying performance without the effects of currency exchange rate fluctuations. The table below reflects the calculation of constant currency for total revenues, net sales and operating income for the three months ended April 30, 2019. Three Months Ended April 30, Walmart International Consolidated (Dollars in millions) 2019 Percent Change1 2019 Percent Change1 Total revenues: As reported $ 29,073 -5.1% $ 123,925 1.0% Currency exchange rate fluctuations 1,853 N/A 1,853 N/A Constant currency total revenues $ 30,926 1.0% $ 125,778 2.5% Net sales: As reported $ 28,775 -4.9% $ 122,949 1.1% Currency exchange rate fluctuations 1,838 N/A 1,838 N/A Constant currency net sales $ 30,613 1.2% $ 124,787 2.6% Operating income: As reported $ 738 -41.7% $ 4,945 -4.1% Currency exchange rate fluctuations 52 N/A 52 N/A Constant currency operating income $ 790 -37.5% $ 4,997 -3.0% 1 Change versus prior year comparable period.
  • 9. 9 Free Cash Flow We define free cash flow as net cash provided by operating activities in a period minus payments for property and equipment made in that period. We had net cash provided by operating activities of $3.6 billion for the three months ended April 30, 2019, which declined when compared to $5.2 billion for the three months ended April 30, 2018 primarily due to an increase in inventory related to accelerated buying in certain categories, the timing of sell through for summer seasonal merchandise, increased eCommerce fulfillment center mirroring, and the timing of payments. We generated free cash flow of $1.4 billion for the three months ended April 30, 2019, which declined when compared to $3.3 billion for the three months ended April 30, 2018 due to the same reasons as the decline in net cash provided by operating activities, as well as $0.4 billion in increased capital expenditures. Free cash flow is considered a non-GAAP financial measure. Management believes, however, that free cash flow, which measures our ability to generate additional cash from our business operations, is an important financial measure for use in evaluating the company's financial performance. Free cash flow should be considered in addition to, rather than as a substitute for, consolidated net income as a measure of our performance and net cash provided by operating activities as a measure of our liquidity. Additionally, Walmart's definition of free cash flow is limited, in that it does not represent residual cash flows available for discretionary expenditures, due to the fact that the measure does not deduct the payments required for debt service and other contractual obligations or payments made for business acquisitions. Therefore, we believe it is important to view free cash flow as a measure that provides supplemental information to our Consolidated Statements of Cash Flows. Although other companies report their free cash flow, numerous methods may exist for calculating a company's free cash flow. As a result, the method used by Walmart's management to calculate our free cash flow may differ from the methods used by other companies to calculate their free cash flow. The following table sets forth a reconciliation of free cash flow, a non-GAAP financial measure, to net cash provided by operating activities, which we believe to be the GAAP financial measure most directly comparable to free cash flow, as well as information regarding net cash used in investing activities and net cash used in financing activities. Three Months Ended April 30, (Dollars in millions) 2019 2018 Net cash provided by operating activities $ 3,563 $ 5,161 Payments for property and equipment (capital expenditures) (2,205) (1,818) Free cash flow $ 1,358 $ 3,343 Net cash used in investing activities1 $ (1,135) $ (1,682) Net cash used in financing activities (846) (2,486) 1 "Net cash used in investing activities" includes payments for property and equipment, which is also included in our computation of free cash flow.
  • 10. 10 Adjusted EPS Adjusted diluted earnings per share attributable to Walmart (Adjusted EPS) is considered a non-GAAP financial measure under the SEC's rules because it excludes certain amounts not excluded in the diluted earnings per share attributable to Walmart calculated in accordance with GAAP (EPS), the most directly comparable financial measure calculated in accordance with GAAP. Management believes that Adjusted EPS is a meaningful measure to share with investors because it best allows comparison of the performance for the comparable period. In addition, Adjusted EPS affords investors a view of what management considers Walmart's core earnings performance and the ability to make a more informed assessment of such core earnings performance. We have calculated Adjusted EPS for the three months by adjusting EPS for the unrealized gains and losses on the company's equity investment in JD.com. We adjust for these unrealized gains and losses because although the Company's investment in JD.com was a strategic decision for the company's retail operations in China, management's measurement of that strategy is primarily focused on the Walmart China financial results rather than the investment value of JD.com. Additionally, management does not forecast changes in fair value of its equity investments. Accordingly, management adjusts EPS for the unrealized JD.com investment gains/losses. Three Months Ended April 30, 2019 Diluted earnings per share: Reported EPS $ 1.33 Adjustments: Pre-Tax Impact Tax Impact1 Net Impact Unrealized (gains) and losses on JD.com investment $ (0.27) $ 0.07 $ (0.20) Adjusted EPS $ 1.13 1 Calculated based on nature of item, including any realizable deductions, and statutory rate in effect for relevant jurisdictions.
  • 11. 11 As previously disclosed in our fiscal year ended April 30, 2018 press release, we have calculated Adjusted EPS for the three months ended April 30, 2018 by adjusting EPS for the following: (1) unrealized gains and losses on JD.com, and (2) adjustment to the provisional amount recorded in Q4 fiscal 2018 related to Tax Reform. The Company completed its accounting for Tax Reform during the fourth quarter of fiscal 2019. The most directly comparable financial measure calculated in accordance with GAAP is EPS for the three months ended April 30, 2018. Three Months Ended April 30, 2018 Diluted earnings per share: Reported EPS $0.72 Adjustments: Pre-Tax Impact Tax Impact1 Net Impact Unrealized (gains) and losses on JD.com investment 0.62 (0.15) 0.47 Adjustment to provisional amount for Tax Reform — (0.05) (0.05) Net adjustments $0.42 Adjusted EPS $1.14 1 Calculated based on nature of item and statutory rate in effect for relevant jurisdictions. 2 Change versus prior year comparable period