SlideShare a Scribd company logo
1 of 40
Download to read offline
R&D 100 • 2012
Exceptional service in the national interest
Parker THM Analyzer
2
SANDIA NATIONAL LABORATORIES • R&D 100 2012 • ENTRY SUBMISSION
Parker THM Analyzer
1. Developer Information
A. Primary Submitter
Michael P. Siegal
Sandia National Laboratories
P.O. Box 5800, Mail Stop 1415
Albuquerque, NM, 87185-1415
USA
505-845-9453
Fax: 505-844-5470
mpsiega@sandia.gov
www.sandia.gov
B. Joint Submitter
Using the Sandia National Laboratories concept for analyzing chemicals in
aqueous solutions, Parker Hannifin Corporation created a commercial system
that includes a table-top tool and the software to run the system. First available
to the water utility industry, the Parker THM Analyzer is being readily accepted as
a low-cost alternative for high-resolution analysis of trace trihalomethane (THM)
concentrations in the water supply that are regulated by the U.S. Environmental
Protection Agency (US-EPA).
Kazi Z. A. Hassan
Parker Hannifin Corporation
1005 A Cleaner Way
Huntsville, Alabama, 35805
USA
256-885-3879
khassan@parker.com
2. Product Information
A. Product Name
Parker THM Analyzer
3
SANDIA NATIONAL LABORATORIES • R&D 100 2012 • ENTRY SUBMISSION
B. Product Photo
Figure 1. The Parker THM Analyzer, the first product marketed based on Sandia’s nanoporous-carbon-
coated surface acoustic wave (SAW) technology. This product was designed with input from water
industry end users and experts. It provides water treatment operators with critical information in real-
time needed to control THM formation.
3. Product Description
This easy-to-operate, cost-effective, tabletop purge-and-trap gas chromatograph
ensures safe drinking water and monitors disinfection by-product formation at
water utilities in real-time without sample preparation or off-site analysis.
4. First Marketed
The Parker THM Analyzer was first offered for sale in June 2011.
5. Has this product or an earlier version been entered in the
R&D 100 awards competition previously?
We entered a prototype of this technology, called the “Portable Sensor System for
the Analysis of Hazardous Chemicals in Water,” in 2010. It did not win.
4
SANDIA NATIONAL LABORATORIES • R&D 100 2012 • ENTRY SUBMISSION
6. Principal Investigator
Michael P. Siegal
Principal Member of the Technical Staff
Sandia National Laboratories
P.O. Box 5800, Mail Stop 1415
Albuquerque, NM, 87185-1415
USA
505-845-9453
Fax: 505-844-5470
mpsiega@sandia.gov
7. Product price
$28,800
8. Patents
1. Provisional Patent Application #2802-157-028. Filed 09/2011. ANALYTICAL
SYSTEM AND METHOD FOR DETECTING VOLATILE ORGANIC COMPOUNDS IN
WATER, Hassan, Doutt, Cost, Morse, and Geis.
2. Patent Application #13/032,254. Filed 02/22/2011. METHOD TO GROW
NANOPOROUS-CARBON FOR VOLATILE GAS SENSORS, Overmyer and Siegal
3. Patent Application #US 2008/0289397 A1. Filed 11/27/2008. PORTABLE
ANALYTICAL SYSTEM FOR DETECTING ORGANIC CHEMICAL IN WATER, Hassan,
Cost, Mowry, Siegal, Robinson, Whiting, and Howell.
9. Product’s Primary Function
The Parker THM Analyzer is a simple and easy-to-operate, cost-effective, fully
integrated table-top purge-and-trap gas chromatograph (GC) that ensures safe
drinking water and enables monitoring of disinfection processes at water utilities
in real-time without sample preparation or off-site analysis. It analyzes drinking
water samples in only 30 minutes for the presence of the four trihalomethanes
(THMs) simultaneously below part-per-billion (ppb) levels, greatly exceeding U.S.
Environmental Protection Agency (EPA) regulations.
One hundred years ago, typhoid and cholera epidemics were common throughout
the United States. Those diseases and others are still endemic in parts of the
This
cost-effective,
table-top
technology
replaces an
entire chemical
laboratory.
5
SANDIA NATIONAL LABORATORIES • R&D 100 2012 • ENTRY SUBMISSION
world. For example, Haiti experienced outbreaks of typhoid and cholera in 2010.
In order to prevent similar outbreaks in the U.S., the US-EPA requires all water
utilities to monitor pathogen levels resulting from sewage discharges, leaking
septic tanks, and runoff from animal feedlots.
Ironically, the very chemical treatments of water so crucial for public health, e.g.,
chlorine and bromine, also react in water with trace natural organic matter to
create disinfection byproduct (DBP) chemicals, such as THMs, which are defined
as a group of chlorinated and brominated single-carbon compounds: chloroform
(CHCl3), dichlorobromomethane (CHCl2Br), dibromochloromethane (CHClBr2), and
bromoform (CHBr3). These four THMs are included in the US-EPA’s “suspected
negative health effects” category. Numerous toxicological and epidemiological
studies at high doses of THMs find evidence for adverse reproductive 1, 2, 3, 4, 5
and
developmental effects 6, 7, 8, 9, 10, 11
, while some low-dose studies show an association
to pancreatic 12
, bladder 13, 14, 15
, rectal and colon 16, 17
cancers.
The US-EPA requires all public water systems to use disinfection measures that
reduce DBP formation; in particular, total THMs are regulated to 80 ppb. State-
of-the-art analysis involves collecting water samples and sending them to a
specialized laboratory for chemical analysis, resulting in high cost and long wait-
times before results are reported. This time delay can cause critical problems for
public health and safety. Existing low-cost THM analysis systems barely meet US-
EPA limits and cannot measure the concentrations of each THM independently.
The Parker THM Analyzer is a cost-effective, table-top technology that replaces
an entire chemical laboratory. It provides easy-to-use, on-site analysis at water
utilities in 30 minutes (compared to the current times of days-to-weeks) with
no sample preparation of DBPs. With detection levels greatly exceeding US-
EPA requirements and comparable to large and expensive analytical laboratory
equipment, our product greatly benefits public health and safety.
10. How Does It Operate?
The Parker THM Analyzer is designed for high-precision, high-accuracy
measurement of THMs and offers a full complement of calibration and
quantification routines. With the push of a single button, helium (He) gas purges
volatile chemicals from a water sample and selectively captures the THMs in a
preconcentrator trap. The trap is then heated to desorb the THMs and carry them
in a He flow to a heated GC column that separates the THM components from
Toxicological
and
epidemiological
studies correlate
THM exposures
to adverse
reproductive and
developmental
effects, and
increased
incidence of
pancreatic,
bladder, rectal
and colon
cancers.
6
SANDIA NATIONAL LABORATORIES • R&D 100 2012 • ENTRY SUBMISSION
one another, with the individual THMs being detected by the nanoporous-carbon
(NPC)-coated surface acoustic wave (SAW) device for analysis. These functions
are shown schematically in Figure 2. The software program identifies each THM
as it exits the GC column and analyzes their individual concentrations. The
ability to obtain THM results quickly and reliably without sample preparation
provides water treatment operators with the information they need to control the
formation of THMS.
Figure 2. The Parker THM Analyzer plumbing schematic
Running a sample on the Parker THM Analyzer begins with collecting a treated
water sample in a 40 mL EPA vial and pouring it into the sample holder that
screws into the analyzer, shown on the left side of the analyzer in Figure 3. The
operator then clicks on the “START” icon on the laptop screen, names the sample,
clicks “OK”, and waits only 28 minutes for the detailed results.
Figure 3. Analyzer and laptop for system control and analysis
“Purge” is to
release the
volatile gases
from water by
bubbling air
or some inert
gas. “Trap”
is to trap the
volatile gases
one is interested
in detecting.
We use a
preconcentrator
that
preferentially
holds, or traps,
the THM gases.
7
SANDIA NATIONAL LABORATORIES • R&D 100 2012 • ENTRY SUBMISSION
The software can display the results in several easy-to-interpret ways for the
operator’s convenience. One example is shown in Figure 4. The data panel at the
top tabulates the details of the chromatography. This particular result measured
a 10 ppb standard sample for calibration purposes. The concentration of each
THM is recorded separately, as well as totaled because the EPA currently regulates
the Total THMs, or TTHMs, in treated water. In addition, the chromatogram itself
is shown in the lower panel. Note that the SAW response peak heights get larger
with the mass of the THMs. This is due to the higher sensitivity of the analyzer
for the heavier THM molecules with higher boiling points, and is discussed in the
reference Siegal, M. P.; Mowry, C. D.; Pfeifer, K. B., “Nanoporous-carbon coated
surface-acoustic-wave device for the detection of sub-nanogram quantities of
trihalomethanes,” submitted to Analytical Chemistry. The reports can be printed or
pasted as an image into another document. In addition, the operator can transfer
the data into Excel, Word, or other programs for later use.
Figure 4. Analysis run window from the laptop program showing the processed chromatogram after a
completed analysis run.
The analyzer is easily calibrated by running a set of standard samples. The samples
contain a mixture of each THM at a specific concentration. The software package
tabulates this data and provides an easy-to-understand display. A calibration for
chloroform is shown in Figure 5, plotting the SAW response peak heights against
the known concentrations.
The
breakthrough
that enables
this miniature
and inexpensive
detector is our
development
and use of NPC
sorbent coatings
on the SAW
device.
8
SANDIA NATIONAL LABORATORIES • R&D 100 2012 • ENTRY SUBMISSION
Figure 5. Calibration window for viewing current and previous calibrations
The accuracy and reliability of THM analysis was performed independently at
several water plants around the country, each using an EPA Certified Laboratory
for comparison. Table 1 shows a sample from the Nevada water plant where each
THM was measured independently. Note that the Parker THM Analyzer is always
within ± 10 – 15 % of the EPA certified lab measurements, with the individual
THM results within ± 2 ppb.
Table 1. THM and TTHM results from a Nevada Water Plant and an EPA Certified Laboratory
Tables 2, 3, and 4 show similar TTHM results from water plants in Alabama, Texas,
and South Carolina, all compared to an EPA certified laboratory. Most water
utilities focus on the TTHM level because that is what the EPA presently regulates.
Again, all the results agree within ± 10 – 15 % and ± 7 ppb for TTHM.
Parker has hit a
home run with
this instrument
– Professor
Christopher M.
Miller, Department
of Civil Engineering,
The University
of Akron
9
SANDIA NATIONAL LABORATORIES • R&D 100 2012 • ENTRY SUBMISSION
Table 2. TTHM results from an Alabama Water Plant and an EPA Certified Laboratory
Table 3. TTHM results from a Texas Water Plant and an EPA Certified Laboratory
Table 4. TTHM results from a South Carolina Water Plant and an EPA Certified Laboratory
11. Building Blocks of Our Technology
Crucial factors for the development of this remarkable breakthrough technology
include the use of NPC as a sorbent material for SAW device sensors and the
ability to optimize it to achieve parts-per-billion to parts-per-trillion detection
levels depending on the analyte. Parker and Sandia have worked together on the
development of this NPC-coated SAW sensor system for THM detection since 2006.
Since our R&D 100 Award submission two years ago for a prototype device, Parker
has greatly improved the overall system by transforming the original briefcase-
sized detector into a small table-top instrument (Figure 1), accommodated all
electrical circuitry onto a single PC board, improved the GC, modified the trap
(now also allowing for easy replacement), and is presently marketing the Parker
THM Analyzer based on this technology.
The NPC-coated SAW sensor is the heart of the product. We focus pulsed 248-
nm radiation from a krypton fluoride (KrF) excimer laser to ablate a rotating
10
SANDIA NATIONAL LABORATORIES • R&D 100 2012 • ENTRY SUBMISSION
graphite target, as shown in Figure 6. We control the kinetic energy of the ablated
carbon species by introducing a controlled pressure of argon (Ar), ranging from
100 – 200 mTorr, into the pulsed laser deposition (PLD) vacuum chamber. As
the Ar background pressure increases, the kinetic energy of the ablated species
decreases, resulting in lower NPC mass densities. We have reported mass densities
ranging from 0.08 – 2.0 g/cm3
.
Figure 6. Photograph of the pulsed-laser deposition process used to create nanoporous-carbon films.
We grow NPC directly onto ST-cut quartz surfaces between the 97 MHz gold
interdigitated transducers of a SAW delay line, shown in Figure 7(a), using PLD.
NPC self-assembles during deposition and consists of nano-fragments of several
aligned graphene sheets that have interplanar spacings expanded by as much as
55% compared to crystalline graphite. Intercalation of molecules into graphite
is well known. Increasing the interplanar spacing eases the diffusion of gas
analyte molecules both in and out of NPC. The ideal NPC mass density is both
a function of this nanoporosity and the mechanical integrity of the material in
order to pass a surface acoustic wave across a highly-disordered surface without a
significant loss in signal strength. This combination of critical factors is optimized
for NPC coatings with mass density ~ 1.0 g/cm3
. Figure 7(b) is a scanning electron
microscope (SEM) image showing the surface morphology of an optimized NPC
film coating, which despite its apparent roughness, is still sufficiently mechanically
stiff to pass the acoustic wave.
Figure 7(c) is a transmission electron microscope (TEM) image showing the internal
structure of optimized NPC. The dark lines are actually individual planes of
graphene sheet segments. (Graphene is a one-atom thick layer of carbon atoms.)
11
SANDIA NATIONAL LABORATORIES • R&D 100 2012 • ENTRY SUBMISSION
We find two structural features that help explain the ability for NPC to act as such
a strong absorbent for volatile chemicals. First, the yellow arrow points to a void
with a diameter ~ 1 nanometer that can store analyte molecules. Second, and more
significantly, the yellow line crosses over several aligned graphene sheet fragments.
The average distance between these fragments is ~ 0.45 nanometers, compared
to 0.35 nanometers for crystalline graphite. NPC consists of these small graphene
sheet clusters clumped together in every possible direction – very much like grains
of sand on the beach, where each grain is analogous to a cluster. These clusters are
separated by domain, or grain, boundaries. This image shows that such boundaries
exist every few nanometers. Essentially, NPC is an all-grain-boundary material
whose internal crystalline structure is expanded, with both features enabling rapid
diffusion in and out of the material, with nearly every internal graphene sheet
fragment acting as an available surface for chemical sorption.
Figure 7. (a) Photo of an NPC-coated 100 MHz SAW device on a U.S. quarter. This device replaces either
a full chemistry laboratory or a mass spectrometer for detecting the presence of THMs to below ppb
levels. (b) SEM image showing a 1-micrometer-thick NPC film surface with an optimized mass density
of 1 g/cm3
, exhibiting lots of ‘nooks and crannies’ for chemical species to penetrate into the bulk of
the film. (c) TEM image showing internal structure of an ultra-sorbent self-assembled NPC coating that
represents the heart of our invention. The yellow arrow points to a nanopore with ~ 1 nanometer
diameter. The yellow line crosses several graphene sheet fragments and finds that the interplanar
spacing is ~ 0.45 nanometers.
The limits-of-detection (LOD) of the optimized NPC-coated SAW sensor device
are measured together by injecting quantified mixed solutions, ranging from
1.3 – 183 ppb directly into a GC column. (Note that this GC column is NOT the
same as used in the Parker THM Analyzer and has NOT been optimized for these
tests.) The results are shown in Figure 8(a). Figure 8(b) is an expanded view of
the testing performed for the lowest THM concentration solutions. The THMs are
released from the GC in order of their molecular weights, which also corresponds
to their boiling points. Therefore, chloroform is released first, followed by
dichlorobromoform, dibromochloroform, and finally bromoform.
12
SANDIA NATIONAL LABORATORIES • R&D 100 2012 • ENTRY SUBMISSION
Figure 8. (a) The peak response of an optimized NPC-coated SAW device to all four THMs at exposure
levels of 1.3, 9, 93, and 183 ppb. (b) An expanded view of the responses for the lowest THM exposure
levels tested.
The raw data from Figure 8 is analyzed to quantify the SAW response of each
THM as a function of total exposure. This can be done either by determining
the maximum response for each THM (as is currently done by the Parker THM
Analyzer), or by integrating the total area under each response peak. While
the latter method provides greater sensitivity, the former method is more than
sufficient to meet the needs of the water utility industry to assist in compliance
with EPA regulations.
Figure 9. Analysis of the NPC-coated SAW device responses to various exposures using the maximum
SAW device response for each analyte. This method is used in the current Parker THM Analyzer software.
Figure 9 plots the THM peak heights vs. known concentrations. The thick dashed
lines through the data points are a best fit. To measure the LOD for each THM,
the minimum SAW response above the noise level must be determined. This is
estimated from Figure 8(b). The noise-level is approximately 0.15˚ with a standard
13
SANDIA NATIONAL LABORATORIES • R&D 100 2012 • ENTRY SUBMISSION
deviation of 0.07˚. A SAW response three-times greater than the standard deviation
of the noise level will provide a reliable detection limit. This sets the limit to
0.21˚ above the baseline and is shown in Figure 9 as a dashed horizontal line. The
intersection of the thin lines extrapolated from the power-law to this detection
limit provides the LOD for each individual THM and is listed as parts-per-trillion
in Table 5. The LODs for CF, DCBM, DBCM, and BF are 440, 150, 110 and 100 ppt,
providing precision and accuracy well in excess of EPA regulations.
Table 5. THM limits-of Detection (LODs) determined from both the peak height and integrated peak
methods using an optimized NPC-coated SAW device sensor.
Figure 10. Analysis of the NPC-coated SAW device responses to various exposures using the integrated
peak SAW device response for each analyte.
As noted above, the data from Figure 8 can be analyzed more accurately by
integrating the total area under each analyte response peak. These are plotted
in Figure 10. The thick dashed lines through the data points are a best fit. To
The Parker
THM Analyzer
provides
precision and
accuracy well
in excess of EPA
regulations.
14
SANDIA NATIONAL LABORATORIES • R&D 100 2012 • ENTRY SUBMISSION
measure the LOD for each THM, the minimum SAW response above the noise level
using this method must be determined. This can again be estimated from Figure
8(b), and is shown as a dashed horizontal line in Figure 10. The intersection of
the thin lines extrapolated from the power-law to this detection limit provides
the LOD for each individual THM and is also listed in parts-per-trillion in Table 5.
These LODs for CF, DCBM, DBCM, and BF are 77, 18, 0.7, and 0.3 ppt, significantly
better than the peak height analysis used by the current Parker THM Analyzer
software, and offering a simple improvement to gain several orders-of-magnitude
of improved sensitivity for DBP analysis without making any physical changes to
the existing product.
12. Product Comparison
Many methods for measuring THM concentrations in water exist. Most typically
have four sequential processes: purge, trap, separate, and detect. The first three
are routine. Purge involves bubbling, or sparging, a gas through a specific volume
of water for a sufficient period of time to extract all the volatile organic chemicals
(VOCs) from the water into a gas phase. This gas flow passes through a collector,
or preconcentrator, that traps VOCs but allows water vapor to pass through. The
preconcentrator material is typically specific for whatever VOCs are of interest.
Tenax® TA, a porous polymer resin based on 2.6-diphenylene oxide, is commonly
used for THMs. Upon heating, the collector releases the trapped species that then
enter a separator, such as a gas chromatograph. Finally a detector senses the
presence of VOCs, including THMs.
A variety of detectors can be used in combination with GC, such as mass
spectrometry (MS). GC-MS is a highly sensitive method for THM detection in
water and was used to discover many DBPs in water 18
. THM limits-of-detection
range from parts per billion to a few parts per trillion.19, 20, 21
A more common
THM detector for GC is electron capture detection (ECD).22
Used in combination
with purge and trap, GC-ECD can also achieve LODs < 1 ppb for individual
THM detection; however, all of these methods require some form of sample
preparation.23, 24, 25, 26, 27, 28
Other detectors with GC have also been successfully
demonstrated, including microwave plasma emission,29
thermal conductivity
detection,30
and atomic emission detection.31
There are also several other methods that measure THM concentrations without
the use of a separation procedure. These include Fourier transform infrared
(FT-IR) spectroscopy using attenuated total reflectance elements; however, the
“Because of
the new-found
convenience of
being able to
perform THM
analyses in-
house in 30
minutes, and
the cost savings
per sample, we
are now more
proactive than
ever before
about collecting
THM samples.”
– Jeff Pendergrass,
Water Treatment
Plant Supervisor,
Scottsboro, Alabama
Water, Sewer, and
Gas Board
15
SANDIA NATIONAL LABORATORIES • R&D 100 2012 • ENTRY SUBMISSION
LODs are not as sensitive as the GC methods.32, 33
Ultrasonication has been used
to break carbon-chlorine (C-Cl) bonds, followed by detecting changes in Cl-1
ion concentration via pH/ion selective electrode meters; however, this method
requires significant sample preparation, cannot distinguish the origin of Cl-1
ions,
and has limited sensitivity.34
Fluorescence spectroscopy has been used to measure
both Total Trihalomethanes (TTHMs) and total haloacetic acid (another DBP)
concentrations; however, it requires a chemical reaction with nicotinamide and
cannot measure DBPs independently.35, 36
Impedance spectroscopy based on analyte adsorption onto a surface has also
been utilized. Detection of brominated DBPs has been demonstrated from analyte
adsorption onto ten different conducting polymer coatings on gold microelectrode
sensing units; however, the combinations of polymers necessary to identify a
large number of mixed chemicals, such as exist in real water samples, can become
large.37
Surface acoustic wave device sensors offer greater resolution; an array of six SAW
device sensors was demonstrated to detect VOCs in water in combination with
purge-and-trap methods; however, similar to the impedance spectroscopy study, it
requires a sophisticated pattern recognition program to deconvolute the resulting
data, becoming both more complex and less reliable as the number of individual
VOCs present in a given sample increase.38
SAW devices have been studied more extensively as gas phase sensors.39
SAWs
measure the mass of materials that absorb to their surface as a fundamental
change in the propagation speed of a surface wave as a function of surface mass
density. This effect can be observed as a shift in center frequency of the transfer
function in frequency space or a phase change in the time domain. Small shifts
in the device wave propagation speed relate to the sorption of species. Sorbent
coatings, such as polymers or sol gels, are used to enhance this frequency shift
by allowing greater mass to adhere onto the surface.40, 41
An effective SAW coating
must be able to both sorb the desired gases and transmit an acoustic wave across
its surface without a significant insertion-loss increase. This latter condition places
additional requirements on an effective SAW coating. It must be sufficiently rigid
to maintain the acoustic wave and have minimal residual stress such that the
coating does not buckle or crack, and hence, dampen the wave. Also, the coating
cannot be discontinuous: all particles, grains, domains, etc., must maintain
good physical contact with the substrate to enable the passing of a surface wave.
16
SANDIA NATIONAL LABORATORIES • R&D 100 2012 • ENTRY SUBMISSION
Assuming these parameters are met, there also exists a thickness constraint for a
coating; too much mass will dampen a surface acoustic wave, limiting the relative
response to analyte sorption.
These critical coating requirements are met with nanoporous-carbon (NPC). NPC
is a nanocrystalline-to-amorphous form of graphite that has no residual stress,
is thermally stable to 600˚C, and is hydrophobic (advantageous for a water
testing material). NPC grows at room temperature on any substrate surface
using line-of-sight pulsed-laser deposition. Mass density, and hence porosity and
surface area, can be controlled by the deposition energetics from 2.0 g/cm3
to
less than 0.1 g/cm3
. The internal structure of NPC self-assembles during growth
and mainly consists of nano-fragments of several aligned graphene sheets that
have interplanar spacings expanded by as much as 55% compared to crystalline
graphite. Intercalation of molecules into graphite is well known. Increasing
the interplanar spacing eases the diffusion of species both in and out of NPC.43
NPC even demonstrates a large capacity to store alkali ions for electrochemical
capacitors and energy storage applications with relatively high charge and
discharge rates.44
More relevantly, NPC-coated SAW devices have been used to
detect a large variety of VOCs, similar to the THMs, with results suggesting LODs
well below 1 ppb for most of the analytes tested.45
Comparison Matrix
17
SANDIA NATIONAL LABORATORIES • R&D 100 2012 • ENTRY SUBMISSION
Improvements Over Competitive Products
The US-EPA passed in March 2006 and began implementing in January 2012
the Stage 2 Disinfectants and Disinfection Byproducts Rule (DBPR) to reduce
potential cancer risks and address concerns with potential reproductive and
developmental risks from DBPs. The Stage 2 DBPR is designed to reduce the
level of exposure from DBPs without compromising the control of microbial
pathogens. A main component of this rule is to reduce to below 80 ppb the
concentration of total THMs that are present in water disinfected with chlorine or
chloramine. Furthermore, while TTHM is monitored for compliance, its presence
is representative of many other chlorination DBPs that also occur in water, so a
reduction in TTHM generally indicates an overall reduction of DBPs. Previously,
the rule required water plants serving a population base > 10,000 people to only
report the average of four TTHM measurements taken from different places within
their plant and distribution system. However, a recent rule change requires all
four site measurements be reported independently and be below 80 ppb TTHM.
The EPA currently recognizes TTHM measurements performed using approved
EPA analytical chemistry methods. The continuous cost of having these analyses
performed by outside vendors gets very high. Furthermore, under best-case
scenarios, a water utility get results within a few days, during which time finished
drinking water is delivered to everyone within the district served by that utility.
The Hach THM Plus systems are low-cost tools to help provide water utilities
with in-house TTHM data that can be used to more closely monitor the usage
of treatment chemicals without constantly going through the EPA certified
laboratories. Some shortcomings in the Hach systems include the requirement
of a skilled worker to prepare water samples for TTHM analysis, the ongoing
costs for sample preparation kits, the time (several hours) for a single laborious
sample prep and measurement, the limited resolution (10 ppb), and the fact
that the individual THMs cannot be determined, just the four THMs in aggregate.
In addition, the Hach THM Plus methods can result in false positives due to
interference from other chlorinated DBPs. These considerations place severe
constraints on the utility and limit the overall usefulness of the device, preventing
the Hach product line from truly being competitive with the Parker THM Analyzer.
The Inficon systems provide significantly better information than the Hach
instrumentation, indeed more than sufficient to meet the requirements of the EPA
regulations. Similar to the Parker THM Analyzer, these gas chromatography and
The Parker
THM Analyzer
is the only
cost-effective
chemical
detection
system that
reports each
chemical
separately
and detects
low levels
(< 1 ppb) of all
four THMs.
18
SANDIA NATIONAL LABORATORIES • R&D 100 2012 • ENTRY SUBMISSION
GC/mass spectrometry instruments can measure individual THM levels to limits
ranging from 1 ppt to 1 ppb. However, the Inficon systems range in cost from
$45,000 to $140,000 for a complete analytical system and require a significant
level of personnel training to operate and interpret the results.
The Parker THM Analyzer is the only cost-effective chemical detection system that
reports each chemical separately and detects low levels (< 1 ppb) of all four THMs.
The Parker THM Analyzer combines all the necessary system features (purge, trap,
separate, and detect) using a low-cost, small, light-weight sensor based on mature
SAW device technology, but greatly improved with highly sensitive, reliable,
reproducible, and thermally stable NPC-sorbent coatings. The use of NPC-coated
SAW sensor devices enables the Parker THM Analyzer to achieve the detection
resolution and speciation of the high-cost Inficon product lines, but at significantly
lower cost. Most importantly, the Parker THM Analyzer is easier to use than any of
the competitive products, requiring significantly less training and lower skill levels
to perform chemical analyses: simply pour in the water and push a single button!
Limitations of product
• The Parker THM Analyzer is not an online or in-process instrument.
Parker’s THM Analyzer is designed to perform analysis on grab-samples taken
from multiple collection sites. While an on-line instrument could offer municipal
plant operators continuous process monitoring feedback at one site, customer
discovery indicated most operators preferred the ability to analyze samples
taken from multiple collection sites to control the process from initial raw water
treatment to clear well and on throughout the distribution system.
• Parker’s THM Analyzer is not portable
The THM Analyzer is a transportable, tabletop design weighing approximately 14
pounds. It was developed to operate in a plant lab environment and can easily
be transported from one plant to another.
• The Parker THM Analyzer does not feed data directly to a SCADA (Supervisory
Control and Data Acquisition) system.
The Analyzer’s grab-sample design configuration allows users the flexibility
to input custom sample names and information by collection site. Full report
features and data logging are supported.
• Parker’s THM Analyzer is not EPA Certified.
The Parker THM Analyzer is a process-monitoring instrument designed to
Our product is
easier to use
than any of
the competitive
products,
requiring
significantly
less training
and lower skill
levels: simply
pour in the
water and push
a single button!
19
SANDIA NATIONAL LABORATORIES • R&D 100 2012 • ENTRY SUBMISSION
provide municipal water treatment plants with timely data that can be used
to control their process and optimize the efficiency of their operation. It is not
an US-EPA-compliance instrument and does not replace the need for US-EPA-
required compliance testing. This is also true for other competitive products
on the market.
13. Product Use
Principal Applications and Benefits
The Parker THM Analyzer will greatly benefit public health and safety by
enabling on-site detection of hazardous chemicals in the nation’s water supplies
at lower levels in real time. Furthermore, past work at Sandia demonstrates this
technology is easily extended to detect other volatile organic and toxic industrial
compounds, both in solution and in air, at similar levels, i.e., near part-per-
trillion limits-of-detection.
Three hundred million people in the United States rely on public water systems
for safe, clean water. One hundred years ago, typhoid and cholera epidemics were
common throughout American cities. Disinfection, typically using chlorine, was
a major factor in reducing these epidemics and is still an essential part of water
treatment today. In 1990, the US-EPA Science Advisory Board cited drinking water
contamination as one of the most important environmental risks and indicated
that disease-causing microbial contaminants (i.e., bacteria, protozoa, and viruses)
were still the greatest remaining health-risk management challenge for drinking
water suppliers. This recognition was prompted by the concern about the number
of waterborne disease outbreaks in the United States, with over 500,000 cases
of waterborne disease reported between 1980 and 1994. In 1993, an outbreak
of Cryptosporidium, a microbial pathogen, caused 403,000 people in Milwaukee
to experience intestinal illness;46
over 4,000 were hospitalized, and at least 104
deaths were attributed to the disease.47
Not surprisingly, these problems exist
throughout the world.
The Safe Drinking Water Act (SDWA) was first passed by Congress in 1974 and
amended in 1986 and 1996. The US-EPA requires all public water systems to
closely monitor pathogen levels, including a few types of bacteria, viruses,
protozoa, and other organisms, which are frequently a result of fecal matter from
sewage discharges, leaking septic tanks, and runoff from animal feedlots into
bodies of water.
Three hundred
million people
in the United
States rely on
public water
systems for safe,
clean water.
20
SANDIA NATIONAL LABORATORIES • R&D 100 2012 • ENTRY SUBMISSION
As chemical detection developed over the years, scientists and engineers gained
greater abilities to identify and measure exactly what is in our water supplies.
Ironically, chemical treatment of drinking water that is critical for health, such as
chlorine, ozone, and chlorine dioxide, also react with trace natural organic matter
to create disinfection byproduct chemicals, such as the trihalomethanes. The
presence of THMs in the water supply was first reported in 1974.48
Different DBPs
result from different combinations of source water and disinfection processes, but,
in fact, only a few are monitored and regulated by the US-EPA. A major challenge
for water suppliers is how to balance the risks from microbial pathogens and
DBPs. The 1996 amendments to the SDWA required the US-EPA to develop rules to
achieve these goals.
In December 1998, the EPA established the Stage 1 Disinfectants/ Disinfection
By-products Rule, requiring all public water systems to use treatment measures
that reduce the formation of DBPs and meet specific standards. Today, TTHMs
are regulated at a maximum allowable annual average of 80 ppb. THMs
are characterized in the “suspected negative health effects” category, and
epidemiological and toxicological studies at high doses of THMs demonstrate clear
adverse reproductive and developmental effects, while some low-dose studies
show an association, rather than a causal link, to bladder, rectal, and colon
cancers. While the degree of risk has long been debated, the US-EPA requires
measurement and reporting of THMs in our water, preferring to err on the side of
safety while scientists continue studying these correlations.
The true variation in THM concentrations for any utility is not known, but
generally is assumed to vary daily due to a variety of source quality and treatment
factors. Indeed, seasonal variations are known due to the increased abundance
of natural organics in water during warmer weather. Unfortunately, the US-EPA
is forced to balance the health risks with the low costs of provision by water
consumers, and therefore only requires testing and reporting quarterly or
annually, depending on the size of the utility. Because of the unknown risk of each
individual THM, the difficulty in providing simultaneous individual measurements,
and the natural variation by locality, the four THMs are reported together as a
group.
In order to meet the 80 ppb regulation for Total THMs, many utilities are
considering changing their disinfection process to an alternative, but less-
understood process using chloramine-based chemicals. There are known DBPs
21
SANDIA NATIONAL LABORATORIES • R&D 100 2012 • ENTRY SUBMISSION
generated by this process as well, however, there is little data suggesting that they
have lowered risk factors. It is conceivable that increased knowledge of THM levels
will influence utility decisions regarding the switch to chloramines.
The ability to detect each THM separately with rapid and low-cost technology
will have wide-ranging impacts on the 300 million water consumers in the U.S.,
their utilities, and the epidemiological community. Implementation of the Stage
1 DBP Rule requires utilities to take samples across their distribution network to
determine approximate variations and concentration excursions. Enabling utilities
to measure THMs quickly and cheaply will allow them to:
a. monitor and optimize their disinfection processes for increased safety and
regulatory compliance, and
b. save money by more precisely determining locations to collect laboratory
samples, reducing the cost of compliance and monitoring.
The ability to detect each THM separately with on-site and rapid detection
technology will enable the epidemiological community to perform lower-
cost studies that also have improved data quality and frequency because the
measurements are:
a. in situ (local and not sent back to the lab)
b. more rapid (30 minutes versus waiting weeks for lab results)
c. economical due to no laboratory testing expenses.
The Parker THM Analyzer will enable improved risk assessments and
understanding of local variations, providing long-term health benefits to
water consumers.
Other Applications
While the initial focus of our product is monitoring THMs in water, we have
demonstrated detection of other chemicals of commercial value and health
interest. This includes both water and air analysis. Some specific examples
are discussed below, but the great advantage of the NPC-coated SAW is its
sensitivity and non-specific nature – potentially useful in a variety of chemical
monitoring applications.
The analyzer system is not limited to THMs in water. A host of chemical
contaminants can be detected. Figure 11 shows the analysis, using the
physical system without modification, of a water sample containing ppb
22
SANDIA NATIONAL LABORATORIES • R&D 100 2012 • ENTRY SUBMISSION
levels of several common fuel components of concern in fuel storage and
water quality applications.
Figure 11. Analysis of a water sample containing common fuel components.
Other hazardous solvents of concern to drinking water and wastewater
applications include chlorinated compounds such as those detected by the system
and shown in Figure 12. We anticipate additional applications with respect to
water monitoring. The measurement of chemicals in water is important for issues
ranging from:
• Homeland Security
• regulatory compliance
• taste and odor concerns
• remediation
• containment, cleanup, or tracking of chemical spills.
Figure 12. Analysis of hazardous chlorinated compounds
We also anticipate that this technology will be useful for air monitoring. Only
slight modifications will be required to collect and analyze air samples. The speed
and cost effectiveness of the system will allow, for example, occupational health
exposure monitoring. Breath monitoring in health-system settings or for disease
research is also anticipated.
23
SANDIA NATIONAL LABORATORIES • R&D 100 2012 • ENTRY SUBMISSION
Sandia has demonstrated NPC-coated SAW sensor devices detecting airborne
chemicals that are critical to public health and national security needs, including
volatile organic compounds (VOC), toxic industrial chemicals (TIC), chemical
warfare agents (CWA), and explosive and explosive residue compounds, such
as triacetone triperoxide (TATP), used in failed terrorist attempts on airliners.
Nearly all of these compounds are detected as readily as the THMs shown in this
application to LODs ranging from 1 ppb to better than 1 ppt.
Figure 13 demonstrates detection using a heated SAW of explosives-related
compounds. The ability to use a heated SAW makes the system useful for industrial
applications and is unique among coated-SAW developments.
Figure 13. Detection of explosives related compounds using a heated SAW.
Sandia has also applied NPC coatings as the adsorbent material for
micropreconcentrator devices where the analyte of interest is semi-volatile, such
as those commonly used for CWA and explosives. Such devices are routinely flash
heated to elevated temperatures near 200˚C to release the captured analytes
into some analytical system (GC, SAW, mass spectrometer, etc.). However, high
residual stresses in commonly used polymer or sol-gel coatings lead to film
delamination and membrane cracking with thermal cycling, constraining films to
submicrometer thicknesses that limit the available adsorbent surface area. The
NPC coatings do not have these limitations.
NPC-coatings for both SAW-coated sensors and preconcentrators can be readily
configured to develop a portable detection system for airborne chemicals with
minor alterations to the present configuration, greatly expanding its field-of-use
beyond chemical detection in aqueous systems.
NPC-coated SAW
sensor rapidly
detects airborne
chemicals that
are critical to
public health
and national
security needs:
volatile organic
compounds,
toxic industrial
chemicals,
and chemical
warfare agents.
24
SANDIA NATIONAL LABORATORIES • R&D 100 2012 • ENTRY SUBMISSION
14. Summary
The Parker THM Analyzer is an integrated purge-and-trap gas chromatograph
that provides results without sample preparation. This device can help operators
optimize water treatment at the plant and evaluate water age in the distribution
system for improved control over the formation of THMs. The Parker THM Analyzer
provides drinking water treatment plants and water distribution facilities with an
important tool to help deliver safe drinking water to the public.
The Parker THM Analyzer provides high-precision, high-accuracy measurement
of THMs and offers a full complement of calibration and quantification routines.
With the push of a button, the analyzer provides sample purging, THM component
separation, precise and accurate detection, and data analysis.
Offered in a complete analytical package, the Parker THM Analyzer features
a touch screen for status indication and basic data results displays. Analyzer
calibration is streamlined with detailed menu options, while push-button
operation simplifies building calibration curves and quantifying sample results.
This cost-effective, tabletop technology replaces an entire chemical laboratory. It
provides easy-to-use, on-site analysis with no sample preparation of DBPs at water
utilities in 30 minutes (compared to the current times of days to weeks), greatly
benefiting public health and safety. It is the only cost-effective tabletop sensor
system with better than ppb LOD levels for each THM simultaneously, greatly
enhancing the information necessary for epidemiological and toxicological studies
of these hazardous disinfection byproducts.
Furthermore, testing demonstrates the ability to readily detect many different
chemicals in water, including volatile organic compounds, toxic industrial
chemicals, and explosive-related compounds. Identification of these chemicals in
a laboratory, followed by a simple calibration similar to what we have performed
for the THMs, will enable the analyzer to monitor a multitude of chemicals
simultaneously. Previously, only expensive mass spectrometry techniques have
been capable of individually detecting each of these other water contaminants in
a mixed sample to ppb levels.
The Parker THM Analyzer, with its ease of measurement at reasonable cost, can
enable the US-EPA to regulate additional chemicals in the future and further
improve the safety of our municipal drinking water systems.
The Parker
THM Analyzer
provides high-
precision,
high-accuracy
measurement
of THMs and
offers a full
complement of
calibration and
quantification
routines. With
the push of
a button,
the analyzer
provides sample
purging, THM
component
separation, and
data analysis.
25
SANDIA NATIONAL LABORATORIES • R&D 100 2012 • ENTRY SUBMISSION
Finally, the small size and relatively low-cost of this system also suggest future use
as a permanent in situ diagnostic providing real-time monitoring of disinfection
processes. Such measurement improvements will not only create a safer finished
drinking water supply for the public, but can also help reduce the costs to
municipalities for their disinfection processes, and hence, lower the costs to the
ultimate users of the drinking water.
15. Affirmation
By submitting this entry to R&D Magazine I affirm that all information submitted
as a part of, or supplemental to, this entry is a fair and accurate representation of
this product.
Michael P. Siegal
26
SANDIA NATIONAL LABORATORIES • R&D 100 2012 • ENTRY SUBMISSION
Appendix A: Submitter Information
1. Contact person to handle all arrangements on exhibits, banquet, and publicity.
Glenn Kubiak
Director, Sandia National Laboratories
P. O. Box 969, Mail Stop 9405
Livermore, CA
94551-0969
USA
925-294-3375
Fax: 925-294-3403
kubiak@sandia.gov
2. Contact person for media and editorial inquiries.
Glenn Kubiak
Director, Sandia National Laboratories
P. O. Box 969, Mail Stop 9405
Livermore, CA
94551-0969
USA
925-294-3375
Fax: 925-294-3403
kubiak@sandia.gov
APPENDICES
27
SANDIA NATIONAL LABORATORIES • R&D 100 2012 • ENTRY SUBMISSION
Appendix B: Development Team Information
Donald L. Overmyer
Member of the Technical Staff
Sandia National Laboratories
P.O. Box 5800, Mail Stop 1415
Albuquerque, NM
87185-1415
USA
505-844-5435
Fax: 505-844-5470
dloverm@sandia.gov
Curtis D. Mowry
Senior Member of the Technical Staff
Sandia National Laboratories
P.O. Box 5800, Mail Stop 1415
Albuquerque, NM
87185-0886
USA
505-844-6271
Fax: 505-844-2974
cdmowry@sandia.gov
Kent B. Pfeifer
Principal Member of the Technical Staff
Sandia National Laboratories
P.O. Box 5800, Mail Stop 1415
Albuquerque, NM
87185-1425
USA
505-844-8105
Fax: 505-844-1198
kbpfeif@sandia.gov
28
SANDIA NATIONAL LABORATORIES • R&D 100 2012 • ENTRY SUBMISSION
Appendix B: Development Team Information (cont.)
Alex Robinson
Principal Member of the Technical Staff
Sandia National Laboratories
P.O. Box 5800, Mail Stop 1415
Albuquerque, NM
87185-1080
USA
505-844-9520
Fax: 505-844-2081
arobins@sandia.gov
William M. Cost
Applications Engineer
Parker Hannifin, Instrumentation Products Division
1005 A Cleaner Way
Huntsville, Alabama, 35805
USA
256-885-3810
wcost@parker.com
Mike Doutt
Senior Project Engineer
Parker Hannifin, Instrumentation Products Division
1005 A Cleaner Way
Huntsville, Alabama, 35805
USA
256-885-3834
mdoutt@parker.com
Glenn Geis
Project Engineer - Systems
Parker Hannifin, Instrumentation Products Division
1005 A Cleaner Way
Huntsville, Alabama, 35805
USA
256-885-3871
ggeis@parker.com
29
SANDIA NATIONAL LABORATORIES • R&D 100 2012 • ENTRY SUBMISSION
Appendix B: Development Team Information (cont.)
John A. Morse
New Business Development Manager
Parker Hannifin, Instrumentation Products Division
1005 A Cleaner Way
Huntsville, Alabama, 35805
USA
256-885-3850
jmorse@parker.com
30
SANDIA NATIONAL LABORATORIES • R&D 100 2012 • ENTRY SUBMISSION
Appendix C: Patent Application
Electronic Acknowledgement Receipt
EFS ID: 10897864
Application Number: 61531974
Confirmation Number: 5183
International Application Number:
Title of Invention: ANALYTICAL SYSTEM AND METHOD FOR DETECTING VOLATILE ORGANIC
COMPOUNDS IN WATER
First Named Inventor/Applicant Name: Kazi Z. A. Hassan
Customer Number: 49458
Application Type: Provisional
Time Stamp: 18:10:23
Filing Date:
Receipt Date: 07-SEP-2011
Attorney Docket Number: P157P0028US
Filer Authorized By:
Filer: Michael P. Wendolowski
Payment information:
Submitted with Payment yes
Payment was successfully received in RAM $220
Payment Type Credit Card
RAM confirmation Number 8206
Deposit Account 180988
Authorized User WENDOLOWSKI,MICHAEL P.
The Director of the USPTO is hereby authorized to charge indicated fees and credit any overpayment as follows:
Charge any Additional Fees required under 37 C.F.R. Section 1.16 (National application filing, search, and examination fees)
Charge any Additional Fees required under 37 C.F.R. Section 1.17 (Patent application and reexamination processing fees)
31
SANDIA NATIONAL LABORATORIES • R&D 100 2012 • ENTRY SUBMISSION
Appendix C: Patent Application (cont.)
32
SANDIA NATIONAL LABORATORIES • R&D 100 2012 • ENTRY SUBMISSION
Appendix D: Letters of Support
33
SANDIA NATIONAL LABORATORIES • R&D 100 2012 • ENTRY SUBMISSION
Appendix D: Letters of Support (cont.)
34
SANDIA NATIONAL LABORATORIES • R&D 100 2012 • ENTRY SUBMISSION
Appendix D: Letters of Support (cont.)
35
SANDIA NATIONAL LABORATORIES • R&D 100 2012 • ENTRY SUBMISSION
Appendix D: Letters of Support (cont.)
36
SANDIA NATIONAL LABORATORIES • R&D 100 2012 • ENTRY SUBMISSION
Appendix D: Letters of Support (cont.)
37
SANDIA NATIONAL LABORATORIES • R&D 100 2012 • ENTRY SUBMISSION
Appendix D: Letters of Support (cont.)
38
SANDIA NATIONAL LABORATORIES • R&D 100 2012 • ENTRY SUBMISSION
Appendix E: References
1
D.A. Savitz, K.W. Andrews, and L.M. Pastore, Environ. Health Persp. 103, 592 (1995).
2
M.D. Gallagher, J.R. Nuckols, L. Stallones, and D.A. Savitz, Epidemiol. 9, 484 (1998).
3
K. Waller, S.H. Swan, G. DeLorenze, and B. Hopkins, Epidemiol. 9, 134 (1998).
4
L. Dodds, W. King, C. Woolcott, and J. Pole, Epidemiol. 10, 233 (1999).
5
S.R. Bielmeier, D.S. Best, D.L. Guidici, and M.G. Narotsky, Tox. Sci. 59, 309 (2001).
6
M.D. Kramer, C.F. Lynch, P. Isacson, and J.W. Hanson, Epidemiol. 3, 407 (1992).
7
L. Dodds and W.D. King, Occup. Environ. Med. 58, 443 (2001).
8
J.M. Wright, J. Schwartz, and D.W. Dockery, Occup. Environ. Med. 60, 173 (2003).
9
J.M. Wright, J. Schwartz, and D.W. Dockery, Environ. Health Persp. 112, 920 (2004).
10
A.F. Hinckley, A.M. Bachand, and J.S. Reif, Environ. Health Persp. 113, 1808 (2005).
11
C. Lewis, I.H. Suffet, and B. Ritz, Am. J. Epidemiol, 163, 38 (2006).
12
G.L. Carlo and C.J. Mettlin, Am. J. Pub. Health, 70, 523 (1980).
13
W.D. King and L.D. Marrett, Cancer Causes and Control, 7, 596 (1996).
14
K.P. Cantor, C.F. Lynch, M.E. Hildesheim, M. Dosemeci, J. Lubin, M. Alavanja, and G. Craun,
Epidemiol. 9, 21 (1997).
15
C.M. Villanueva, K.P. Cantor, S. Cordier, J.J.K. Jaakkola, W.D. King, C.F. Lynch, S. Porru, and M.
Kogevinas, Epidemiol. 15, 357 (2004).
16
M.E. Hildesheim, K.P. Cantor, C.F. Lynch, M. Dosemeci, J. Lubin, M. Alavanja, and G. Craun,
Epidemiol. 9, 29 (1998).
17
G.A. Boorman, V. Dellarco, J.K. Dunnick, R.E. Chapin, S. Hunter, F. Hauchman, H. Gardner, M.
Cox, and R.C. Sills, Environ. Health Persp. 107, 207 (1999).
18
S.D. Richardson, J. Environ. Monit. 4, 1 (2002).
19
L. Zoccolillo, L. Amendola, C. Cafaro, and S. Insogna, J. Chroma. A, 1077, 181 (2005).
20
M.A. Jochman, X. Yuan, and T.C. Schmidt, Anal. Bioanal. Chem. 387, 2163 (2007).
21
E. Aguilera-Herrador, R. Lucena, S. Cardenas, and M. Valcarcel, J. Chroma. A, 1209, 76 (2008).
22
T. Aoki and K. Kawakami, Wat. Res. 23, 739 (1989).
23
L. Lepine and J.-F. Archambault, Anal. Chem. 64, 810 (1992).
24
D.-H. Cho, S.-H. Kong, and S.-G. Oh, Wat. Res. 37, 402 (2003).
25
M.Y. Tominaga and A.F. Midio, Braz. J. Pharm. Sci. 39, 195 (2003).
26
R.-S. Zhao, W.-J. Lao, and X.-B. Xu, Talanta, 62, 751 (2004).
27
G.L. Emmert, G. Cao, C. Duty, and W. Wolcott, Talanta, 63, 675 (2004).
28
M.A. Brown and G.L. Emmert, Anal. Chim. Acta, 555, 75 (2006).
29
B.D. Quimby, M.F. Delaney, P.C. Uden, and R.M. Barnes, Anal. Chem. 7, 875 (1979).
30
A. Segal, T. Gorecki, P. Mussche, J. Lips, and J. Pawliszyn, J. Chromat. A, 873, 13 (2000).
31
N. Campillo, P. Vinas, I. Lopez-Garcia, N. Aguinaga, and M. Hernadez-Cordoba, J. Chromat. A,
1035, 1 (2004).
32
R. Gobel, R. Krska, R. Kellner, R.W. Seitz, and S.A. Tomellini, Appl. Spectr. 48, 678 (1994).
33
M.C. Ertan-Lamontagne, S.R. Lowry, W.R. Seitz, and S.A. Tomellini, Appl. Spectr. 49, 1170 (1995).
34
G.E. Orzechowska, E.J. Poziomek, V.F. Hodge, and W.H. Engelmann, Environ. Sci. Technol. 29,
1373 (1995).
35
Y. Nakahara, S. Yamamoto, and K. Kawakami, Fuji Elec. Rev. 43, 110 (1997).
39
SANDIA NATIONAL LABORATORIES • R&D 100 2012 • ENTRY SUBMISSION
36
G.L. Emmert, G. Geme, M.A. Brown, and P.S. Simone, Jr., Anal. Chim. Acta, 656, 1 (2009).
37
E.R. Carvalho, N.C. Filho, E.C. Venancio, O.N.O. Jr., L.H.C. Mattoso, and L. Martin-Neto, Sensors, 7,
3258 (2007).
38
W.A. Groves, A.B. Grey, and P.T. O’Shaugnessy, J. Envior. Monit. 8, 932 (2006).
39
R.C. Hughes, A.J. Ricco, M.A. Butler, and S.J. Martin, Science, 254, 74 (1991).
40
A.J. Ricco, G.C. Frye, and S.J. Martin, Langmuir, 5, 273 (1989).
41
R.C. Thomas, L. Sun, R.M. Crooks, and A.J. Ricco, Langmuir, 7, 620 (1991).
42
M.P. Siegal, D.L. Overmyer, R.J. Kottenstette, D.R. Tallant, and W.G. Yelton, Appl. Phys. Lett. 80,
3940 (2002).
43
M.P. Siegal, W.G. Yelton, D.L. Overmyer, and P.P. Provencio, Langmuir, 20, 1194 (2004).
44
S.J. Limmer, W.G. Yelton, M.P. Siegal and B.C. Bunker, Electrochem. Soc. Trans. 28, 89 (2010).
45
M.P. Siegal and W.G. Yelton, Adv. Sci. Technol. 48, 161 (2006).
46
W.R. MacKenzie, N.J. Hoxie, M.E. Proctor, M.S. Gradus, K.A. Blair, D. E. Peterson, J.J. Kazmierczak,
D.G. Addiss, K.R. Fox, J.B. Rose, and J.P. Davis, New England J. Med., 331 (3), 161 (1994).
47
N.J. Hoxie, J.M. Vergeront, R.D. Nashold, and K.A. Blair, Am. J. Pub. Health, 87 (12), 2032 (1997).
48
J.J. Rook, Water. Treat. Exam. 23, 234 (1974).
Exceptional service in the national interest
Sandia National Laboratories is a multi-program laboratory managed and operated by Sandia Corporation,
a wholly owned subsidiary of Lockheed Martin Corporation, for the U.S. Department of Energy’s National
Nuclear Security Administration under contract DE-AC04-94AL85000

More Related Content

What's hot

Assessment of mortality and morbidity risks due to the consumption of some sa...
Assessment of mortality and morbidity risks due to the consumption of some sa...Assessment of mortality and morbidity risks due to the consumption of some sa...
Assessment of mortality and morbidity risks due to the consumption of some sa...theijes
 
Screening Environmental Water for a diverse range of Pollutants with UPLC Hig...
Screening Environmental Water for a diverse range of Pollutants with UPLC Hig...Screening Environmental Water for a diverse range of Pollutants with UPLC Hig...
Screening Environmental Water for a diverse range of Pollutants with UPLC Hig...Waters Corporation - Environmental Analysis
 
Ohio Dept. of Health Guidelines for Sampling Oil & Gas Wastes for TENORM
Ohio Dept. of Health Guidelines for Sampling Oil & Gas Wastes for TENORMOhio Dept. of Health Guidelines for Sampling Oil & Gas Wastes for TENORM
Ohio Dept. of Health Guidelines for Sampling Oil & Gas Wastes for TENORMMarcellus Drilling News
 
The Longitudinal Dependence of Indoor PAH Concentration on Outdoor PAH and Tr...
The Longitudinal Dependence of Indoor PAH Concentration on Outdoor PAH and Tr...The Longitudinal Dependence of Indoor PAH Concentration on Outdoor PAH and Tr...
The Longitudinal Dependence of Indoor PAH Concentration on Outdoor PAH and Tr...REY DECASTRO
 
Indoor Air Quality Sampling And Evaluation
Indoor Air Quality Sampling And EvaluationIndoor Air Quality Sampling And Evaluation
Indoor Air Quality Sampling And EvaluationPeter Woodman
 
Water Quality Managements Developments: Nutrients and Bacteria
Water Quality Managements Developments: Nutrients and BacteriaWater Quality Managements Developments: Nutrients and Bacteria
Water Quality Managements Developments: Nutrients and BacteriaSoutheast Chapter of Texas AWWA
 
Environmental Forensics - Brussels Dioxin Conference Plenary 2011
Environmental Forensics - Brussels Dioxin Conference Plenary 2011Environmental Forensics - Brussels Dioxin Conference Plenary 2011
Environmental Forensics - Brussels Dioxin Conference Plenary 2011Chemistry Matters Inc.
 
The International Journal of Engineering and Science (IJES)
The International Journal of Engineering and Science (IJES)The International Journal of Engineering and Science (IJES)
The International Journal of Engineering and Science (IJES)theijes
 
Chlorine gas alternative
Chlorine gas alternativeChlorine gas alternative
Chlorine gas alternativematthewprado
 
An efficient method for assessing water
An efficient method for assessing waterAn efficient method for assessing water
An efficient method for assessing waterijsc
 
Steering meeting presentation april 15 2014
Steering meeting presentation april 15 2014 Steering meeting presentation april 15 2014
Steering meeting presentation april 15 2014 reganf
 
Challenges of transporter IVIVE, Digoxin example
Challenges of transporter IVIVE, Digoxin exampleChallenges of transporter IVIVE, Digoxin example
Challenges of transporter IVIVE, Digoxin examplePhinC Development
 
Waters Oligonucleotide Analysis Solutions
Waters Oligonucleotide Analysis SolutionsWaters Oligonucleotide Analysis Solutions
Waters Oligonucleotide Analysis SolutionsWaters Corporation
 

What's hot (20)

Assessment of mortality and morbidity risks due to the consumption of some sa...
Assessment of mortality and morbidity risks due to the consumption of some sa...Assessment of mortality and morbidity risks due to the consumption of some sa...
Assessment of mortality and morbidity risks due to the consumption of some sa...
 
2013 Drinking Water Report
2013 Drinking Water Report2013 Drinking Water Report
2013 Drinking Water Report
 
Screening Environmental Water for a diverse range of Pollutants with UPLC Hig...
Screening Environmental Water for a diverse range of Pollutants with UPLC Hig...Screening Environmental Water for a diverse range of Pollutants with UPLC Hig...
Screening Environmental Water for a diverse range of Pollutants with UPLC Hig...
 
Frank resume 20150707
Frank resume 20150707Frank resume 20150707
Frank resume 20150707
 
Ohio Dept. of Health Guidelines for Sampling Oil & Gas Wastes for TENORM
Ohio Dept. of Health Guidelines for Sampling Oil & Gas Wastes for TENORMOhio Dept. of Health Guidelines for Sampling Oil & Gas Wastes for TENORM
Ohio Dept. of Health Guidelines for Sampling Oil & Gas Wastes for TENORM
 
The Longitudinal Dependence of Indoor PAH Concentration on Outdoor PAH and Tr...
The Longitudinal Dependence of Indoor PAH Concentration on Outdoor PAH and Tr...The Longitudinal Dependence of Indoor PAH Concentration on Outdoor PAH and Tr...
The Longitudinal Dependence of Indoor PAH Concentration on Outdoor PAH and Tr...
 
Indoor Air Quality Sampling And Evaluation
Indoor Air Quality Sampling And EvaluationIndoor Air Quality Sampling And Evaluation
Indoor Air Quality Sampling And Evaluation
 
Water Quality Managements Developments: Nutrients and Bacteria
Water Quality Managements Developments: Nutrients and BacteriaWater Quality Managements Developments: Nutrients and Bacteria
Water Quality Managements Developments: Nutrients and Bacteria
 
Environmental Forensics - Brussels Dioxin Conference Plenary 2011
Environmental Forensics - Brussels Dioxin Conference Plenary 2011Environmental Forensics - Brussels Dioxin Conference Plenary 2011
Environmental Forensics - Brussels Dioxin Conference Plenary 2011
 
The International Journal of Engineering and Science (IJES)
The International Journal of Engineering and Science (IJES)The International Journal of Engineering and Science (IJES)
The International Journal of Engineering and Science (IJES)
 
Chlorine gas alternative
Chlorine gas alternativeChlorine gas alternative
Chlorine gas alternative
 
An efficient method for assessing water
An efficient method for assessing waterAn efficient method for assessing water
An efficient method for assessing water
 
Steering meeting presentation april 15 2014
Steering meeting presentation april 15 2014 Steering meeting presentation april 15 2014
Steering meeting presentation april 15 2014
 
A Comparative Analysis of Semiconductor Electroplating Bath Additives by Cali...
A Comparative Analysis of Semiconductor Electroplating Bath Additives by Cali...A Comparative Analysis of Semiconductor Electroplating Bath Additives by Cali...
A Comparative Analysis of Semiconductor Electroplating Bath Additives by Cali...
 
Challenges of transporter IVIVE, Digoxin example
Challenges of transporter IVIVE, Digoxin exampleChallenges of transporter IVIVE, Digoxin example
Challenges of transporter IVIVE, Digoxin example
 
PhD thesis
PhD thesisPhD thesis
PhD thesis
 
Sampling project
Sampling projectSampling project
Sampling project
 
Waters Oligonucleotide Analysis Solutions
Waters Oligonucleotide Analysis SolutionsWaters Oligonucleotide Analysis Solutions
Waters Oligonucleotide Analysis Solutions
 
Expanding Your High Performance Liquid Chromatography and Ultra High Performa...
Expanding Your High Performance Liquid Chromatography and Ultra High Performa...Expanding Your High Performance Liquid Chromatography and Ultra High Performa...
Expanding Your High Performance Liquid Chromatography and Ultra High Performa...
 
Icrc 002-4033
Icrc 002-4033Icrc 002-4033
Icrc 002-4033
 

Similar to Real-time water quality analyzer replaces chemical labs

Analytical chemistry
Analytical chemistryAnalytical chemistry
Analytical chemistrynqkhanh1985
 
Sagar kanade m pharm indrustial project
Sagar kanade m pharm indrustial projectSagar kanade m pharm indrustial project
Sagar kanade m pharm indrustial projectSagar Kanade
 
Rapid Quantification of Perfluorinated Compounds in Drinking and Surface Wate...
Rapid Quantification of Perfluorinated Compounds in Drinking and Surface Wate...Rapid Quantification of Perfluorinated Compounds in Drinking and Surface Wate...
Rapid Quantification of Perfluorinated Compounds in Drinking and Surface Wate...Shimadzu Scientific Instruments
 
WATER QUALITY PREDICTION
WATER QUALITY PREDICTIONWATER QUALITY PREDICTION
WATER QUALITY PREDICTIONFasil47
 
Rapid radiochemical methods_in_water_with_cover_06-24-10
Rapid radiochemical methods_in_water_with_cover_06-24-10Rapid radiochemical methods_in_water_with_cover_06-24-10
Rapid radiochemical methods_in_water_with_cover_06-24-10Omar Alonso Suarez Oquendo
 
LC NMR HYPHENATED TECHNIQUES
LC NMR HYPHENATED TECHNIQUESLC NMR HYPHENATED TECHNIQUES
LC NMR HYPHENATED TECHNIQUESarulrathna
 
(THPS BIOCIDE BASE ) moniotoring in sea water
(THPS BIOCIDE BASE ) moniotoring in sea water(THPS BIOCIDE BASE ) moniotoring in sea water
(THPS BIOCIDE BASE ) moniotoring in sea waterAlsayed Yakoot
 
Are You Sticking with Drinking Bottled Water? Assessment of PFAS Content in C...
Are You Sticking with Drinking Bottled Water? Assessment of PFAS Content in C...Are You Sticking with Drinking Bottled Water? Assessment of PFAS Content in C...
Are You Sticking with Drinking Bottled Water? Assessment of PFAS Content in C...Shimadzu Scientific Instruments
 
Pain management-brochure itsp
Pain management-brochure itspPain management-brochure itsp
Pain management-brochure itspMark Hayward
 
PerkinElmer Spotlight on Analytical Applications e-Zine – Volume 16
PerkinElmer Spotlight on Analytical Applications e-Zine – Volume 16PerkinElmer Spotlight on Analytical Applications e-Zine – Volume 16
PerkinElmer Spotlight on Analytical Applications e-Zine – Volume 16PerkinElmer, Inc.
 
Quality-by-design-based development and validation of a stability-indicating ...
Quality-by-design-based development and validation of a stability-indicating ...Quality-by-design-based development and validation of a stability-indicating ...
Quality-by-design-based development and validation of a stability-indicating ...Ratnakaram Venkata Nadh
 
Microwave-Assisted_Extraction_and_HPLC-DAD_Determi.pdf
Microwave-Assisted_Extraction_and_HPLC-DAD_Determi.pdfMicrowave-Assisted_Extraction_and_HPLC-DAD_Determi.pdf
Microwave-Assisted_Extraction_and_HPLC-DAD_Determi.pdfDr.Venkata Suresh Ponnuru
 
The PFAS conundrum: Mass spectrometry solutions for addressing it.
The PFAS conundrum: Mass spectrometry solutions for addressing it.The PFAS conundrum: Mass spectrometry solutions for addressing it.
The PFAS conundrum: Mass spectrometry solutions for addressing it.Shimadzu Scientific Instruments
 

Similar to Real-time water quality analyzer replaces chemical labs (20)

Analytical chemistry
Analytical chemistryAnalytical chemistry
Analytical chemistry
 
Sagar kanade m pharm indrustial project
Sagar kanade m pharm indrustial projectSagar kanade m pharm indrustial project
Sagar kanade m pharm indrustial project
 
Rapid Quantification of Perfluorinated Compounds in Drinking and Surface Wate...
Rapid Quantification of Perfluorinated Compounds in Drinking and Surface Wate...Rapid Quantification of Perfluorinated Compounds in Drinking and Surface Wate...
Rapid Quantification of Perfluorinated Compounds in Drinking and Surface Wate...
 
Enhancing Volatile Organic Compounds in Water
Enhancing Volatile Organic Compounds in Water Enhancing Volatile Organic Compounds in Water
Enhancing Volatile Organic Compounds in Water
 
WATER QUALITY PREDICTION
WATER QUALITY PREDICTIONWATER QUALITY PREDICTION
WATER QUALITY PREDICTION
 
Rapid radiochemical methods_in_water_with_cover_06-24-10
Rapid radiochemical methods_in_water_with_cover_06-24-10Rapid radiochemical methods_in_water_with_cover_06-24-10
Rapid radiochemical methods_in_water_with_cover_06-24-10
 
LC NMR HYPHENATED TECHNIQUES
LC NMR HYPHENATED TECHNIQUESLC NMR HYPHENATED TECHNIQUES
LC NMR HYPHENATED TECHNIQUES
 
Poster grs 3040
Poster grs 3040Poster grs 3040
Poster grs 3040
 
(THPS BIOCIDE BASE ) moniotoring in sea water
(THPS BIOCIDE BASE ) moniotoring in sea water(THPS BIOCIDE BASE ) moniotoring in sea water
(THPS BIOCIDE BASE ) moniotoring in sea water
 
Are You Sticking with Drinking Bottled Water? Assessment of PFAS Content in C...
Are You Sticking with Drinking Bottled Water? Assessment of PFAS Content in C...Are You Sticking with Drinking Bottled Water? Assessment of PFAS Content in C...
Are You Sticking with Drinking Bottled Water? Assessment of PFAS Content in C...
 
Pain management-brochure itsp
Pain management-brochure itspPain management-brochure itsp
Pain management-brochure itsp
 
Determination of 3-chloropropanediol in soy sauce samples by liquid phase ext...
Determination of 3-chloropropanediol in soy sauce samples by liquid phase ext...Determination of 3-chloropropanediol in soy sauce samples by liquid phase ext...
Determination of 3-chloropropanediol in soy sauce samples by liquid phase ext...
 
WV-AS poster 2016
WV-AS poster 2016WV-AS poster 2016
WV-AS poster 2016
 
PerkinElmer Spotlight on Analytical Applications e-Zine – Volume 16
PerkinElmer Spotlight on Analytical Applications e-Zine – Volume 16PerkinElmer Spotlight on Analytical Applications e-Zine – Volume 16
PerkinElmer Spotlight on Analytical Applications e-Zine – Volume 16
 
water-07-01568
water-07-01568water-07-01568
water-07-01568
 
Balboa- Final Spring SYE Paper.
Balboa- Final Spring SYE Paper.Balboa- Final Spring SYE Paper.
Balboa- Final Spring SYE Paper.
 
cel-report
cel-reportcel-report
cel-report
 
Quality-by-design-based development and validation of a stability-indicating ...
Quality-by-design-based development and validation of a stability-indicating ...Quality-by-design-based development and validation of a stability-indicating ...
Quality-by-design-based development and validation of a stability-indicating ...
 
Microwave-Assisted_Extraction_and_HPLC-DAD_Determi.pdf
Microwave-Assisted_Extraction_and_HPLC-DAD_Determi.pdfMicrowave-Assisted_Extraction_and_HPLC-DAD_Determi.pdf
Microwave-Assisted_Extraction_and_HPLC-DAD_Determi.pdf
 
The PFAS conundrum: Mass spectrometry solutions for addressing it.
The PFAS conundrum: Mass spectrometry solutions for addressing it.The PFAS conundrum: Mass spectrometry solutions for addressing it.
The PFAS conundrum: Mass spectrometry solutions for addressing it.
 

Real-time water quality analyzer replaces chemical labs

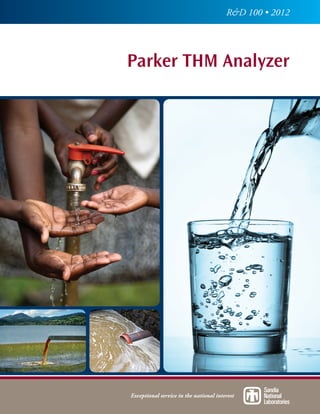
  • 1. R&D 100 • 2012 Exceptional service in the national interest Parker THM Analyzer
  • 2. 2 SANDIA NATIONAL LABORATORIES • R&D 100 2012 • ENTRY SUBMISSION Parker THM Analyzer 1. Developer Information A. Primary Submitter Michael P. Siegal Sandia National Laboratories P.O. Box 5800, Mail Stop 1415 Albuquerque, NM, 87185-1415 USA 505-845-9453 Fax: 505-844-5470 mpsiega@sandia.gov www.sandia.gov B. Joint Submitter Using the Sandia National Laboratories concept for analyzing chemicals in aqueous solutions, Parker Hannifin Corporation created a commercial system that includes a table-top tool and the software to run the system. First available to the water utility industry, the Parker THM Analyzer is being readily accepted as a low-cost alternative for high-resolution analysis of trace trihalomethane (THM) concentrations in the water supply that are regulated by the U.S. Environmental Protection Agency (US-EPA). Kazi Z. A. Hassan Parker Hannifin Corporation 1005 A Cleaner Way Huntsville, Alabama, 35805 USA 256-885-3879 khassan@parker.com 2. Product Information A. Product Name Parker THM Analyzer
  • 3. 3 SANDIA NATIONAL LABORATORIES • R&D 100 2012 • ENTRY SUBMISSION B. Product Photo Figure 1. The Parker THM Analyzer, the first product marketed based on Sandia’s nanoporous-carbon- coated surface acoustic wave (SAW) technology. This product was designed with input from water industry end users and experts. It provides water treatment operators with critical information in real- time needed to control THM formation. 3. Product Description This easy-to-operate, cost-effective, tabletop purge-and-trap gas chromatograph ensures safe drinking water and monitors disinfection by-product formation at water utilities in real-time without sample preparation or off-site analysis. 4. First Marketed The Parker THM Analyzer was first offered for sale in June 2011. 5. Has this product or an earlier version been entered in the R&D 100 awards competition previously? We entered a prototype of this technology, called the “Portable Sensor System for the Analysis of Hazardous Chemicals in Water,” in 2010. It did not win.
  • 4. 4 SANDIA NATIONAL LABORATORIES • R&D 100 2012 • ENTRY SUBMISSION 6. Principal Investigator Michael P. Siegal Principal Member of the Technical Staff Sandia National Laboratories P.O. Box 5800, Mail Stop 1415 Albuquerque, NM, 87185-1415 USA 505-845-9453 Fax: 505-844-5470 mpsiega@sandia.gov 7. Product price $28,800 8. Patents 1. Provisional Patent Application #2802-157-028. Filed 09/2011. ANALYTICAL SYSTEM AND METHOD FOR DETECTING VOLATILE ORGANIC COMPOUNDS IN WATER, Hassan, Doutt, Cost, Morse, and Geis. 2. Patent Application #13/032,254. Filed 02/22/2011. METHOD TO GROW NANOPOROUS-CARBON FOR VOLATILE GAS SENSORS, Overmyer and Siegal 3. Patent Application #US 2008/0289397 A1. Filed 11/27/2008. PORTABLE ANALYTICAL SYSTEM FOR DETECTING ORGANIC CHEMICAL IN WATER, Hassan, Cost, Mowry, Siegal, Robinson, Whiting, and Howell. 9. Product’s Primary Function The Parker THM Analyzer is a simple and easy-to-operate, cost-effective, fully integrated table-top purge-and-trap gas chromatograph (GC) that ensures safe drinking water and enables monitoring of disinfection processes at water utilities in real-time without sample preparation or off-site analysis. It analyzes drinking water samples in only 30 minutes for the presence of the four trihalomethanes (THMs) simultaneously below part-per-billion (ppb) levels, greatly exceeding U.S. Environmental Protection Agency (EPA) regulations. One hundred years ago, typhoid and cholera epidemics were common throughout the United States. Those diseases and others are still endemic in parts of the This cost-effective, table-top technology replaces an entire chemical laboratory.
  • 5. 5 SANDIA NATIONAL LABORATORIES • R&D 100 2012 • ENTRY SUBMISSION world. For example, Haiti experienced outbreaks of typhoid and cholera in 2010. In order to prevent similar outbreaks in the U.S., the US-EPA requires all water utilities to monitor pathogen levels resulting from sewage discharges, leaking septic tanks, and runoff from animal feedlots. Ironically, the very chemical treatments of water so crucial for public health, e.g., chlorine and bromine, also react in water with trace natural organic matter to create disinfection byproduct (DBP) chemicals, such as THMs, which are defined as a group of chlorinated and brominated single-carbon compounds: chloroform (CHCl3), dichlorobromomethane (CHCl2Br), dibromochloromethane (CHClBr2), and bromoform (CHBr3). These four THMs are included in the US-EPA’s “suspected negative health effects” category. Numerous toxicological and epidemiological studies at high doses of THMs find evidence for adverse reproductive 1, 2, 3, 4, 5 and developmental effects 6, 7, 8, 9, 10, 11 , while some low-dose studies show an association to pancreatic 12 , bladder 13, 14, 15 , rectal and colon 16, 17 cancers. The US-EPA requires all public water systems to use disinfection measures that reduce DBP formation; in particular, total THMs are regulated to 80 ppb. State- of-the-art analysis involves collecting water samples and sending them to a specialized laboratory for chemical analysis, resulting in high cost and long wait- times before results are reported. This time delay can cause critical problems for public health and safety. Existing low-cost THM analysis systems barely meet US- EPA limits and cannot measure the concentrations of each THM independently. The Parker THM Analyzer is a cost-effective, table-top technology that replaces an entire chemical laboratory. It provides easy-to-use, on-site analysis at water utilities in 30 minutes (compared to the current times of days-to-weeks) with no sample preparation of DBPs. With detection levels greatly exceeding US- EPA requirements and comparable to large and expensive analytical laboratory equipment, our product greatly benefits public health and safety. 10. How Does It Operate? The Parker THM Analyzer is designed for high-precision, high-accuracy measurement of THMs and offers a full complement of calibration and quantification routines. With the push of a single button, helium (He) gas purges volatile chemicals from a water sample and selectively captures the THMs in a preconcentrator trap. The trap is then heated to desorb the THMs and carry them in a He flow to a heated GC column that separates the THM components from Toxicological and epidemiological studies correlate THM exposures to adverse reproductive and developmental effects, and increased incidence of pancreatic, bladder, rectal and colon cancers.
  • 6. 6 SANDIA NATIONAL LABORATORIES • R&D 100 2012 • ENTRY SUBMISSION one another, with the individual THMs being detected by the nanoporous-carbon (NPC)-coated surface acoustic wave (SAW) device for analysis. These functions are shown schematically in Figure 2. The software program identifies each THM as it exits the GC column and analyzes their individual concentrations. The ability to obtain THM results quickly and reliably without sample preparation provides water treatment operators with the information they need to control the formation of THMS. Figure 2. The Parker THM Analyzer plumbing schematic Running a sample on the Parker THM Analyzer begins with collecting a treated water sample in a 40 mL EPA vial and pouring it into the sample holder that screws into the analyzer, shown on the left side of the analyzer in Figure 3. The operator then clicks on the “START” icon on the laptop screen, names the sample, clicks “OK”, and waits only 28 minutes for the detailed results. Figure 3. Analyzer and laptop for system control and analysis “Purge” is to release the volatile gases from water by bubbling air or some inert gas. “Trap” is to trap the volatile gases one is interested in detecting. We use a preconcentrator that preferentially holds, or traps, the THM gases.
  • 7. 7 SANDIA NATIONAL LABORATORIES • R&D 100 2012 • ENTRY SUBMISSION The software can display the results in several easy-to-interpret ways for the operator’s convenience. One example is shown in Figure 4. The data panel at the top tabulates the details of the chromatography. This particular result measured a 10 ppb standard sample for calibration purposes. The concentration of each THM is recorded separately, as well as totaled because the EPA currently regulates the Total THMs, or TTHMs, in treated water. In addition, the chromatogram itself is shown in the lower panel. Note that the SAW response peak heights get larger with the mass of the THMs. This is due to the higher sensitivity of the analyzer for the heavier THM molecules with higher boiling points, and is discussed in the reference Siegal, M. P.; Mowry, C. D.; Pfeifer, K. B., “Nanoporous-carbon coated surface-acoustic-wave device for the detection of sub-nanogram quantities of trihalomethanes,” submitted to Analytical Chemistry. The reports can be printed or pasted as an image into another document. In addition, the operator can transfer the data into Excel, Word, or other programs for later use. Figure 4. Analysis run window from the laptop program showing the processed chromatogram after a completed analysis run. The analyzer is easily calibrated by running a set of standard samples. The samples contain a mixture of each THM at a specific concentration. The software package tabulates this data and provides an easy-to-understand display. A calibration for chloroform is shown in Figure 5, plotting the SAW response peak heights against the known concentrations. The breakthrough that enables this miniature and inexpensive detector is our development and use of NPC sorbent coatings on the SAW device.
  • 8. 8 SANDIA NATIONAL LABORATORIES • R&D 100 2012 • ENTRY SUBMISSION Figure 5. Calibration window for viewing current and previous calibrations The accuracy and reliability of THM analysis was performed independently at several water plants around the country, each using an EPA Certified Laboratory for comparison. Table 1 shows a sample from the Nevada water plant where each THM was measured independently. Note that the Parker THM Analyzer is always within ± 10 – 15 % of the EPA certified lab measurements, with the individual THM results within ± 2 ppb. Table 1. THM and TTHM results from a Nevada Water Plant and an EPA Certified Laboratory Tables 2, 3, and 4 show similar TTHM results from water plants in Alabama, Texas, and South Carolina, all compared to an EPA certified laboratory. Most water utilities focus on the TTHM level because that is what the EPA presently regulates. Again, all the results agree within ± 10 – 15 % and ± 7 ppb for TTHM. Parker has hit a home run with this instrument – Professor Christopher M. Miller, Department of Civil Engineering, The University of Akron
  • 9. 9 SANDIA NATIONAL LABORATORIES • R&D 100 2012 • ENTRY SUBMISSION Table 2. TTHM results from an Alabama Water Plant and an EPA Certified Laboratory Table 3. TTHM results from a Texas Water Plant and an EPA Certified Laboratory Table 4. TTHM results from a South Carolina Water Plant and an EPA Certified Laboratory 11. Building Blocks of Our Technology Crucial factors for the development of this remarkable breakthrough technology include the use of NPC as a sorbent material for SAW device sensors and the ability to optimize it to achieve parts-per-billion to parts-per-trillion detection levels depending on the analyte. Parker and Sandia have worked together on the development of this NPC-coated SAW sensor system for THM detection since 2006. Since our R&D 100 Award submission two years ago for a prototype device, Parker has greatly improved the overall system by transforming the original briefcase- sized detector into a small table-top instrument (Figure 1), accommodated all electrical circuitry onto a single PC board, improved the GC, modified the trap (now also allowing for easy replacement), and is presently marketing the Parker THM Analyzer based on this technology. The NPC-coated SAW sensor is the heart of the product. We focus pulsed 248- nm radiation from a krypton fluoride (KrF) excimer laser to ablate a rotating
  • 10. 10 SANDIA NATIONAL LABORATORIES • R&D 100 2012 • ENTRY SUBMISSION graphite target, as shown in Figure 6. We control the kinetic energy of the ablated carbon species by introducing a controlled pressure of argon (Ar), ranging from 100 – 200 mTorr, into the pulsed laser deposition (PLD) vacuum chamber. As the Ar background pressure increases, the kinetic energy of the ablated species decreases, resulting in lower NPC mass densities. We have reported mass densities ranging from 0.08 – 2.0 g/cm3 . Figure 6. Photograph of the pulsed-laser deposition process used to create nanoporous-carbon films. We grow NPC directly onto ST-cut quartz surfaces between the 97 MHz gold interdigitated transducers of a SAW delay line, shown in Figure 7(a), using PLD. NPC self-assembles during deposition and consists of nano-fragments of several aligned graphene sheets that have interplanar spacings expanded by as much as 55% compared to crystalline graphite. Intercalation of molecules into graphite is well known. Increasing the interplanar spacing eases the diffusion of gas analyte molecules both in and out of NPC. The ideal NPC mass density is both a function of this nanoporosity and the mechanical integrity of the material in order to pass a surface acoustic wave across a highly-disordered surface without a significant loss in signal strength. This combination of critical factors is optimized for NPC coatings with mass density ~ 1.0 g/cm3 . Figure 7(b) is a scanning electron microscope (SEM) image showing the surface morphology of an optimized NPC film coating, which despite its apparent roughness, is still sufficiently mechanically stiff to pass the acoustic wave. Figure 7(c) is a transmission electron microscope (TEM) image showing the internal structure of optimized NPC. The dark lines are actually individual planes of graphene sheet segments. (Graphene is a one-atom thick layer of carbon atoms.)
  • 11. 11 SANDIA NATIONAL LABORATORIES • R&D 100 2012 • ENTRY SUBMISSION We find two structural features that help explain the ability for NPC to act as such a strong absorbent for volatile chemicals. First, the yellow arrow points to a void with a diameter ~ 1 nanometer that can store analyte molecules. Second, and more significantly, the yellow line crosses over several aligned graphene sheet fragments. The average distance between these fragments is ~ 0.45 nanometers, compared to 0.35 nanometers for crystalline graphite. NPC consists of these small graphene sheet clusters clumped together in every possible direction – very much like grains of sand on the beach, where each grain is analogous to a cluster. These clusters are separated by domain, or grain, boundaries. This image shows that such boundaries exist every few nanometers. Essentially, NPC is an all-grain-boundary material whose internal crystalline structure is expanded, with both features enabling rapid diffusion in and out of the material, with nearly every internal graphene sheet fragment acting as an available surface for chemical sorption. Figure 7. (a) Photo of an NPC-coated 100 MHz SAW device on a U.S. quarter. This device replaces either a full chemistry laboratory or a mass spectrometer for detecting the presence of THMs to below ppb levels. (b) SEM image showing a 1-micrometer-thick NPC film surface with an optimized mass density of 1 g/cm3 , exhibiting lots of ‘nooks and crannies’ for chemical species to penetrate into the bulk of the film. (c) TEM image showing internal structure of an ultra-sorbent self-assembled NPC coating that represents the heart of our invention. The yellow arrow points to a nanopore with ~ 1 nanometer diameter. The yellow line crosses several graphene sheet fragments and finds that the interplanar spacing is ~ 0.45 nanometers. The limits-of-detection (LOD) of the optimized NPC-coated SAW sensor device are measured together by injecting quantified mixed solutions, ranging from 1.3 – 183 ppb directly into a GC column. (Note that this GC column is NOT the same as used in the Parker THM Analyzer and has NOT been optimized for these tests.) The results are shown in Figure 8(a). Figure 8(b) is an expanded view of the testing performed for the lowest THM concentration solutions. The THMs are released from the GC in order of their molecular weights, which also corresponds to their boiling points. Therefore, chloroform is released first, followed by dichlorobromoform, dibromochloroform, and finally bromoform.
  • 12. 12 SANDIA NATIONAL LABORATORIES • R&D 100 2012 • ENTRY SUBMISSION Figure 8. (a) The peak response of an optimized NPC-coated SAW device to all four THMs at exposure levels of 1.3, 9, 93, and 183 ppb. (b) An expanded view of the responses for the lowest THM exposure levels tested. The raw data from Figure 8 is analyzed to quantify the SAW response of each THM as a function of total exposure. This can be done either by determining the maximum response for each THM (as is currently done by the Parker THM Analyzer), or by integrating the total area under each response peak. While the latter method provides greater sensitivity, the former method is more than sufficient to meet the needs of the water utility industry to assist in compliance with EPA regulations. Figure 9. Analysis of the NPC-coated SAW device responses to various exposures using the maximum SAW device response for each analyte. This method is used in the current Parker THM Analyzer software. Figure 9 plots the THM peak heights vs. known concentrations. The thick dashed lines through the data points are a best fit. To measure the LOD for each THM, the minimum SAW response above the noise level must be determined. This is estimated from Figure 8(b). The noise-level is approximately 0.15˚ with a standard
  • 13. 13 SANDIA NATIONAL LABORATORIES • R&D 100 2012 • ENTRY SUBMISSION deviation of 0.07˚. A SAW response three-times greater than the standard deviation of the noise level will provide a reliable detection limit. This sets the limit to 0.21˚ above the baseline and is shown in Figure 9 as a dashed horizontal line. The intersection of the thin lines extrapolated from the power-law to this detection limit provides the LOD for each individual THM and is listed as parts-per-trillion in Table 5. The LODs for CF, DCBM, DBCM, and BF are 440, 150, 110 and 100 ppt, providing precision and accuracy well in excess of EPA regulations. Table 5. THM limits-of Detection (LODs) determined from both the peak height and integrated peak methods using an optimized NPC-coated SAW device sensor. Figure 10. Analysis of the NPC-coated SAW device responses to various exposures using the integrated peak SAW device response for each analyte. As noted above, the data from Figure 8 can be analyzed more accurately by integrating the total area under each analyte response peak. These are plotted in Figure 10. The thick dashed lines through the data points are a best fit. To The Parker THM Analyzer provides precision and accuracy well in excess of EPA regulations.
  • 14. 14 SANDIA NATIONAL LABORATORIES • R&D 100 2012 • ENTRY SUBMISSION measure the LOD for each THM, the minimum SAW response above the noise level using this method must be determined. This can again be estimated from Figure 8(b), and is shown as a dashed horizontal line in Figure 10. The intersection of the thin lines extrapolated from the power-law to this detection limit provides the LOD for each individual THM and is also listed in parts-per-trillion in Table 5. These LODs for CF, DCBM, DBCM, and BF are 77, 18, 0.7, and 0.3 ppt, significantly better than the peak height analysis used by the current Parker THM Analyzer software, and offering a simple improvement to gain several orders-of-magnitude of improved sensitivity for DBP analysis without making any physical changes to the existing product. 12. Product Comparison Many methods for measuring THM concentrations in water exist. Most typically have four sequential processes: purge, trap, separate, and detect. The first three are routine. Purge involves bubbling, or sparging, a gas through a specific volume of water for a sufficient period of time to extract all the volatile organic chemicals (VOCs) from the water into a gas phase. This gas flow passes through a collector, or preconcentrator, that traps VOCs but allows water vapor to pass through. The preconcentrator material is typically specific for whatever VOCs are of interest. Tenax® TA, a porous polymer resin based on 2.6-diphenylene oxide, is commonly used for THMs. Upon heating, the collector releases the trapped species that then enter a separator, such as a gas chromatograph. Finally a detector senses the presence of VOCs, including THMs. A variety of detectors can be used in combination with GC, such as mass spectrometry (MS). GC-MS is a highly sensitive method for THM detection in water and was used to discover many DBPs in water 18 . THM limits-of-detection range from parts per billion to a few parts per trillion.19, 20, 21 A more common THM detector for GC is electron capture detection (ECD).22 Used in combination with purge and trap, GC-ECD can also achieve LODs < 1 ppb for individual THM detection; however, all of these methods require some form of sample preparation.23, 24, 25, 26, 27, 28 Other detectors with GC have also been successfully demonstrated, including microwave plasma emission,29 thermal conductivity detection,30 and atomic emission detection.31 There are also several other methods that measure THM concentrations without the use of a separation procedure. These include Fourier transform infrared (FT-IR) spectroscopy using attenuated total reflectance elements; however, the “Because of the new-found convenience of being able to perform THM analyses in- house in 30 minutes, and the cost savings per sample, we are now more proactive than ever before about collecting THM samples.” – Jeff Pendergrass, Water Treatment Plant Supervisor, Scottsboro, Alabama Water, Sewer, and Gas Board
  • 15. 15 SANDIA NATIONAL LABORATORIES • R&D 100 2012 • ENTRY SUBMISSION LODs are not as sensitive as the GC methods.32, 33 Ultrasonication has been used to break carbon-chlorine (C-Cl) bonds, followed by detecting changes in Cl-1 ion concentration via pH/ion selective electrode meters; however, this method requires significant sample preparation, cannot distinguish the origin of Cl-1 ions, and has limited sensitivity.34 Fluorescence spectroscopy has been used to measure both Total Trihalomethanes (TTHMs) and total haloacetic acid (another DBP) concentrations; however, it requires a chemical reaction with nicotinamide and cannot measure DBPs independently.35, 36 Impedance spectroscopy based on analyte adsorption onto a surface has also been utilized. Detection of brominated DBPs has been demonstrated from analyte adsorption onto ten different conducting polymer coatings on gold microelectrode sensing units; however, the combinations of polymers necessary to identify a large number of mixed chemicals, such as exist in real water samples, can become large.37 Surface acoustic wave device sensors offer greater resolution; an array of six SAW device sensors was demonstrated to detect VOCs in water in combination with purge-and-trap methods; however, similar to the impedance spectroscopy study, it requires a sophisticated pattern recognition program to deconvolute the resulting data, becoming both more complex and less reliable as the number of individual VOCs present in a given sample increase.38 SAW devices have been studied more extensively as gas phase sensors.39 SAWs measure the mass of materials that absorb to their surface as a fundamental change in the propagation speed of a surface wave as a function of surface mass density. This effect can be observed as a shift in center frequency of the transfer function in frequency space or a phase change in the time domain. Small shifts in the device wave propagation speed relate to the sorption of species. Sorbent coatings, such as polymers or sol gels, are used to enhance this frequency shift by allowing greater mass to adhere onto the surface.40, 41 An effective SAW coating must be able to both sorb the desired gases and transmit an acoustic wave across its surface without a significant insertion-loss increase. This latter condition places additional requirements on an effective SAW coating. It must be sufficiently rigid to maintain the acoustic wave and have minimal residual stress such that the coating does not buckle or crack, and hence, dampen the wave. Also, the coating cannot be discontinuous: all particles, grains, domains, etc., must maintain good physical contact with the substrate to enable the passing of a surface wave.
  • 16. 16 SANDIA NATIONAL LABORATORIES • R&D 100 2012 • ENTRY SUBMISSION Assuming these parameters are met, there also exists a thickness constraint for a coating; too much mass will dampen a surface acoustic wave, limiting the relative response to analyte sorption. These critical coating requirements are met with nanoporous-carbon (NPC). NPC is a nanocrystalline-to-amorphous form of graphite that has no residual stress, is thermally stable to 600˚C, and is hydrophobic (advantageous for a water testing material). NPC grows at room temperature on any substrate surface using line-of-sight pulsed-laser deposition. Mass density, and hence porosity and surface area, can be controlled by the deposition energetics from 2.0 g/cm3 to less than 0.1 g/cm3 . The internal structure of NPC self-assembles during growth and mainly consists of nano-fragments of several aligned graphene sheets that have interplanar spacings expanded by as much as 55% compared to crystalline graphite. Intercalation of molecules into graphite is well known. Increasing the interplanar spacing eases the diffusion of species both in and out of NPC.43 NPC even demonstrates a large capacity to store alkali ions for electrochemical capacitors and energy storage applications with relatively high charge and discharge rates.44 More relevantly, NPC-coated SAW devices have been used to detect a large variety of VOCs, similar to the THMs, with results suggesting LODs well below 1 ppb for most of the analytes tested.45 Comparison Matrix
  • 17. 17 SANDIA NATIONAL LABORATORIES • R&D 100 2012 • ENTRY SUBMISSION Improvements Over Competitive Products The US-EPA passed in March 2006 and began implementing in January 2012 the Stage 2 Disinfectants and Disinfection Byproducts Rule (DBPR) to reduce potential cancer risks and address concerns with potential reproductive and developmental risks from DBPs. The Stage 2 DBPR is designed to reduce the level of exposure from DBPs without compromising the control of microbial pathogens. A main component of this rule is to reduce to below 80 ppb the concentration of total THMs that are present in water disinfected with chlorine or chloramine. Furthermore, while TTHM is monitored for compliance, its presence is representative of many other chlorination DBPs that also occur in water, so a reduction in TTHM generally indicates an overall reduction of DBPs. Previously, the rule required water plants serving a population base > 10,000 people to only report the average of four TTHM measurements taken from different places within their plant and distribution system. However, a recent rule change requires all four site measurements be reported independently and be below 80 ppb TTHM. The EPA currently recognizes TTHM measurements performed using approved EPA analytical chemistry methods. The continuous cost of having these analyses performed by outside vendors gets very high. Furthermore, under best-case scenarios, a water utility get results within a few days, during which time finished drinking water is delivered to everyone within the district served by that utility. The Hach THM Plus systems are low-cost tools to help provide water utilities with in-house TTHM data that can be used to more closely monitor the usage of treatment chemicals without constantly going through the EPA certified laboratories. Some shortcomings in the Hach systems include the requirement of a skilled worker to prepare water samples for TTHM analysis, the ongoing costs for sample preparation kits, the time (several hours) for a single laborious sample prep and measurement, the limited resolution (10 ppb), and the fact that the individual THMs cannot be determined, just the four THMs in aggregate. In addition, the Hach THM Plus methods can result in false positives due to interference from other chlorinated DBPs. These considerations place severe constraints on the utility and limit the overall usefulness of the device, preventing the Hach product line from truly being competitive with the Parker THM Analyzer. The Inficon systems provide significantly better information than the Hach instrumentation, indeed more than sufficient to meet the requirements of the EPA regulations. Similar to the Parker THM Analyzer, these gas chromatography and The Parker THM Analyzer is the only cost-effective chemical detection system that reports each chemical separately and detects low levels (< 1 ppb) of all four THMs.
  • 18. 18 SANDIA NATIONAL LABORATORIES • R&D 100 2012 • ENTRY SUBMISSION GC/mass spectrometry instruments can measure individual THM levels to limits ranging from 1 ppt to 1 ppb. However, the Inficon systems range in cost from $45,000 to $140,000 for a complete analytical system and require a significant level of personnel training to operate and interpret the results. The Parker THM Analyzer is the only cost-effective chemical detection system that reports each chemical separately and detects low levels (< 1 ppb) of all four THMs. The Parker THM Analyzer combines all the necessary system features (purge, trap, separate, and detect) using a low-cost, small, light-weight sensor based on mature SAW device technology, but greatly improved with highly sensitive, reliable, reproducible, and thermally stable NPC-sorbent coatings. The use of NPC-coated SAW sensor devices enables the Parker THM Analyzer to achieve the detection resolution and speciation of the high-cost Inficon product lines, but at significantly lower cost. Most importantly, the Parker THM Analyzer is easier to use than any of the competitive products, requiring significantly less training and lower skill levels to perform chemical analyses: simply pour in the water and push a single button! Limitations of product • The Parker THM Analyzer is not an online or in-process instrument. Parker’s THM Analyzer is designed to perform analysis on grab-samples taken from multiple collection sites. While an on-line instrument could offer municipal plant operators continuous process monitoring feedback at one site, customer discovery indicated most operators preferred the ability to analyze samples taken from multiple collection sites to control the process from initial raw water treatment to clear well and on throughout the distribution system. • Parker’s THM Analyzer is not portable The THM Analyzer is a transportable, tabletop design weighing approximately 14 pounds. It was developed to operate in a plant lab environment and can easily be transported from one plant to another. • The Parker THM Analyzer does not feed data directly to a SCADA (Supervisory Control and Data Acquisition) system. The Analyzer’s grab-sample design configuration allows users the flexibility to input custom sample names and information by collection site. Full report features and data logging are supported. • Parker’s THM Analyzer is not EPA Certified. The Parker THM Analyzer is a process-monitoring instrument designed to Our product is easier to use than any of the competitive products, requiring significantly less training and lower skill levels: simply pour in the water and push a single button!
  • 19. 19 SANDIA NATIONAL LABORATORIES • R&D 100 2012 • ENTRY SUBMISSION provide municipal water treatment plants with timely data that can be used to control their process and optimize the efficiency of their operation. It is not an US-EPA-compliance instrument and does not replace the need for US-EPA- required compliance testing. This is also true for other competitive products on the market. 13. Product Use Principal Applications and Benefits The Parker THM Analyzer will greatly benefit public health and safety by enabling on-site detection of hazardous chemicals in the nation’s water supplies at lower levels in real time. Furthermore, past work at Sandia demonstrates this technology is easily extended to detect other volatile organic and toxic industrial compounds, both in solution and in air, at similar levels, i.e., near part-per- trillion limits-of-detection. Three hundred million people in the United States rely on public water systems for safe, clean water. One hundred years ago, typhoid and cholera epidemics were common throughout American cities. Disinfection, typically using chlorine, was a major factor in reducing these epidemics and is still an essential part of water treatment today. In 1990, the US-EPA Science Advisory Board cited drinking water contamination as one of the most important environmental risks and indicated that disease-causing microbial contaminants (i.e., bacteria, protozoa, and viruses) were still the greatest remaining health-risk management challenge for drinking water suppliers. This recognition was prompted by the concern about the number of waterborne disease outbreaks in the United States, with over 500,000 cases of waterborne disease reported between 1980 and 1994. In 1993, an outbreak of Cryptosporidium, a microbial pathogen, caused 403,000 people in Milwaukee to experience intestinal illness;46 over 4,000 were hospitalized, and at least 104 deaths were attributed to the disease.47 Not surprisingly, these problems exist throughout the world. The Safe Drinking Water Act (SDWA) was first passed by Congress in 1974 and amended in 1986 and 1996. The US-EPA requires all public water systems to closely monitor pathogen levels, including a few types of bacteria, viruses, protozoa, and other organisms, which are frequently a result of fecal matter from sewage discharges, leaking septic tanks, and runoff from animal feedlots into bodies of water. Three hundred million people in the United States rely on public water systems for safe, clean water.
  • 20. 20 SANDIA NATIONAL LABORATORIES • R&D 100 2012 • ENTRY SUBMISSION As chemical detection developed over the years, scientists and engineers gained greater abilities to identify and measure exactly what is in our water supplies. Ironically, chemical treatment of drinking water that is critical for health, such as chlorine, ozone, and chlorine dioxide, also react with trace natural organic matter to create disinfection byproduct chemicals, such as the trihalomethanes. The presence of THMs in the water supply was first reported in 1974.48 Different DBPs result from different combinations of source water and disinfection processes, but, in fact, only a few are monitored and regulated by the US-EPA. A major challenge for water suppliers is how to balance the risks from microbial pathogens and DBPs. The 1996 amendments to the SDWA required the US-EPA to develop rules to achieve these goals. In December 1998, the EPA established the Stage 1 Disinfectants/ Disinfection By-products Rule, requiring all public water systems to use treatment measures that reduce the formation of DBPs and meet specific standards. Today, TTHMs are regulated at a maximum allowable annual average of 80 ppb. THMs are characterized in the “suspected negative health effects” category, and epidemiological and toxicological studies at high doses of THMs demonstrate clear adverse reproductive and developmental effects, while some low-dose studies show an association, rather than a causal link, to bladder, rectal, and colon cancers. While the degree of risk has long been debated, the US-EPA requires measurement and reporting of THMs in our water, preferring to err on the side of safety while scientists continue studying these correlations. The true variation in THM concentrations for any utility is not known, but generally is assumed to vary daily due to a variety of source quality and treatment factors. Indeed, seasonal variations are known due to the increased abundance of natural organics in water during warmer weather. Unfortunately, the US-EPA is forced to balance the health risks with the low costs of provision by water consumers, and therefore only requires testing and reporting quarterly or annually, depending on the size of the utility. Because of the unknown risk of each individual THM, the difficulty in providing simultaneous individual measurements, and the natural variation by locality, the four THMs are reported together as a group. In order to meet the 80 ppb regulation for Total THMs, many utilities are considering changing their disinfection process to an alternative, but less- understood process using chloramine-based chemicals. There are known DBPs
  • 21. 21 SANDIA NATIONAL LABORATORIES • R&D 100 2012 • ENTRY SUBMISSION generated by this process as well, however, there is little data suggesting that they have lowered risk factors. It is conceivable that increased knowledge of THM levels will influence utility decisions regarding the switch to chloramines. The ability to detect each THM separately with rapid and low-cost technology will have wide-ranging impacts on the 300 million water consumers in the U.S., their utilities, and the epidemiological community. Implementation of the Stage 1 DBP Rule requires utilities to take samples across their distribution network to determine approximate variations and concentration excursions. Enabling utilities to measure THMs quickly and cheaply will allow them to: a. monitor and optimize their disinfection processes for increased safety and regulatory compliance, and b. save money by more precisely determining locations to collect laboratory samples, reducing the cost of compliance and monitoring. The ability to detect each THM separately with on-site and rapid detection technology will enable the epidemiological community to perform lower- cost studies that also have improved data quality and frequency because the measurements are: a. in situ (local and not sent back to the lab) b. more rapid (30 minutes versus waiting weeks for lab results) c. economical due to no laboratory testing expenses. The Parker THM Analyzer will enable improved risk assessments and understanding of local variations, providing long-term health benefits to water consumers. Other Applications While the initial focus of our product is monitoring THMs in water, we have demonstrated detection of other chemicals of commercial value and health interest. This includes both water and air analysis. Some specific examples are discussed below, but the great advantage of the NPC-coated SAW is its sensitivity and non-specific nature – potentially useful in a variety of chemical monitoring applications. The analyzer system is not limited to THMs in water. A host of chemical contaminants can be detected. Figure 11 shows the analysis, using the physical system without modification, of a water sample containing ppb
  • 22. 22 SANDIA NATIONAL LABORATORIES • R&D 100 2012 • ENTRY SUBMISSION levels of several common fuel components of concern in fuel storage and water quality applications. Figure 11. Analysis of a water sample containing common fuel components. Other hazardous solvents of concern to drinking water and wastewater applications include chlorinated compounds such as those detected by the system and shown in Figure 12. We anticipate additional applications with respect to water monitoring. The measurement of chemicals in water is important for issues ranging from: • Homeland Security • regulatory compliance • taste and odor concerns • remediation • containment, cleanup, or tracking of chemical spills. Figure 12. Analysis of hazardous chlorinated compounds We also anticipate that this technology will be useful for air monitoring. Only slight modifications will be required to collect and analyze air samples. The speed and cost effectiveness of the system will allow, for example, occupational health exposure monitoring. Breath monitoring in health-system settings or for disease research is also anticipated.
  • 23. 23 SANDIA NATIONAL LABORATORIES • R&D 100 2012 • ENTRY SUBMISSION Sandia has demonstrated NPC-coated SAW sensor devices detecting airborne chemicals that are critical to public health and national security needs, including volatile organic compounds (VOC), toxic industrial chemicals (TIC), chemical warfare agents (CWA), and explosive and explosive residue compounds, such as triacetone triperoxide (TATP), used in failed terrorist attempts on airliners. Nearly all of these compounds are detected as readily as the THMs shown in this application to LODs ranging from 1 ppb to better than 1 ppt. Figure 13 demonstrates detection using a heated SAW of explosives-related compounds. The ability to use a heated SAW makes the system useful for industrial applications and is unique among coated-SAW developments. Figure 13. Detection of explosives related compounds using a heated SAW. Sandia has also applied NPC coatings as the adsorbent material for micropreconcentrator devices where the analyte of interest is semi-volatile, such as those commonly used for CWA and explosives. Such devices are routinely flash heated to elevated temperatures near 200˚C to release the captured analytes into some analytical system (GC, SAW, mass spectrometer, etc.). However, high residual stresses in commonly used polymer or sol-gel coatings lead to film delamination and membrane cracking with thermal cycling, constraining films to submicrometer thicknesses that limit the available adsorbent surface area. The NPC coatings do not have these limitations. NPC-coatings for both SAW-coated sensors and preconcentrators can be readily configured to develop a portable detection system for airborne chemicals with minor alterations to the present configuration, greatly expanding its field-of-use beyond chemical detection in aqueous systems. NPC-coated SAW sensor rapidly detects airborne chemicals that are critical to public health and national security needs: volatile organic compounds, toxic industrial chemicals, and chemical warfare agents.
  • 24. 24 SANDIA NATIONAL LABORATORIES • R&D 100 2012 • ENTRY SUBMISSION 14. Summary The Parker THM Analyzer is an integrated purge-and-trap gas chromatograph that provides results without sample preparation. This device can help operators optimize water treatment at the plant and evaluate water age in the distribution system for improved control over the formation of THMs. The Parker THM Analyzer provides drinking water treatment plants and water distribution facilities with an important tool to help deliver safe drinking water to the public. The Parker THM Analyzer provides high-precision, high-accuracy measurement of THMs and offers a full complement of calibration and quantification routines. With the push of a button, the analyzer provides sample purging, THM component separation, precise and accurate detection, and data analysis. Offered in a complete analytical package, the Parker THM Analyzer features a touch screen for status indication and basic data results displays. Analyzer calibration is streamlined with detailed menu options, while push-button operation simplifies building calibration curves and quantifying sample results. This cost-effective, tabletop technology replaces an entire chemical laboratory. It provides easy-to-use, on-site analysis with no sample preparation of DBPs at water utilities in 30 minutes (compared to the current times of days to weeks), greatly benefiting public health and safety. It is the only cost-effective tabletop sensor system with better than ppb LOD levels for each THM simultaneously, greatly enhancing the information necessary for epidemiological and toxicological studies of these hazardous disinfection byproducts. Furthermore, testing demonstrates the ability to readily detect many different chemicals in water, including volatile organic compounds, toxic industrial chemicals, and explosive-related compounds. Identification of these chemicals in a laboratory, followed by a simple calibration similar to what we have performed for the THMs, will enable the analyzer to monitor a multitude of chemicals simultaneously. Previously, only expensive mass spectrometry techniques have been capable of individually detecting each of these other water contaminants in a mixed sample to ppb levels. The Parker THM Analyzer, with its ease of measurement at reasonable cost, can enable the US-EPA to regulate additional chemicals in the future and further improve the safety of our municipal drinking water systems. The Parker THM Analyzer provides high- precision, high-accuracy measurement of THMs and offers a full complement of calibration and quantification routines. With the push of a button, the analyzer provides sample purging, THM component separation, and data analysis.
  • 25. 25 SANDIA NATIONAL LABORATORIES • R&D 100 2012 • ENTRY SUBMISSION Finally, the small size and relatively low-cost of this system also suggest future use as a permanent in situ diagnostic providing real-time monitoring of disinfection processes. Such measurement improvements will not only create a safer finished drinking water supply for the public, but can also help reduce the costs to municipalities for their disinfection processes, and hence, lower the costs to the ultimate users of the drinking water. 15. Affirmation By submitting this entry to R&D Magazine I affirm that all information submitted as a part of, or supplemental to, this entry is a fair and accurate representation of this product. Michael P. Siegal
  • 26. 26 SANDIA NATIONAL LABORATORIES • R&D 100 2012 • ENTRY SUBMISSION Appendix A: Submitter Information 1. Contact person to handle all arrangements on exhibits, banquet, and publicity. Glenn Kubiak Director, Sandia National Laboratories P. O. Box 969, Mail Stop 9405 Livermore, CA 94551-0969 USA 925-294-3375 Fax: 925-294-3403 kubiak@sandia.gov 2. Contact person for media and editorial inquiries. Glenn Kubiak Director, Sandia National Laboratories P. O. Box 969, Mail Stop 9405 Livermore, CA 94551-0969 USA 925-294-3375 Fax: 925-294-3403 kubiak@sandia.gov APPENDICES
  • 27. 27 SANDIA NATIONAL LABORATORIES • R&D 100 2012 • ENTRY SUBMISSION Appendix B: Development Team Information Donald L. Overmyer Member of the Technical Staff Sandia National Laboratories P.O. Box 5800, Mail Stop 1415 Albuquerque, NM 87185-1415 USA 505-844-5435 Fax: 505-844-5470 dloverm@sandia.gov Curtis D. Mowry Senior Member of the Technical Staff Sandia National Laboratories P.O. Box 5800, Mail Stop 1415 Albuquerque, NM 87185-0886 USA 505-844-6271 Fax: 505-844-2974 cdmowry@sandia.gov Kent B. Pfeifer Principal Member of the Technical Staff Sandia National Laboratories P.O. Box 5800, Mail Stop 1415 Albuquerque, NM 87185-1425 USA 505-844-8105 Fax: 505-844-1198 kbpfeif@sandia.gov
  • 28. 28 SANDIA NATIONAL LABORATORIES • R&D 100 2012 • ENTRY SUBMISSION Appendix B: Development Team Information (cont.) Alex Robinson Principal Member of the Technical Staff Sandia National Laboratories P.O. Box 5800, Mail Stop 1415 Albuquerque, NM 87185-1080 USA 505-844-9520 Fax: 505-844-2081 arobins@sandia.gov William M. Cost Applications Engineer Parker Hannifin, Instrumentation Products Division 1005 A Cleaner Way Huntsville, Alabama, 35805 USA 256-885-3810 wcost@parker.com Mike Doutt Senior Project Engineer Parker Hannifin, Instrumentation Products Division 1005 A Cleaner Way Huntsville, Alabama, 35805 USA 256-885-3834 mdoutt@parker.com Glenn Geis Project Engineer - Systems Parker Hannifin, Instrumentation Products Division 1005 A Cleaner Way Huntsville, Alabama, 35805 USA 256-885-3871 ggeis@parker.com
  • 29. 29 SANDIA NATIONAL LABORATORIES • R&D 100 2012 • ENTRY SUBMISSION Appendix B: Development Team Information (cont.) John A. Morse New Business Development Manager Parker Hannifin, Instrumentation Products Division 1005 A Cleaner Way Huntsville, Alabama, 35805 USA 256-885-3850 jmorse@parker.com
  • 30. 30 SANDIA NATIONAL LABORATORIES • R&D 100 2012 • ENTRY SUBMISSION Appendix C: Patent Application Electronic Acknowledgement Receipt EFS ID: 10897864 Application Number: 61531974 Confirmation Number: 5183 International Application Number: Title of Invention: ANALYTICAL SYSTEM AND METHOD FOR DETECTING VOLATILE ORGANIC COMPOUNDS IN WATER First Named Inventor/Applicant Name: Kazi Z. A. Hassan Customer Number: 49458 Application Type: Provisional Time Stamp: 18:10:23 Filing Date: Receipt Date: 07-SEP-2011 Attorney Docket Number: P157P0028US Filer Authorized By: Filer: Michael P. Wendolowski Payment information: Submitted with Payment yes Payment was successfully received in RAM $220 Payment Type Credit Card RAM confirmation Number 8206 Deposit Account 180988 Authorized User WENDOLOWSKI,MICHAEL P. The Director of the USPTO is hereby authorized to charge indicated fees and credit any overpayment as follows: Charge any Additional Fees required under 37 C.F.R. Section 1.16 (National application filing, search, and examination fees) Charge any Additional Fees required under 37 C.F.R. Section 1.17 (Patent application and reexamination processing fees)
  • 31. 31 SANDIA NATIONAL LABORATORIES • R&D 100 2012 • ENTRY SUBMISSION Appendix C: Patent Application (cont.)
  • 32. 32 SANDIA NATIONAL LABORATORIES • R&D 100 2012 • ENTRY SUBMISSION Appendix D: Letters of Support
  • 33. 33 SANDIA NATIONAL LABORATORIES • R&D 100 2012 • ENTRY SUBMISSION Appendix D: Letters of Support (cont.)
  • 34. 34 SANDIA NATIONAL LABORATORIES • R&D 100 2012 • ENTRY SUBMISSION Appendix D: Letters of Support (cont.)
  • 35. 35 SANDIA NATIONAL LABORATORIES • R&D 100 2012 • ENTRY SUBMISSION Appendix D: Letters of Support (cont.)
  • 36. 36 SANDIA NATIONAL LABORATORIES • R&D 100 2012 • ENTRY SUBMISSION Appendix D: Letters of Support (cont.)
  • 37. 37 SANDIA NATIONAL LABORATORIES • R&D 100 2012 • ENTRY SUBMISSION Appendix D: Letters of Support (cont.)
  • 38. 38 SANDIA NATIONAL LABORATORIES • R&D 100 2012 • ENTRY SUBMISSION Appendix E: References 1 D.A. Savitz, K.W. Andrews, and L.M. Pastore, Environ. Health Persp. 103, 592 (1995). 2 M.D. Gallagher, J.R. Nuckols, L. Stallones, and D.A. Savitz, Epidemiol. 9, 484 (1998). 3 K. Waller, S.H. Swan, G. DeLorenze, and B. Hopkins, Epidemiol. 9, 134 (1998). 4 L. Dodds, W. King, C. Woolcott, and J. Pole, Epidemiol. 10, 233 (1999). 5 S.R. Bielmeier, D.S. Best, D.L. Guidici, and M.G. Narotsky, Tox. Sci. 59, 309 (2001). 6 M.D. Kramer, C.F. Lynch, P. Isacson, and J.W. Hanson, Epidemiol. 3, 407 (1992). 7 L. Dodds and W.D. King, Occup. Environ. Med. 58, 443 (2001). 8 J.M. Wright, J. Schwartz, and D.W. Dockery, Occup. Environ. Med. 60, 173 (2003). 9 J.M. Wright, J. Schwartz, and D.W. Dockery, Environ. Health Persp. 112, 920 (2004). 10 A.F. Hinckley, A.M. Bachand, and J.S. Reif, Environ. Health Persp. 113, 1808 (2005). 11 C. Lewis, I.H. Suffet, and B. Ritz, Am. J. Epidemiol, 163, 38 (2006). 12 G.L. Carlo and C.J. Mettlin, Am. J. Pub. Health, 70, 523 (1980). 13 W.D. King and L.D. Marrett, Cancer Causes and Control, 7, 596 (1996). 14 K.P. Cantor, C.F. Lynch, M.E. Hildesheim, M. Dosemeci, J. Lubin, M. Alavanja, and G. Craun, Epidemiol. 9, 21 (1997). 15 C.M. Villanueva, K.P. Cantor, S. Cordier, J.J.K. Jaakkola, W.D. King, C.F. Lynch, S. Porru, and M. Kogevinas, Epidemiol. 15, 357 (2004). 16 M.E. Hildesheim, K.P. Cantor, C.F. Lynch, M. Dosemeci, J. Lubin, M. Alavanja, and G. Craun, Epidemiol. 9, 29 (1998). 17 G.A. Boorman, V. Dellarco, J.K. Dunnick, R.E. Chapin, S. Hunter, F. Hauchman, H. Gardner, M. Cox, and R.C. Sills, Environ. Health Persp. 107, 207 (1999). 18 S.D. Richardson, J. Environ. Monit. 4, 1 (2002). 19 L. Zoccolillo, L. Amendola, C. Cafaro, and S. Insogna, J. Chroma. A, 1077, 181 (2005). 20 M.A. Jochman, X. Yuan, and T.C. Schmidt, Anal. Bioanal. Chem. 387, 2163 (2007). 21 E. Aguilera-Herrador, R. Lucena, S. Cardenas, and M. Valcarcel, J. Chroma. A, 1209, 76 (2008). 22 T. Aoki and K. Kawakami, Wat. Res. 23, 739 (1989). 23 L. Lepine and J.-F. Archambault, Anal. Chem. 64, 810 (1992). 24 D.-H. Cho, S.-H. Kong, and S.-G. Oh, Wat. Res. 37, 402 (2003). 25 M.Y. Tominaga and A.F. Midio, Braz. J. Pharm. Sci. 39, 195 (2003). 26 R.-S. Zhao, W.-J. Lao, and X.-B. Xu, Talanta, 62, 751 (2004). 27 G.L. Emmert, G. Cao, C. Duty, and W. Wolcott, Talanta, 63, 675 (2004). 28 M.A. Brown and G.L. Emmert, Anal. Chim. Acta, 555, 75 (2006). 29 B.D. Quimby, M.F. Delaney, P.C. Uden, and R.M. Barnes, Anal. Chem. 7, 875 (1979). 30 A. Segal, T. Gorecki, P. Mussche, J. Lips, and J. Pawliszyn, J. Chromat. A, 873, 13 (2000). 31 N. Campillo, P. Vinas, I. Lopez-Garcia, N. Aguinaga, and M. Hernadez-Cordoba, J. Chromat. A, 1035, 1 (2004). 32 R. Gobel, R. Krska, R. Kellner, R.W. Seitz, and S.A. Tomellini, Appl. Spectr. 48, 678 (1994). 33 M.C. Ertan-Lamontagne, S.R. Lowry, W.R. Seitz, and S.A. Tomellini, Appl. Spectr. 49, 1170 (1995). 34 G.E. Orzechowska, E.J. Poziomek, V.F. Hodge, and W.H. Engelmann, Environ. Sci. Technol. 29, 1373 (1995). 35 Y. Nakahara, S. Yamamoto, and K. Kawakami, Fuji Elec. Rev. 43, 110 (1997).
  • 39. 39 SANDIA NATIONAL LABORATORIES • R&D 100 2012 • ENTRY SUBMISSION 36 G.L. Emmert, G. Geme, M.A. Brown, and P.S. Simone, Jr., Anal. Chim. Acta, 656, 1 (2009). 37 E.R. Carvalho, N.C. Filho, E.C. Venancio, O.N.O. Jr., L.H.C. Mattoso, and L. Martin-Neto, Sensors, 7, 3258 (2007). 38 W.A. Groves, A.B. Grey, and P.T. O’Shaugnessy, J. Envior. Monit. 8, 932 (2006). 39 R.C. Hughes, A.J. Ricco, M.A. Butler, and S.J. Martin, Science, 254, 74 (1991). 40 A.J. Ricco, G.C. Frye, and S.J. Martin, Langmuir, 5, 273 (1989). 41 R.C. Thomas, L. Sun, R.M. Crooks, and A.J. Ricco, Langmuir, 7, 620 (1991). 42 M.P. Siegal, D.L. Overmyer, R.J. Kottenstette, D.R. Tallant, and W.G. Yelton, Appl. Phys. Lett. 80, 3940 (2002). 43 M.P. Siegal, W.G. Yelton, D.L. Overmyer, and P.P. Provencio, Langmuir, 20, 1194 (2004). 44 S.J. Limmer, W.G. Yelton, M.P. Siegal and B.C. Bunker, Electrochem. Soc. Trans. 28, 89 (2010). 45 M.P. Siegal and W.G. Yelton, Adv. Sci. Technol. 48, 161 (2006). 46 W.R. MacKenzie, N.J. Hoxie, M.E. Proctor, M.S. Gradus, K.A. Blair, D. E. Peterson, J.J. Kazmierczak, D.G. Addiss, K.R. Fox, J.B. Rose, and J.P. Davis, New England J. Med., 331 (3), 161 (1994). 47 N.J. Hoxie, J.M. Vergeront, R.D. Nashold, and K.A. Blair, Am. J. Pub. Health, 87 (12), 2032 (1997). 48 J.J. Rook, Water. Treat. Exam. 23, 234 (1974).
  • 40. Exceptional service in the national interest Sandia National Laboratories is a multi-program laboratory managed and operated by Sandia Corporation, a wholly owned subsidiary of Lockheed Martin Corporation, for the U.S. Department of Energy’s National Nuclear Security Administration under contract DE-AC04-94AL85000