1. Kaushik Ramesh
Final Paper
1
pAcGFP1-Mem and GFP in cellular Membrane Experiments
Abstract
The GFP gene is a useful tool in cellular biology due to its green fluorescence.
By joining GFP gene to the gene of the protein of interest, researchers can see where
proteins are made, and where they can go. The same logic is applied to the vector
used in this experiment, pAcGFP1-Mem, which encodes for the Neuromodulin
protein. This protein localizes to the cellular membrane, which allows the
membrane to be observed through the GFP’s green fluorescence. In this experiment,
we transform the genome of the cell to hold this pAcGFP1-Mem vector. Through
various tests using Gel-electrophoresis and the selectable marker, we confirm the
successful transformation of the genome. Furthermore, we observe the green
fluorescence of the GFP ourselves through the use of a confocal microscope. Our
tests indicate that the transformation was successful and the confocal microscope
clearly showed that the membrane was highlighted by the GFP. The results of our
experiment indicate that transformation through the pAcGFP1-Mem vector can be a
fast, simple, and reliable method in experiments researching the cellular membrane.
Introduction
Being able to observe and analyze the membrane is an important step in
many different experiments. For example, it would be useful to examine the
mitochondria when testing for what effects osmosis has on the cell volume (1).
Experiments like these attempt to examine the membrane using imaging techniques
such as atomic force microscopy or more invasive techniques involving
fluorescence. But techniques involving fluorescence can cause issues because of the
2. 2
difficulty in labeling cells with fluorescence type proteins; the problems with using
fluorescence proteins include getting the genome to accept the gene and being able
to express the fluorescence. The pAcGFP1-Mem vector alleviates many of these
problems due to the ability to integrate the green fluorescence protein gene directly
into the desired genome.
Techniques involving the green fluorescent protein (GFP) are alluring
because the GFP gene can be integrated into many different organisms using vectors
and further maintained with breeding. GFP can be linked to cellular control factors
like promoters in order to study cell growth. For example, in a study by Kawaja, The
GFP was linked to promoters in order to study what triggers cells to grow in nerves;
when the nerves begin to grow, the cells start growing green (2). GFP can also be
used with antibodies. Like in the experiment by Leveau, GFP can be used and
measured with antibodies in order to determine if a culture of bacteria are growing
(3). Other uses for GFP include finding out if a protein binds to another cellular
protein, if a stem cell transplantation succeeded, and if cancer has reached its
metastasis point. Even if the GFP protein has folded incorrectly and is being
expressed in a non- fluorescence form, antibodies can bind to the malfunctioned
GFP and determine in what stage the failure occurred—for example, was there a
problem with, protein folding, protein synthesis, or gene expression.
In the experiments described here, the vector— pAcGFP1-Mem—was used to
provide a simple way to deliver the protein gene into the genome. Once this is done,
the GFP can be used in experiments in any of the ways previously mentioned. In this
report, we will provide a detailed analysis of the success of the pAcGFP1-Mem using
3. 3
tools like the confocal microscope and gel electrophoresis. This is to determine if
the pAcGFP1-Mem can deliver the GAP gene successfully into the genome in order to
conduct experiments like those mentioned above. If we find that the pAcGFP1-Mem
is very efficient at integrating the GAP gene into the genome and that the GFP is
being delivered to the cellular membrane properly, it can be utilized as a simple and
fast tool in any experiments involving membranes.
In conclusion, I believe that these experiments will show that the pAcGFP1-
Mem vector will be an indispensable tool in researching the cellular membrane
because of its simplicity and efficiency in transforming the target’s genome.
Hypothesis: pAcGFP1-Mem vector successfully integrates the GFP gene into the
genome. Also, GAP-43 localizes the GFP into the cellular membrane. The green
fluorescence on the cellular membrane is clearly visible and distinguishable from
the rest of the membranes on the cell.
4. 4
Methods
Plasmid
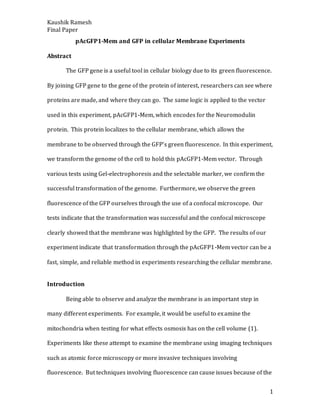
The plasmid contains a CMV promoter from 1 – 589. Three origins of replication
which are f1, SV40, and pUC. The f1 origin of replication allows for single stranded
replication and packaging. The SV40 is a mammalian origin of replication by NIH-
3T3 cells upon transfection. The pUC is the bacterial origin of replication and is able
to make a high copy number of around 500-700. The selectable markers are the
kanamycin and neomycin resistance genes and they are located at 2683 – 3211. The
neomycin resistance gene selects for prokaryotic cells while the kanamycin is made
for eukaryotes. There are also three restriction enzymes that are coded from this
vector: BamH 1 which is at the 661 location, Age 1 which is on 667, and Not 1 at
1456. They are all type 2 restricton enzymes which means that they wont be
effected by DNA methylase. They all also have an incubation temperature from
around 30-37°C and two of them have an inactivation temperature of 65°C; only
BamH 1 doesn’t have an inactivation temperature. Finally, there is a AcGFP1 fusion
gene from 679 – 1452.
Figure 1: pAcGFP1-Mem Vector
5. 5
Cell Culture
Four cell cultures were made. The setup:
1 – B-Gal Experimental
2 – B-Gal Control
3 – Membrane Vector Experimental
4 – Membrane Vector Control
The B-Gal E.coli was treated with Ampicilin while the Membrane culture was treated
with Kanamycin.
Gel Electrophoresis
The gel Electrophoresis was done to ensure that we had the succesful DNA
recovery in prokaryotes. The Gel and components can be seen in figure 3 and 4.
Microscope
To confirm the success of the GFP gene into the genome, we used a confocal
microscope to anaylze the green fluroscent within the cells.
Western Blotting and PCR preparation
By using Thermo Scientific NE-PER Nuclear and Cytoplasmic Extraction
reagents, we were able to separate cytoplasmic extracts from the cultured cells.
Adherent cells were harvested with trypsin and then centrifuged for 5 minutes at
500 x g. Suspension cells were centrifuged right away. Next, the cells were washed
with PBS and centrifuged once again. Finally, beofre the reagents were added, the
supernatant was discarded, leaving only the dry dell pellet. The CER I and CER II
reagents cause cell membrane disruption which, in turn, releases the cytoplasmic
6. 6
contents. The reagents must be kept in ice cold before the experiment and the
sample must be vortexed for 15 seconds and incubated for 10 minutes after adding
CER I and 5 seconds of veortexing with 1 minute of incubating after adding CER II.
Next, the NER reagent allows the proteins to be extracted after centrifugation. The
strength of this reagent is that it yields products with less than 10% contamination
between nuclear and cytoplasmic fractions. This amount of purity is useful for more
steps with these components. An insolubule pellet will form by vortexing the tube
for 5 seconds and centrifuging for another 5 minutes. Suspend this pellet in ice-cold
NER. Continue vortexing the sample every 15 seconds for 10 minutes, for a total of
40 minutes while placing the sample on ice during the breaks. Finally, centrifuge at
maximum speed at around 16,000 x g for 10 minutes and the nuclear extract will be
ready for the next step.
RT-PCR
The tubes for the RT-PCR lanes were made as follows.
PCR Tube Content
1 RNA + GFP Primer
2 RNA + Protein Primer
3 RNA + No Primers
4 RNA + GFP, no RT enzyme
5 RNA + Protein, no RT enzyme
6 No RNA + GFP Primer
7 No RNA + Protein Primer
Figure 3: Table of contents for each PCR tube
7. 7
Results
Cell Culture
The expected vector transformation color was white. Again, our setup was:
1 – B-Gal Experimental
2 – B-Gal Control
3 – Membrane Vector Experimental
4 – Membrane Vector Control
Cultures 1 and 3 ended up being a darkish blue color. Cultures 2 and 4 didn’t seem
to survive. This proves that the transformation of the vector to the bacteria was
successful.
Gel Electrophoresis
Lane Content
1 Ladder
2 Cellular Vector 1
3 Cellular Vector 2
4 Cellular Vector 3
5 Cellular Vector 4
6 Prokaryotic
Vector 1
7 Prokaryotic
Vector 2
Figure 3 and 4: Gel Electrophoresis
and table of lanes
8. 8
Lanes 8-12 are empty.
The expected size of the B-Gal was 6820 base pairs while the membrane was 5800
base pairs. This seems to correlate with our data because the B-Gal lanes seem to be
slightly thicker. Our data in the Gel Electrophoresis also seems to correlate with the
Spectrometer Data in the next section. The thicker lanes have the higher
concentration and absorbance compared to the other lanes. For example, lane 4 had
the highest values with a concentration of 401.8 n/uL and an absorbance of 8.035
nm; its respective band, at lane 5, also seems to be the thickest.
Spectrometer Data
Sample Concentration
n/uL
Absorbance
260 nm
260/280 nm ratio
Membrane 1 81.8 1.636 1.81
Membrane 2 323.8 6.475 1.87
Membrane 3 63.5 1.269 1.84
Membrane 4 401.8 8.035 1.81
Amp 1 4.6 4.3 1.84
Amp 2 318.7 6.373 1.84
Confocal Microscope Visual Analysis
Figure 6: Confocal Microscope
Image
Figure 5: Table of Spectrometer Data
9. 9
Due to the flexibility of the confocal microscope, we can observe many different
layers of our cell. An interesting fact we found was that we see more fluorescence at
the top of the cells. This is due to the cells being polarized. Also, not all of the cells
had strong green fluorescence. This is due to our transient system, causing our
daughter cells to have less of the vector. Our GFP also partially labels other
membranes within the cell, such as the mitochondrial membrane. This can be seen
because some portions of the cell seem to have a brighter highlight than others;
these brighter portions indicate the GFP highlighting some of the intracellular
membranes.
RT-PCR Results
1 Ladder Lane
2 RNA + GFP Primer
3 RNA + Protein Primer
4 RNA + No Primers
5 RNA + GFP, no RT
enzyme
6 RNA + Protein, no RT
enzyme
7 No RNA + GFP Primer
8 No RNA + Protein
Primer
Figure 7: RT-PCR image
Figure 8: Table of
Lanes on RT-PCR Gel
10. 10
Lanes 9-12 are empty
Our RT-PCR experiment was not very successful, as the lanes seemed to be
extremely light. Perhaps the solutions used to fill the protein and GFP primer lanes
were too diluted. If they were washed down with too much water, it would cause
some of the primers to not function and thus become much lighter on the gel.
Moreover, lanes 3 and 4 are expected to be empty because 3 contains no GFP while
4 contains no primers at all. Also, both lane 7 and 8 had no RNA so they were
supposed to be empty as well. As seen on the picture though, both lanes seem to
have a faint band.
Discussion
GFP can be very useful in experiments revolving around the cell membrane
due to its fluorescence ability. As mentioned before, one way to utilize GFP is to
determine the effects of osmosis on the cellular membrane (1). The vector used in
this experiment—pAcGFP1-Mem—is incredibly useful in transferring the genetic
material for GFP to the desired organism. The ability of the pAcGFP1-Mem vector to
transform into the genome was tested in these experiments; after the
transformation was complete, a gel-electrophoresis was done in order to ensure the
DNA recovery in prokaryotes. Furthermore, an RT-PCR was also conducted in order
to confirm the DNA recovery by the PCR primers. The actual visual analysis itself
was done through the use of the confocal microscope. A western blot was planned
to confirm recovery of the protein of interest, but ultimately failed due to faulty gels.
11. 11
pAcGFP1-Mem in particular codes for the Neuromodulin protein (GAP-43).
GAP-43 is transported to the membrane protein through the use of its sequence on
the N-terminal region. This sequence at the N-terminal region helps shuttle the
GAP-43 protein to the membrane. Naturally, GAP-43 has a role in making and
maintains connections between neuron cells. In our pAcGFP1-Mem vector, we use it
as a messenger of GFP to the cellular membrane. In an experiment headed by
Udvadia, researchers used GFP and GAP-43 in a similar way us in researching
differences in axon growth between CNS development and regeneration (4).
The most relevant data for the usefulness of the pAcGFP1-Mem in
researching for changes in the cell membrane is the images from the confocal
microscope. The images are clear proof that the pAcGFP1-Mem was integrated into
the genome because we can observe the green highlighting of the GFP. The confocal
images show that the top layer of the cell seems to have more fluorescence than the
middle or the last few layers. This might be due to the polarity of the cell and
because the GFP is more concentrated in the first few layers. In addition, the higher
amount of fluorescence near the center of the cell comes from intracellular
membranes that also have some GFP. Experiments that only need data on the
cellular membrane might have difficulty due to the fact that some intracellular
membrane might also receive some green fluorescence. While this might make GFP,
and thus the pAcGFP1-Mem, unreliable in some cases, it may also lead to interesting
results. In her experiment, Castaneda took advantage of GFP’s tendency to highlight
some organelle membrane to test the differential expression of the CB2 protein in
extracellular membranes vs intracellular membrane (5). Thanks to this supposed
12. 12
downside of GFP, she was able to find the human PBL cells express the CB2 protein
at the intracellular membrane while B cells express them at the extracellular
membrane.
In another experiment, Porcelli attempted to detect differences in pH across
the outer mitochondrial membrane (6). Unlike all the previous experiments in
using GFP to study the mitochondrial membrane, these experimenters used GFP to
exclusively examine the mitochondrial membrane and completely circumvented the
cellular membrane. The experiment concluded by determining that the pH of the
mitochondrial matrix was higher than the inter-membrane space.
As we can see from the confocal data, the pAcGFP1-Mem can efficiently
highlight extracellular membranes. But does this mean that the pAcGFP1-Mem
vector is a good tool to be used in experiments that need to extensively analyze
cellular membranes? There seems to be two prime weaknesses from the data. First,
the GFP can be localized unevenly due to external factors like polarization. Second,
GFP can also highlight some intracellular membranes. As we can see in experiments
from Castaneda and Porcelli, GFP localizing in some intracellular membranes can be
taken advantage of in order to gain more results about the cell as a whole. Thus, this
“weakness” of the GAP-43 of the pAcGFP1-Mem localizing the GFP into some
intracellular membranes can also be seen as a strength. The other weakness of the
GFP randomly localizing unevenly along the membrane can be simply overcome
through multiple experiments. While this might end up costing more money and
taking more time, it can eliminate any random factors the GFP might have in
localizing along the membrane. In conclusion, pAcGFP1-Mem is a very useful vector
13. 13
in studying changes on the cellular membrane. In addition, it also allows
researchers to investigate any changes within the intracellular membrane as well.
Thus, researchers can use this vector as a simple and fast method in reliably
studying both the extracellular and intracellular membranes.
14. 14
References
1. Becker,D and Hahn,J. (2007), “Functional interaction of the cation channel
transient receptor potential vanilloid 4 (TRPV4) and actin in volume regulation”,
http://www.sciencedirect.com/science/article/pii/S0171933508001441
2. Kawaja, Michael D. et al. “Nerve Growth Factor Promoter Activity Revealed in
Mice Expressing Enhanced Green Fluorescent Protein.” The Journal of comparative
neurology 519.13 (2011): 2522–2545. PMC. Web. 6 May 2016.
http://www.ncbi.nlm.nih.gov/pubmed/21456011
3. Leveau, Johan H. J., and Steven E. Lindow. “Predictive and Interpretive Simulation
of Green Fluorescent Protein Expression in Reporter Bacteria.” Journal of
Bacteriology 183.23 (2001): 6752–6762. PMC. Web. 6 May 2016.
http://www.ncbi.nlm.nih.gov/pmc/articles/PMC95514/
4. A.J. Udvadia, and R.W. Koster, (2001), “GAP-43 promoter elements in transgenic
zebrafish reveal a difference in signals for axon growth during CNS development
and regeneration”
http://dev.biologists.org/content/128/7/1175.article-info
5. Castaneda, Julie T. et al. “Differential Expression of Intracellular and Extracellular
CB2 Cannabinoid Receptor Protein by Human Peripheral Blood Leukocytes.” Journal
of neuroimmune pharmacology : the official journal of the Society on NeuroImmune
Pharmacology 8.1 (2013): 323–332. PMC. Web. 6 May 2016.
http://www.ncbi.nlm.nih.gov/pmc/articles/PMC3587044/
6. Porcelli, A.M. and Ghelli, A. (2004), “pH difference across the outer mitochondrial
membrane measured with a green fluorescent protein mutant”
http://www.sciencedirect.com/science/article/pii/S0006291X04026890