What Are The Drone Anti-jamming Systems Technology?
Nd viruses.kinzer-et-al
1. Introduction Divide Burke Renville
9/10
Bottineau
4/13
Rolette
1/2
Towner Cavalier
4/12
Pembina
1/3
Results
North Dakota (ND) is the largest producer of durum wheat, hard red spring Williams
1/1 Pierce
Walsh WSMV was the most common virus, detected in 53.3% of all
wheat, and barley in the United States. To a lesser extent, winter wheat is grown Mountraill
Ward
36/43 McHenry 0/3 Ramsey
1/1
samples. Winter wheat had the highest infection by WSMV, with
2/2 Benson 2/4
in ND, with acres fluctuating between 200,000 and 600,000 in the past six years. 2/7 7/7
Nelson Grand Forks
1/4 58.5% of the submitted samples infected, followed by spring
Wheat streak mosaic virus (WSVM), a virus vectored by the wheat curl mite McKenzie 4/6
(Aceria tosichella), has historically impacted yield in ND, and depending on the
2/2 McLean
2/6
Sheridan Wells
Eddy
1/1 wheat (50.9%), durum wheat (43.8%), and barley (9.1%).
5/7 Foster Traill
Dunn 1/4 Griggs Steele 0/2
year, the effect can be severe. For example, wheat streak caused an estimated Billings
4/5 Mercer 2/2
4/8 1/1
WMoV and BYDV-PAV were detected in 12.1% and 10.9% of the
1/1 Oliver
$40-million loss in 1988 (5), and yield losses of up to 100% have been observed Golden
2/2 Burleigh Kidder Stutsman Barnes Cass samples, respectively, between 2008 and 2011. Although CYDV-
Morton 4/9 0/3 0/3 1/3 2/20
in severely infected fields (3). Yellow dwarf viruses such as Barley yellow dwarf Valley
2/8
Stark
13/29 3/7
RPV was detected in 3 of 13 samples in preliminary virus
virus strain PAV (BYDV-PAV) and Cereal yellow dwarf virus strain RPV (CYDV-RPV) Slope
0/1
Hettinger Logan
9/10
LaMoure
0/1
Ransom
10/12 screening in 2007 (Table 1), it was not detected in the 2008-2011
(formerly classified as a strain of Barley yellow dwarf virus) are also important 6/9 Grant Emmons Richland
0/4
viruses in ND that can impact both yield and grain quality (2). Two relatively
Bowman
5/12
Adams
4/7
Sioux
6/10
McIntosh
4/6
Dickey
1/4
Sargent
0/2
survey. No viruses were detected in 37.4% of samples among
1/1
newly described viruses, Wheat mosaic virus (WMoV), formerly known as High years.
plains virus (HPV), and Triticum mosaic virus (TriMV) have recently been
Divide Burke Bottineau Rolette Cavalier Pembina
Co-infection with two viruses occurred in 11.8% of samples
detected in the region (6, 7). TriMV has not been confirmed in ND despite efforts Renville
2/10 0/13 0/2
Towner
0/12 1/3
among years. Co-infection with WSMV and WMoV was most
to detect it as part of a wheat virus survey sponsored by the Great Plains Williams
Diagnostic Network (GPDN) in 2008 (1) and subsequent years. WMoV has been
0/1
Ward
Pierce
Walsh
0/1
common followed by WSMV and BYDV-PAV, with 10.9% and 1.9%
McHenry 0/3 Ramsey
detected in ND every year since 2007. Yield losses due to virus infection have
Mountraill
0/7
11/43
0/2 Benson
1/7
0/4 of samples infected, respectively. Infection by all three viruses
Nelson Grand Forks
been estimated between 5 and 10% in the nine-state region of the GPDN, and as McKenzie
2/2 McLean Eddy
2/6 0/4 detected in the survey was rare (0.94%). WMoV usually occurred
a result, viruses of small grains continue to be identified as important pathogens Dunn
0/6
Sheridan
0/4
Wells
0/7
1/1
Foster
Griggs Steele
Traill in conjunction with WSMV; it occurred alone in only 1.2% of
0/2
(1). Billings
1/5 Mercer 0/2
1/8 0/1
samples among years (two samples in 2009 and two samples in
0/1 Oliver
The purpose of this survey was to identify the prevalence and distribution of Golden
1/2 Burleigh
1/9
Kidder
0/3
Stutsman
0/3
Barnes Cass
0/20
2011).
0/3
Valley Stark Morton
four small grain viruses in ND: WSMV, WMoV, BYDV-PAV, and CYDV-RPV. With 0/8 5/29 1/7
the seeming increase in prevalence of virus symptoms in ND in recent years, a Slope LaMoure Ransom
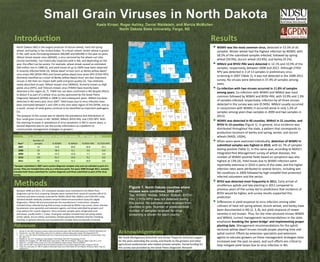
WSMV was detected in 40 counties, WMoV in 21 counties, and
Hettinger Logan
second objective was to use the survey information as a platform to
0/1
1/9 Grant Emmons
1/10
0/10 1/1 1/12
Richland
0/4
BYDV in 14 counties (Figure 1). In general, virus incidence was
Bowman Dickey Sargent
communicate management strategies to growers. 1/12
Adams
1/7
Sioux
0/1
McIntosh
1/6 1/4 0/2 distributed throughout the state, a pattern that corresponds to
production locations of barley and spring, winter, and durum
Table 1. Viruses detected in small grain samples, 2007 through 2011. Divide Burke Bottineau Rolette Cavalier Pembina
wheats (NASS, USDA).
Renville Towner
0/13 0/2 4/12 0/3
0/10
Number of When years were examined individually, detection of WSMV in
Williams
Year* samples % WSMV % WMoV % BYDV-PAV % CYDV-RPV Walsh
2007 13 53.8 30.8 30.8 23.1
0/1
Ward
2/43 McHenry
Pierce
0/3 Ramsey
0/1 submitted samples was highest in 2010, with 61.7% of samples
Mountraill 0/4
2008 33 36.4 6.1 3.0 0.0
0/7
0/2 Benson
1/7
Nelson Grand Forks
testing positive (Table 1). In this same year, according to NDSU’s
1/6 0/4
2009 78 51.3 12.8 7.7 0.0
McKenzie
0/2 McLean Eddy
0/1
Integrated Pest Management survey of wheat diseases, the
2/6 Wells
2010 120 61.7 14.2 9.2 0.0 Dunn
Mercer
Sheridan
0/4 0/7 Foster
0/2
Griggs Steele
Traill
0/2 number of WSMV-positive fields based on symptoms was also
0/5 0/8 0/1
2011 90 50.0 11.1 18.9 0.0 Billings
0/1 Oliver highest at 13% (4). Yield losses due to WSMV infection were
0/2 Burleigh Kidder Stutsman Cass
*Samples submitted in 2007 were routine diagnosis samples only and not solicited as part of a
Golden
Valley Stark Morton
0/7
0/9 0/3 0/3
Barnes
0/3 4/20 reportedly extensive in 2010 in parts of the state, and the higher
0/8 6/29
survey. They are included here only as a reference point. For years 2008 through 2011, samples
Slope Logan LaMoure Ransom
infection rates were attributed to several factors, including wet
included both those submitted for routine diagnosis and those submitted as part of the virus 1/1
Hettinger
3/9 Grant Emmons
3/10 0/1 10/12
Richland
fall conditions in 2009 followed by high snowfall that protected
0/4
survey. Bowman Adams
0/10
McIntosh Dickey Sargent
2/12 3/7
Sioux
0/1 0/6 1/4 2/2
infected volunteers and the vector.
Methods Figure 1. North Dakota counties where
BYDV was detected most frequently in 2011. Early arrival of
viruliferous aphids and late planting in 2011 compared to
Between 2008 and 2011, 321 small grain samples were submitted to the NDSU Plant previous years of the survey led to predictions that incidence of
viruses were confirmed, 2008-2011.
Diagnostic Lab for virus screening. Samples were received from nearly all counties (48 of 53 BYDV would be higher, and survey results supported this
counties) and were routinely screened for WSMV, BYDV-PAV, WMoV, and CYDV-RPV using Top, WSMV; Middle, WMoV; Bottom, BYDV-
prediction.
standard double-antibody sandwich enzyme-linked immunosorbent assay kits (Agida PAV. CYDV-RPV was not detected during
Diagnostics, Elkhart IN) and processed per the manufacturer’s instructions. Samples this period. No samples were received from Differences in yield response to virus infection among older
included those collected during field surveys conducted by NDSU crop scouts, those solicited cultivars of hard red spring wheat, durum wheat, and barley have
by extension area specialists and extension agents, and those submitted by growers and counties in grey. Number of positives/total
crop advisors for routine diagnosis. Once received, samples were refrigerated until number of samples received for virus been documented in ND (2, 3, 8), but yield response of newer
processed, usually within 1-5 days. Small grain samples included hard red spring wheat, screening is shown for each county. varieties is not known. Thus, for the mite-vectored viruses WSMV
winter wheat, durum wheat, and barley. Samples generally exhibited chlorotic streaking, and WMoV, current management recommendations in the state
stunting, or general chlorosis, but asymptomatic samples were occasionally screened.
emphasize breaking the ‘green bridge’ and implementing proper
References planting date. Management recommendations for the aphid-
vectored yellow dwarf viruses include proper planting time and
1.
2.
3.
Burrows, M., et al. 2009. Occurrence of viruses in wheat in the Great Plains region, 2008. Plant Health Progress doi:10.1094/PHP-2009-0706-01-RS.
Edwards, M.C., et al. 2001. Effect of Barley yellow dwarf virus infection on yield and malting quality of barley. Plant Disease 85:202-207.
Jons, V.L., et al. 1981. Effect of wheat streak mosaic virus on twelve hard red spring wheat cultivars. ND Farm Research. ND Ag Exp Station, Fargo
Acknowledgements aphid control. Efforts by extension specialists and extension
4.
ND. 39(2):17-18.
McMullen, M., et al. 2011. Fluctuations in wheat diseases in North Dakota, 2004–2010. Phytopathology 101:S2.6
We thank Montgomary Botschner and Aimee Thapa for technical support agents to educate growers on these management strategies have
5. McMullen, M.P. and Nelson, D.R. 1989. Wheat streak mosaic severe in 1988. ND Farm Research. ND Ag Exp. Station, Fargo, ND. p. 14-16. for the years extending this survey, and thanks to the growers and other increased over the past six years, and such efforts are critical to
6. Seifers, D.L., et al. 2008. Triticum mosaic virus: A new virus isolated from wheat in Kansas. Plant Dis. 92:808-817.
7. Skare, J.M. et al. 2006. A new eriophyid mite-borne membrane-enveloped virus-like complex isolated from plants. Virology 347:343-353. agricultural professionals who helped provide samples. Partial funding for help mitigate yield losses due to virus infection in ND.
8. Timian, R.G., and Lamey, H.A. 1985. An update on wheat streak mosaic virus in North Dakota. ND Farm Research. ND Ag Exp. Station, Fargo, ND.
42(5):20,27,31. this survey was provided by the Great Plains Diagnostic Network.