SlideShare a Scribd company logo
1 of 11
Download to read offline
Analysis	of	Manufacturing	in	the	Midwest	
The	following	analysis	looks	at	the	trends	in	manufacturing	as	a	whole,	manufacturing	of	nondurable	
and	durable	goods,	and	manufacturing	of	the	major	sectors	in	durable	goods.	The	charts	display	data	
regarding	not-seasonally-adjusted	nonfarm	payroll	employment	in	manufacturing	obtained	from	
Current	Employment	Statistics	survey	(CES)	over	the	past	five	years.	The	sectors	of	durable	goods	were	
chosen	due	to	their	prominence	in	Illinois	or	the	Midwest.	
Manufacturing	
	
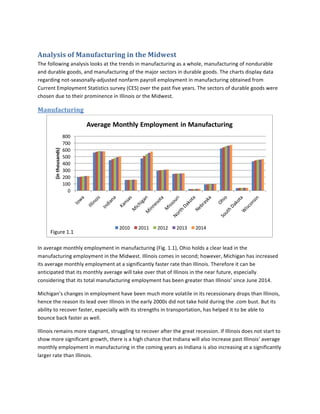
In	average	monthly	employment	in	manufacturing	(Fig.	1.1),	Ohio	holds	a	clear	lead	in	the	
manufacturing	employment	in	the	Midwest.	Illinois	comes	in	second;	however,	Michigan	has	increased	
its	average	monthly	employment	at	a	significantly	faster	rate	than	Illinois.	Therefore	it	can	be	
anticipated	that	its	monthly	average	will	take	over	that	of	Illinois	in	the	near	future,	especially	
considering	that	its	total	manufacturing	employment	has	been	greater	than	Illinois’	since	June	2014.		
Michigan’s	changes	in	employment	have	been	much	more	volatile	in	its	recessionary	drops	than	Illinois,	
hence	the	reason	its	lead	over	Illinois	in	the	early	2000s	did	not	take	hold	during	the	.com	bust.	But	its	
ability	to	recover	faster,	especially	with	its	strengths	in	transportation,	has	helped	it	to	be	able	to	
bounce	back	faster	as	well.		
Illinois	remains	more	stagnant,	struggling	to	recover	after	the	great	recession.	If	Illinois	does	not	start	to	
show	more	significant	growth,	there	is	a	high	chance	that	Indiana	will	also	increase	past	Illinois’	average	
monthly	employment	in	manufacturing	in	the	coming	years	as	Indiana	is	also	increasing	at	a	significantly	
larger	rate	than	Illinois.		
0
100
200
300
400
500
600
700
800
(in	thousands)
Average	Monthly	Employment	in	Manufacturing
2010 2011 2012 2013 2014
Figure 1.1
Nondurable	Goods	
	
From	1990	to	around	2009	most	of	the	trends	for	the	Midwest	states	are	in	a	decline.	By	2010,	states	
start	to	show	a	slight	recovery	or	at	least	leveling	from	the	great	recession.	While	third	in	nondurable	
goods	employment,	Wisconsin	has	shown	the	greatest	percent	change	over	the	year	for	the	past	five	
years.	They	are	currently	up	4.3	percent	from	April	2014,	while	Ohio	is	only	up	2.5	percent	and	Illinois	is	
actually	down	0.7	percent.	With	the	current	trends,	it	looks	as	though	Illinois	will	drop	to	third	within	
the	next	ten	or	so	years	even	though	it	held	the	lead	in	2014	at	230.4	thousand	average	monthly	
employees	(Fig.	1.2).	
	
0.0
50.0
100.0
150.0
200.0
250.0
(in	thousands) Average	Monthly	Employment	in	Non-Durable	Goods	
2010 2011 2012 2013 2014
0.0
10.0
20.0
30.0
40.0
50.0
60.0
Percent
Percent	of	Average	Monthly	Manufacturing	Employees	in	
Nondurable	Goods
2010 2011 2012 2013 2014
Figure	1.2
Figure	1.3
In	manufacturing	of	nondurable	goods,	Illinois	employs	the	greatest	number	of	employees	with	Ohio	not	
too	far	behind.	Yet	by	looking	at	the	percent	of	manufacturing	employees	in	nondurable	goods	(Fig.	1.3)	
it	is	evident	that	Nebraska	is	the	most	reliant	on	nondurable	goods	manufacturing	in	the	Midwest.	
Currently	52.9	percent	of	its	manufacturing	employees	work	with	nondurable	goods,	while	only	39.8	
percent	for	Illinois	and	31.9	percent	for	Ohio.	The	rest	of	the	states	in	the	Midwest	are	only	reliant	on	
nondurable	goods	40	percent	or	less,	making	Nebraska	the	only	state	to	have	the	majority	of	its	
manufacturing	employees	working	with	nondurable	goods,	though	the	majority	is	small.	
Durable	Goods	
	
Currently,	Ohio	has	the	greatest	employment	in	durable	goods,	but	it	holds	a	longstanding	competition	
with	Michigan	for	this	position,	as	seen	in	Fig.	1.4.	The	difference	between	the	two	has	been	decreasing	
as	they	started	to	recover	from	the	recession	in	2009,	with	the	2014	Ohio	employment	at	458.2	
thousand	and	Michigan	at	437.4	thousand.	Illinois	and	Indiana	are	in	a	similar	relationship	in	third	and	
fourth	greatest	employment	as	Ohio	and	Michigan	are	for	first	and	second.	However,	Illinois’	percent	
change	over	the	year	has	been	decreasing	while	Indiana’s	has	had	a	slight	increase,	causing	Illinois	to	
drop	to	fourth	in	May	2013.	Illinois	shows	no	signs	of	exceeding	Indiana’s	employment.	
0
50
100
150
200
250
300
350
400
450
500
(in	thousands)
Average	Monthly	Employment	in	Durable	Goods
2010 2011 2012 2013 2014
Figure	1.4
While	having	the	second	largest	number	of	employees	in	durable	goods,	Michigan	has	the	greatest	
importance	with	76.0	percent	of	their	manufacturing	employees	in	2014	working	with	durable	goods	
(Fig.	1.5).	As	Nebraska	was	the	only	state	to	have	a	majority	of	manufacturing	employees	working	on	
nondurable	goods,	it	only	makes	sense	that	the	rest	of	the	states	have	a	majority	of	manufacturing	
employees	working	on	durable	goods.	Illinois	has	a	fairly	stable,	if	not	declining,	majority	of	
manufacturing	employees	on	durable	goods,	while	the	rest	of	the	states,	with	the	exception	of	Kansas,	
show	an	increasing	majority	of	manufacturing	employees	working	on	durable	goods.	
Chemicals	
	
0
10
20
30
40
50
60
70
80
Percent
Percent	of	Average	Monthly	Manufacturing	Employees	in	
Durable	Goods
2010 2011 2012 2013 2014
0
5
10
15
20
25
30
35
40
45
50
Illinois Indiana Michigan Ohio
(in	thousands)
Monthly	Average	Employment	in	Chemicals
2010 2011 2012 2013 2014
Figure	1.5
Figure	1.6
Chemical	manufacturing	is	the	only	area	where	Illinois	has	been	at	and	maintained	the	largest	
employment	in	the	Midwest.	Ohio	is	in	a	close	second	to	Illinois	but	has	recently	started	to	trend	
downward	while	Illinois’	employment	increases.	Michigan	and	Indiana	are	also	on	the	rise,	but	have	
some	catching	up	to	do	with	Illinois’	45.3	thousand	(Fig.	1.6).	With	Michigan’s	larger	percent	change	
increases,	Illinois	should	be	making	sure	that	there	are	extra	efforts	to	maintain	their	only	lead	in	the	
manufacturing	industry.	
	
Not	only	does	Illinois	have	the	greatest	number	of	manufacturing	employees	in	chemicals,	but	it	also	has	
the	greatest	percent	of	its	manufacturing	employees	in	chemicals.	While	chemicals	only	make	up	13.0	
percent	of	employees	in	manufacturing,	chemicals	are	actually	the	fourth	largest	percentage	of	
employees	in	durable	goods	manufacturing	(Fig.	1.7).	Ohio	is	close	behind	at	9.4	percent.	All	of	the	
states	besides	Illinois	have	a	decreasing	percentage	of	chemical	employees,	making	it	possible	for	Illinois	
to	maintain	this	important	lead.		
0
2
4
6
8
10
12
14
16
Illinois Indiana Michigan Ohio
Percent
Percent	of	Average	Monthly	Durable	Goods	Employees	in	
Chemicals
2010 2011 2012 2013 2014
Figure	1.7
Fabricated	Metal	Products	
	
In	the	manufacturing	of	fabricated	metal	products,	Ohio	has	consistently	held	the	lead	with	Illinois	not	
too	far	behind.	However,	Fig.	1.8	demonstrates	that	in	recent	years	the	gap	between	the	two	has	grown	
as	Ohio’s	employment	has	continued	to	increase	while	Illinois’	has	started	to	decrease.	All	of	the	states	
show	an	increase	in	employees	with	the	exceptions	of	Illinois	and	Missouri.	
	
Illinois	and	Wisconsin	are	incredibly	close	for	the	percent	of	manufacturing	employees	in	fabricated	
metals	at	26.6	and	26.2	percent,	meaning	that	either	one	could	prove	to	have	a	greater	percent	of	
manufacturing	employees	working	with	fabricated	metals	in	the	next	release	of	data	(Fig.	1.9).	As	
fabricated	metals	are	the	largest	area	of	durable	goods	manufactured	for	Illinois,	it	is	important	that	
0
20
40
60
80
100
120
(in	thousands) Average	Monthly	Employment	in	Fabricated	Metal	
Products
2010 2011 2012 2013 2014
0
5
10
15
20
25
30
Percent
Percent	of	Average	Monthly	Durable	Goods	Employees	in	
Fabricated	Metal	Products
2010 2011 2012 2013 2014
Figure	1.9
Figure	1.8
Illinois	maintains	this	lead	in	order	to	ensure	the	strength	of	the	industry.	Ohio	is	the	closest	threat	at	
22.4	percent,	but	there	are	also	several	other	states	that	have	fabricated	metals	making	up	at	least	15	
percent	of	their	manufacturing	employees.	Due	to	the	competition	in	this	field,	Illinois	must	work	
extremely	hard	ensure	its	significance	in	fabricated	metals	remains	high.		
Machinery	
	
In	machinery,	Illinois	has	the	greater	workforce,	but	Ohio	is	a	real	threat	to	that	as	the	current	difference	
between	the	two	is	only	2.6	thousand	employees	(Fig.	1.10).	With	Ohio’s	percent	change	over	the	year	
currently	at	3.9	percent,	it	will	most	likely	overtake	Illinois	in	the	next	month’s	report	as	Illinois’s	percent	
change	over	the	year	still	trying	to	creep	out	of	a	negative	percent	change	in	comparison	to	the	previous	
year.	Wisconsin	and	Michigan	are	in	third	and	fourth	for	machinery	employment,	and	have	had	very	
close	numbers	over	the	past	years,	yet	Michigan	has	been	able	to	maintain	its	lead	as	its	percent	change	
over	the	year	has	increased	while	Wisconsin’s	decreased.	
0
10
20
30
40
50
60
70
80
90
(in	thousands)
Average	Monthly	Employment	in	Machinery
2010 2011 2012 2013 2014
Figure	1.10
North	Dakota	relies	heavily	on	machinery	for	its	manufacturing	employees,	with	the	data	for	2014	
putting	machinery	at	33.5	percent	(Fig.	1.11).	This	is	in	spite	having	only	6.0	thousand	employees	in	
machinery	compared	to	Illinois’	80.4	thousand	(Fig.	1.10).	Iowa	is	in	a	close	second	at	32.1	percent,	and	
Illinois	actually	comes	in	third	at	23.0	percent.	This	does	not	change	the	fact	that	machinery	employees	
the	second	largest	percentage	of	manufacturing	employees	in	Illinois	working	with	durable	goods.		
Computer	&	Electrical	Products	
	
Illinois	had	the	lead	in	the	computer	and	electrical	products	employment,	peaking	at	the	early	2000s	
when	its	decreasing	trend	passed	Minnesota.	It	has	since	slowed	down	its	decline,	but	shows	no	signs	of	
increasing	soon,	sitting	at	a	low	of	31.6	thousand	in	2014	(Fig.	1.12).	Over	the	last	five	years,	the	percent	
0
5
10
15
20
25
30
35
40
Percent
Percent	of	Average	Monthly	Durable	Goods	Employees	in	
Machinery
2010 2011 2012 2013 2014
0
10
20
30
40
50
Illinois Indiana Michigan Minnesota Missouri Nebraska Ohio
(in	thousands)
Average	Monthly	Employment	in	Computer	&	Electrical	
Products
2010 2011 2012 2013 2014
Figure	1.12
Figure	1.11
changes	for	the	top	four	state	percent	changes	(Minnesota,	Illinois,	Ohio,	and	Indiana)	have	followed	a	
fairly	similar	pattern.	But	Minnesota	has	shown	a	steeper	increase	over	the	past	year.	This	will	help	
Minnesota	maintain	its	lead.	It	the	states	continue	the	way	they	have	been	going,	Illinois	will	be	able	to	
maintain	its	second	place	position	for	a	few	more	years,	but	at	the	risk	of	continually	losing	employees.	
	
Minnesota	not	only	employees	the	most	in	computer	&	electrical	products,	but	also	has	the	largest	
percent	of	its	durable	manufacturing	employees	even	though	the	percentage	has	been	declining.	The	
other	Midwest	states	pale	in	comparison	to	Minnesota’s	22.7	percent	with	their	2014	percentages	not	
even	breaking	10.0	(Fig.	1.13).	Missouri	is	the	only	state	increasing	percentage	of	manufacturing	
employees	in	computer	&	electrical	products.	While	Illinois	is	in	a	decline,	computer	&	electrical	
products	are	only	its	sixth	largest	percent	of	employees	in	durable	manufacturing,	and	its	percentages	in	
this	area	are	not	much	higher	than	the	other	states	with	the	obvious	exception	of	Minnesota.		
0.0
5.0
10.0
15.0
20.0
25.0
30.0
Illinois Indiana Michigan Minnesota Missouri Nebraska Ohio
Percent
Percent	of	Average	Monthly	Durable	Goods	Employees	in	
Computer	&	Electrical	Products
2010 2011 2012 2013 2014
Figure	1.13
Transportation	Equipment	
	
It	is	no	surprise	that	Michigan	is	in	the	lead	in	transportation	equipment	by	a	long	shot.	While	states	
with	a	larger	transportation	employment	had	a	larger	loss	during	the	great	recession,	their	recovery	was	
also	significantly	greater.	States	with	the	second	and	third	greatest	employment	are	Indiana	and	Ohio,	
but	their	recovery	trends	after	the	great	recession	line	up	almost	perfectly.	Illinois’	transportation	
equipment	employment	averages	around	41.8	thousand,	not	even	coming	near	Michigan’s	current	
175.9	thousand	(Fig.	1.14).	While	Illinois’	employment	is	slightly	increasing,	drastic	measures	would	have	
to	be	taken	to	make	it	stand	out	from	the	rest	of	the	Midwest	states.	
	
0
50
100
150
200
(in	thousands) Average	Monthly	Employment	in	Transportation	
Equipment
2010 2011 2012 2013 2014
0.0
10.0
20.0
30.0
40.0
50.0
Percent
Percent	of	Average	Monthly	Durable	Goods	Employees	in	
Transportation	Equipment
2010 2011 2012 2013 2014
Figure	1.15
Figure	1.14
Michigan	puts	the	most	importance	on	transportation	equipment	with	40.2	percent	of	its	manufacturing	
employees	working	and	showing	steady	growth.	Kansas	and	Indiana	are	close	behind,	but	Kansas	is	
actually	in	a	slight	decline	(Fig.	1.15).	Oddly	enough,	Kansas	has	39.5	percent	of	its	manufacturing	
employees	in	this	sector	of	durable	goods,	yet	that	only	equates	to	39.0	thousand	employees,	which	is	
less	than	Illinois.	Illinois	is	far	below	most	of	the	Midwest	states	at	only	12.0	percent	despite	the	fact	
that	transportation	is	the	fourth	largest	sector	for	its	employees	manufacturing	durable	goods.	Illinois	is	
showing	extremely	slow	growth	in	comparison	to	the	stronger	competitors,	but	the	slow	growth	is	
common	among	states	with	less	than	30.0	percent	of	manufacturing	employees	working	with	
transportation	equipment.		
Other	Types	of	Durable	Manufacturing	
The	remaining	types	of	manufacturing	either	had	information	for	only	a	few	states	in	the	Midwest,	or	
held	little	significance	to	Illinois.	A	common	occurrence	with	the	types	of	durable	manufacturing	that	
was	not	discussed	was	Illinois	holding	second	or	third	in	employment	for	each	type	of	manufacturing.	
However,	each	type	accounted	for	no	more	than	40.3	thousand	employees	and	showed	no	signs	of	
significant	growth.	
Conclusion	
Even	if	Illinois	held	market	share	in	certain	manufacturing	fields	before	the	great	recession,	it	has	since	
lost	that	foothold.	The	overall	trends	for	each	type	of	manufacturing	have	been	fairly	stagnant	since	the	
recession,	not	indicating	any	significant	changes	in	the	near	future.	Illinois	still	has	the	advantage	in	the	
number	employed	and	the	percent	employed	when	it	comes	to	chemicals.	And	in	fabricated	metals	it	is	
not	too	far	behind	Ohio	in	number	of	employees	for	it	to	be	impossible	to	gain	the	upper	hand,	
especially	considering	that	fabricated	metals	has	the	greatest	percentage	of	manufacturing	employees	
working	in	durable	goods.	Other	Midwestern	states,	most	notably	Ohio,	Michigan,	and	Wisconsin,	are	
showing	greater	percent	changes	than	Illinois.	In	order	to	help	boost	manufacturing	in	Illinois,	it	would	
be	wise	to	look	at	the	approaches	of	these	three	states	when	it	comes	to	manufacturing	in	order	to	
ensure	that	Illinois	is	not	made	obsolete	in	manufacturing	in	comparison	to	the	rest	of	the	Midwest.

More Related Content

Viewers also liked

Indian Manufacturing Sector
Indian Manufacturing Sector  Indian Manufacturing Sector
Indian Manufacturing Sector Apoorva Yadav
 
Manufacturing Industries
Manufacturing IndustriesManufacturing Industries
Manufacturing IndustriesJainish Kothary
 
Manufacturing sector of india
Manufacturing sector of indiaManufacturing sector of india
Manufacturing sector of indiaManisha Kunwar
 
Manufacturing industries
Manufacturing industriesManufacturing industries
Manufacturing industriesNazal Noushad
 

Viewers also liked (7)

Indian Manufacturing Sector
Indian Manufacturing Sector  Indian Manufacturing Sector
Indian Manufacturing Sector
 
Manufacturing Industries
Manufacturing IndustriesManufacturing Industries
Manufacturing Industries
 
Manufacturing strategy
Manufacturing strategyManufacturing strategy
Manufacturing strategy
 
Manufacturing sector of india
Manufacturing sector of indiaManufacturing sector of india
Manufacturing sector of india
 
Manufacturing industries
Manufacturing industriesManufacturing industries
Manufacturing industries
 
industrial analysis
industrial analysisindustrial analysis
industrial analysis
 
Manufacturing industries
Manufacturing industriesManufacturing industries
Manufacturing industries
 

Similar to Manufacturing Analysis

Update on the Illinois and MSA Economies and the Housing Market
Update on the Illinois and MSA Economies and the Housing MarketUpdate on the Illinois and MSA Economies and the Housing Market
Update on the Illinois and MSA Economies and the Housing MarketIllinois Association of REALTORS®
 
Finlight Research - Market Perspectives - May 2015
Finlight Research - Market Perspectives - May 2015Finlight Research - Market Perspectives - May 2015
Finlight Research - Market Perspectives - May 2015FinLight Research
 
Finlight Research - Market Perspectives - Apr 2016
Finlight Research - Market Perspectives - Apr 2016Finlight Research - Market Perspectives - Apr 2016
Finlight Research - Market Perspectives - Apr 2016FinLight Research
 
FinLight Research - Market perspectives Jan 2014
FinLight Research - Market perspectives   Jan 2014FinLight Research - Market perspectives   Jan 2014
FinLight Research - Market perspectives Jan 2014Zouheir Ben Tamarout
 
FinLight Research - Market Perspectives Apr 2014
FinLight Research - Market Perspectives Apr 2014FinLight Research - Market Perspectives Apr 2014
FinLight Research - Market Perspectives Apr 2014Zouheir Ben Tamarout
 
Finlight Research - Market Perspectives - Apr 2015
Finlight Research - Market Perspectives - Apr 2015Finlight Research - Market Perspectives - Apr 2015
Finlight Research - Market Perspectives - Apr 2015Zouheir Ben Tamarout
 
Finlight Research - Market Perspectives - Oct 2016
Finlight Research - Market Perspectives - Oct 2016Finlight Research - Market Perspectives - Oct 2016
Finlight Research - Market Perspectives - Oct 2016FinLight Research
 
Will the Momentum coming out of 2013 Carry Our Growth Through 2014?
Will the Momentum coming out of 2013 Carry Our Growth Through 2014?Will the Momentum coming out of 2013 Carry Our Growth Through 2014?
Will the Momentum coming out of 2013 Carry Our Growth Through 2014?Lawrence R. Levin
 
June 2015 U.S. employment update and outlook
June 2015 U.S. employment update and outlookJune 2015 U.S. employment update and outlook
June 2015 U.S. employment update and outlookJLL
 
Caixin china pmi manufacturing
Caixin china pmi manufacturingCaixin china pmi manufacturing
Caixin china pmi manufacturingRepublikaDigital
 
FinLight Research - Market Perspectives - Nov 2013
FinLight Research - Market Perspectives - Nov 2013FinLight Research - Market Perspectives - Nov 2013
FinLight Research - Market Perspectives - Nov 2013Zouheir Ben Tamarout
 
Markit Economics 051013
Markit Economics 051013Markit Economics 051013
Markit Economics 051013Chand Sooran
 
Finlight Research - Market Perspectives - Aug 2016
Finlight Research - Market Perspectives - Aug 2016Finlight Research - Market Perspectives - Aug 2016
Finlight Research - Market Perspectives - Aug 2016FinLight Research
 
Jim Rounds - Economic Outlook for Maricopa Event
Jim Rounds - Economic Outlook for Maricopa EventJim Rounds - Economic Outlook for Maricopa Event
Jim Rounds - Economic Outlook for Maricopa EventCity of Maricopa
 
September 2015 U.S. employment update and outlook
September 2015 U.S. employment update and outlookSeptember 2015 U.S. employment update and outlook
September 2015 U.S. employment update and outlookJLL
 
Finlight Research - Market Perspectives - Mar 2016
Finlight Research - Market Perspectives - Mar 2016Finlight Research - Market Perspectives - Mar 2016
Finlight Research - Market Perspectives - Mar 2016FinLight Research
 
FinLight Research - Market perspectives Feb 2014
FinLight Research - Market perspectives Feb 2014FinLight Research - Market perspectives Feb 2014
FinLight Research - Market perspectives Feb 2014Zouheir Ben Tamarout
 
February 2016 U.S. employment update and outlook
February 2016 U.S. employment update and outlook February 2016 U.S. employment update and outlook
February 2016 U.S. employment update and outlook JLL
 

Similar to Manufacturing Analysis (20)

Update on the Illinois and MSA Economies and the Housing Market
Update on the Illinois and MSA Economies and the Housing MarketUpdate on the Illinois and MSA Economies and the Housing Market
Update on the Illinois and MSA Economies and the Housing Market
 
Finlight Research - Market Perspectives - May 2015
Finlight Research - Market Perspectives - May 2015Finlight Research - Market Perspectives - May 2015
Finlight Research - Market Perspectives - May 2015
 
Finlight Research - Market Perspectives - Apr 2016
Finlight Research - Market Perspectives - Apr 2016Finlight Research - Market Perspectives - Apr 2016
Finlight Research - Market Perspectives - Apr 2016
 
FinLight Research - Market perspectives Jan 2014
FinLight Research - Market perspectives   Jan 2014FinLight Research - Market perspectives   Jan 2014
FinLight Research - Market perspectives Jan 2014
 
FinLight Research - Market Perspectives Apr 2014
FinLight Research - Market Perspectives Apr 2014FinLight Research - Market Perspectives Apr 2014
FinLight Research - Market Perspectives Apr 2014
 
Finlight Research - Market Perspectives - Apr 2015
Finlight Research - Market Perspectives - Apr 2015Finlight Research - Market Perspectives - Apr 2015
Finlight Research - Market Perspectives - Apr 2015
 
Finlight Research - Market Perspectives - Oct 2016
Finlight Research - Market Perspectives - Oct 2016Finlight Research - Market Perspectives - Oct 2016
Finlight Research - Market Perspectives - Oct 2016
 
Will the Momentum coming out of 2013 Carry Our Growth Through 2014?
Will the Momentum coming out of 2013 Carry Our Growth Through 2014?Will the Momentum coming out of 2013 Carry Our Growth Through 2014?
Will the Momentum coming out of 2013 Carry Our Growth Through 2014?
 
June 2015 U.S. employment update and outlook
June 2015 U.S. employment update and outlookJune 2015 U.S. employment update and outlook
June 2015 U.S. employment update and outlook
 
Caixin china pmi manufacturing
Caixin china pmi manufacturingCaixin china pmi manufacturing
Caixin china pmi manufacturing
 
FinLight Research - Market Perspectives - Nov 2013
FinLight Research - Market Perspectives - Nov 2013FinLight Research - Market Perspectives - Nov 2013
FinLight Research - Market Perspectives - Nov 2013
 
Markit Economics 051013
Markit Economics 051013Markit Economics 051013
Markit Economics 051013
 
Finlight Research - Market Perspectives - Aug 2016
Finlight Research - Market Perspectives - Aug 2016Finlight Research - Market Perspectives - Aug 2016
Finlight Research - Market Perspectives - Aug 2016
 
Jim Rounds - Economic Outlook for Maricopa Event
Jim Rounds - Economic Outlook for Maricopa EventJim Rounds - Economic Outlook for Maricopa Event
Jim Rounds - Economic Outlook for Maricopa Event
 
September 2015 U.S. employment update and outlook
September 2015 U.S. employment update and outlookSeptember 2015 U.S. employment update and outlook
September 2015 U.S. employment update and outlook
 
Mni chicago press_release_2014-04
Mni chicago press_release_2014-04Mni chicago press_release_2014-04
Mni chicago press_release_2014-04
 
Finlight Research - Market Perspectives - Mar 2016
Finlight Research - Market Perspectives - Mar 2016Finlight Research - Market Perspectives - Mar 2016
Finlight Research - Market Perspectives - Mar 2016
 
FinLight Research - Market perspectives Feb 2014
FinLight Research - Market perspectives Feb 2014FinLight Research - Market perspectives Feb 2014
FinLight Research - Market perspectives Feb 2014
 
February 2016 U.S. employment update and outlook
February 2016 U.S. employment update and outlook February 2016 U.S. employment update and outlook
February 2016 U.S. employment update and outlook
 
FNB
FNBFNB
FNB
 

Manufacturing Analysis