1. 1
The City of Houston’s Finances
Is Now The Time To Raise
Property Taxes?
September 9, 2015 | No. 2 | Greater Houston Partnership | Municipal Finance Task Force
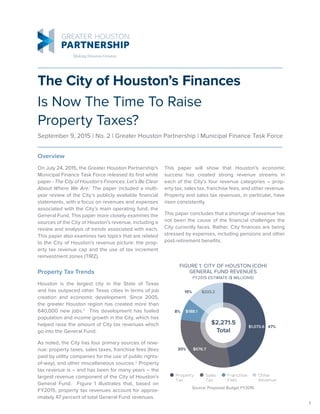
FIGURE 1: CITY OF HOUSTON (COH)
GENERAL FUND REVENUES
FY2015 ESTIMATE ($ MILLIONS)
Source: Proposed Budget FY2016
Sales
Tax
Property
Tax
Franchise
Fees
Other
Revenue
$1,073.6
$676.7
$188.1
$333.2
$2,271.5
Total
47%
30%
8%
15%
Property Tax Trends
Houston is the largest city in the State of Texas
and has outpaced other Texas cities in terms of job
creation and economic development. Since 2005,
the greater Houston region has created more than
640,000 new jobs.2
This development has fueled
population and income growth in the City, which has
helped raise the amount of City tax revenues which
go into the General Fund.
As noted, the City has four primary sources of reve-
nue: property taxes, sales taxes, franchise fees (fees
paid by utility companies for the use of public rights-
of-way), and other miscellaneous sources.3
Property
tax revenue is – and has been for many years – the
largest revenue component of the City of Houston’s
General Fund. Figure 1 illustrates that, based on
FY2015, property tax revenues account for approx-
imately 47 percent of total General Fund revenues.
Overview
On July 24, 2015, the Greater Houston Partnership’s
Municipal Finance Task Force released its first white
paper - The City of Houston’s Finances: Let’s Be Clear
About Where We Are.1
The paper included a multi-
year review of the City’s publicly available financial
statements, with a focus on revenues and expenses
associated with the City’s main operating fund, the
General Fund. This paper more closely examines the
sources of the City of Houston’s revenue, including a
review and analysis of trends associated with each.
This paper also examines two topics that are related
to the City of Houston’s revenue picture: the prop-
erty tax revenue cap and the use of tax increment
reinvestment zones (TIRZ).
This paper will show that Houston’s economic
success has created strong revenue streams in
each of the City’s four revenue categories – prop-
erty tax, sales tax, franchise fees, and other revenue.
Property and sales tax revenues, in particular, have
risen consistently.
This paper concludes that a shortage of revenue has
not been the cause of the financial challenges the
City currently faces. Rather, City finances are being
stressed by expenses, including pensions and other
post-retirement benefits.
2. 2
Property Tax Values and Rates
Property taxes (also referred to as “ad valorem”
taxes) are both a function of property values and the
property tax rate. The tax rate is typically expressed
as an amount per $100 of the property’s assessed
valuation. Property values are established annually
for all taxing jurisdictions in Harris County by the
Harris County Appraisal District (HCAD). By law,
residential property valuations with homestead
exemptions cannot increase by more than 10 percent
in a year.5
Commercial property valuations can and
recently have increased by more than 10 percent per
year. Notably, the new property tax appraisals that
led to record City property tax revenue collections
in FY2014 and FY2015 drew a record number of
formal protests from both the business community
and homeowners. Some businesses faced tax
increases of more than 25 percent. The Harris
County Appraisal District received over 200,000
commercial and residential protests during its
2014 cycle alone.6
The current property tax rate in the City is 63.9
cents per $100 of the property’s assessed value.7
Thus, for what is often referred to as a “typical”
Houston home with an assessed home valuation
of $150,000, the property tax for that home equals
1,500 times $.639, or $958.50.
FIGURE 2: COH PROPERTY TAX REVENUE
FY1991 – FY2015
AVERAGE ANNUAL GROWTH RATE: 4.3%$ Millions
200
100
0
300
400
500
600
700
800
900
1,000
1,100
1,200
FY
’91
FY
’92
FY
’93
FY
’94
FY
’95
FY
’96
FY
’97
FY
’98
FY
’99
FY
’00
FY
’01
FY
’02
FY
’03
FY
’04
FY
’05
FY
’06
FY
’07
FY
’08
FY
’09
FY
’10
FY
’11
FY
’12
FY
’13
FY
’14
FY
’15
A review of the City’s historical property tax reve-
nues (shown in Figure 2) demonstrates a steady
upward trend, with periods of increases and brief
plateaus that correspond to the region’s economic
performance. For example, from FY1991 – FY1997,
property tax revenues increased by $61 million total,
or 2.5 percent per year. From FY1997 – FY2009,
property tax revenues increased by $443 million, or
5.9 percent per year. After the “Great Recession,”
property tax revenues flattened. Then, as Hous-
ton led the nation in recovery between FY2011 and
FY2015, property tax revenues increased approxi-
mately $210 million, or 5.6 percent per year.
The City estimates it collected approximately $1.073
billion in property taxes in FY2015 (ending June 30,
2015),4
which represents a 97% increase since 2000.
3. 3
CommercialResidential Industrial Personal
FIGURE 3: ASSESSED VALUE OF TAXABLE PROPERTY BY TYPE (COH)
120.0
100.0
80.0
60.0
40.0
20.0
.0
$ Billions
FY2005FY2002 FY2008 FY2011 FY2014
($ Billions)
Property Type FY2002 % FY2005 % FY2008 % FY2011 % FY2014 %
FY2005–FY2014
Compound Annual
Growth Rate
Residential 53.8 50% 67.3 55% 84.3 49% 90.0 48% 96.7 44% 4%
Commercial 43.6 41% 44.1 36% 75.2 43% 84.3 45% 103.3 47% 10%
Industrial 7.1 7% 7.9 7% 11.7 7% 11.5 6% 17.6 8% 9%
Personal 2.8 3% 2.5 2% 2.5 1% 2.3 1% 2.3 1% -1%
Total 107.3 100% 121.8 100% 173.8 100% 188.0 100% 219.9 100% 7%
Figure 3 shows the total values of the four major
property categories in the City of Houston: 1)
residential, including single family and multifamily,
2) commercial, or land and improvements devoted
to business activities, 3) industrial, or land and
improvements devoted to the development,
manufacturing, fabrication, processing or storage
of a product, and 4) personal, meaning all tangible
personal property used by commercial businesses
to produce income, including fixtures, equipment
and inventory.8
Between FY2005 and FY2014, total
commercial and industrial values grew at more
than twice the rate of total residential values. Over
that same period, commercial and industrial values
together rose from 43% to 55% of the total.
Properties held by non-profit organizations are
generally exempt from property taxation. Valuations
of owner-occupied residences are limited by
so-called “homestead exemptions,” as well as
exemptions for senior citizens and disabled citizens.9
4. 4
Other Factors Impacting City Property Tax Revenues
The City tax revenue picture becomes more
complex when you take into account other policy
decisions that impact the amount of property tax
revenue available to the City through the General
Fund. The amount of tax revenue collected by
the City has been reduced due to property tax
exemption and discretionary decreases in the
tax rate. In order to stay within the revenue cap in
FY2016, the City chose to double the senior and
disabled property tax exemption from $80,000 to
$160,000 rather than lower the ad valorem tax rate.
It is also important to note that there are many other
entities whose property taxing power overlaps with
the City’s, including independent school districts,
community colleges, municipal utility districts, and
road and water authorities.
Property Tax "Revenue Cap"
With the intention of limiting the growth of City
expenses to roughly the City’s growth rate, a voter
referendum in 2004 put in place a “floating cap”
on the City’s property tax revenue. The property
tax revenue cap ties property tax revenue growth
to the lesser of 1) population growth plus consumer
price index inflation (cumulative over time) or 2) a 4.5
percent year over year growth rate.10
In 2006, Hous-
ton voters added $90 million to the cap exclusively
to fund public safety.
By its construction, this floating cap allows the City’s
ad valorem revenues to increase; it is not a hard,
fixed cap. In FY2015, the revenue cap came back
into play for the first time in many years.
FIGURE 4: COH AD VALOREM REVENUE (ADOPTED BUDGET)
VS. REVENUE CAP
FY2011 – FY2016
Adopted Budget Prop 1 + H Cap
$ Millions
$200
$400
$600
$800
$1,000
$1,200
FY2011 FY2012 FY2013 FY2014 FY2015
$949.3
$846.1
$842.5
$900.2
$945.4
$1,067.3
$1,114.0
$965.0
$995.1
$1,036.1
FY2016
5. 5
Tax Increment Reinvestment Zones
Another important City property tax policy is its use
of tax increment reinvestment zones (TIRZ). TIRZ
are a program governed by Chapter 311 of the Texas
Local Government Code. They are used as a targeted
economic development tool that contributes to the
construction of public infrastructure improvements,
schools, affordable housing, parks, and other
cultural projects. TIRZ can be created either by
petition or initiated by the City. The City of Houston
currently has 25 active TIRZ, with three more
currently proposed.
When a TIRZ is created, the total property values
within its geographic area, and consequently that
area’s property tax revenues going to the General
Fund, are held constant. Any growth in property
values and equivalent property tax revenue (the
“increment”) above that base amount goes to that
TIRZ’s redevelopment authority. These authorities
are largely self-governing, with boards of directors,
budgets, and project plans that are ultimately
approved by City Council. The incremental property
tax revenues collected through the TIRZ are not
subject to the City’s property tax revenue cap. In
some cases, there is an additional revenue increment
associated with school district property taxes.
TIRZ revenue is either sent back to the City or used
to fund public projects, which ultimately become City
assets. These projects augment the City’s capital
improvement plan, which is the City’s five-year plan
for capital projects and equipment purchases.
In FY2015, TIRZ collected approximately $103
million in revenues. Of that amount, $5.3 million was
sent to the General Fund and $1.6 million went to
the City’s Affordable Housing Fund. The remaining
$96.2 million was paid to TIRZ authorities.11
TIRZ are designed to reinvest economic gains back
into specific areas, spurring further redevelopment.
Going forward, the benefits that TIRZ provide should
be carefully monitored along with their contribution
to the City’s capital improvement objectives. The
TIRZ structure must also be balanced against
the impact on the City’s General Fund property
tax collections.
Sales Tax
While property taxes are the largest single General
Fund revenue source, other types of revenue
also factor significantly into the City’s budget. In
FY2015, sales taxes, the second largest source,
accounted for approximately 30 percent of General
Fund revenues. In the City of Houston, an 8.25
percent sales tax is applied. The Metropolitan
Transit Authority (METRO) receives 1 percent, and
the State of Texas receives 7.25 percent. The State
Comptroller remits a 1 percent share back to the
City, after withholding a small service charge from
that amount. Like property tax revenues, sales tax
revenues generally correspond to the Houston
region’s economic performance. Between 1998 and
2015, sales tax revenues have grown at an average
of 5.1 percent annually.
Other General Fund Revenues
The third largest category of General Fund revenues
is franchise fees. Various utility companies, including
electric, natural gas, telephone, cable TV, and solid
waste haulers, pay these fees to the City for use
of public rights-of-way. Franchise fees constituted
8.3 percent of the City’s General Fund revenues
in FY2015.12
Remaining General Fund revenues
include license and permit fees, fines, interest on
investments, and charges for services. Together,
they accounted for 14.7 percent of General Fund
revenue in FY2015.
6. 6
Conclusion
Our first white paper presented an overview of the
City’s finances in the context of a national rating
agency changing Houston’s debt rating outlook to
“negative” and the marked increase in the City’s
unfunded liability to its employee retirement plans
in recent years. This second paper examines in
more detail the City’s revenue sources, focusing
more specifically on the strong growth in property
tax revenue. While that growth may not continue
at the extraordinary rates of the past few years,
we expect that property tax revenue will remain a
steady and growing revenue source to fund City
operations for many years to come. But, to state the
obvious, property tax revenue as a source of City
funding is not unlimited and property tax payments
have become an increasing burden on homeowners
and businesses in the City.
Despite strong revenue growth, the City has seen
a rapid increase in expenses associated with
employee pension costs even as it has seen an
increase in unfunded pension liabilities. The City
currently projects General Fund budget deficits
going forward for each year through FY 2020 in
excess of $100 million per year. The City’s projected
budget deficits can no longer responsibly be closed
through asset sales or other one-time fixes, as has
often been done in the past.
The people of Houston, as they always have, will
come together to solve this financial problem. As
this paper has shown, the problem is not principally
a revenue problem. The solution must principally
come from a focus on expenses, including limiting or
eliminating the rapid growth in pension expense and
unfunded liabilities. This is a topic we will address in
future white papers as part of our effort to outline a
path for the City to a stable financial future.
Sources
1
Available at http://ghp.informz.net/GHP/data/images/Public%20Policy/Municipal%20Finance/Municipal%20Finance-FINAL.pdf
2
United States Bureau of Labor Statistics
3
Sources: CAFR FY2000-FY2014
4
Sources: CAFR FY2000-FY2014
5
HCAD, see http://www.hcad.org/Help/CappedValues.asp
6
Tax protests flood in as deadline looms, KPRC, June 2 2014, http://www.khou.com/story/news/local/2014/07/25/12501894/
7
Source: FY2016 Adopted Budget
8
http://comptroller.texas.gov/taxinfo/proptax/pdf/96-1425.pdf
9
CAFR 2014; Biennial Property Tax Report, Tax Years 2012 and 2013, Texas Comptroller of Public Accounts, December 2014
10
Election held in 2004 (Proposition 1), it limits the growth of City’s property tax revenue to the lesser of cumulative population and
inflation growth over a 2005 base or 4.5% growth over the previous year’s actual collections. Proposition H, passed in 2006,
allows City officials to raise an additional $90 million above the applicable revenue limitation for public safety purposes.
11
CoH City Council Agenda - 6/9/2015, Agenda Item 27
12
Sources: CAFR FY2000-FY2014, Proposed Budget FY2016