SlideShare a Scribd company logo
1 of 22
B Y : J O S H Q U I N T A N I L L A
Racial Discrimination Among
Mexicans Living in the U.S.:
Their Perceptions and Experiences
Overview
 The U.S. population will soar to 438 million by 2050
and the Hispanic population will triple (Pew Research Center).
 Hispanics will make up 29% of the U.S. population in
2050 (Pew Research Center).
 U.S. Census Bureau Report issued in June 2004
estimates that 6.5 percent of the U.S. population is
defined as Mexican.
 It is important to investigate how Mexicans
understand their treatment in society.
Overview
 This presentation will hypothesize the factors that
lead to discrimination
 Nationality
 Language Ability
 Education
 Legal Status
 Skin Tone
 Martial Status
 Participants reported their experiences regarding
discrimination
 Participants were given consent forms in order to
conduct an ethical interview.
Methods
 Participants & Procedures
 Areas of Canton, Woodstock & Alpharetta
 Mexicans and Mexican Americans
 Snowball sampling
 35 Face-to-Face Interviews
 About 8-10 min. per interview
 Telephone Interviews
 Interviews were conducted in Spanish & English
Gender Years Living in the U.S.
56% 44%
Male Female
3%
9%
31%
34%
9% 11%
3%
0%
5%
10%
15%
20%
25%
30%
35%
40%
General Demographics
Places of Discrimination
School
16%
Work
23%
Gov't
institutions
26%
Restaurants
/Stores
29%
Other
6%
What causes discrimination?
0%
10%
20%
30%
40%
50%
60%
70%
12%
23%
3%
62%
Nationality
Nationality & Less Respect
Once in while
61%
39%
Native-born Foreign-born
Native-born
Foreign-born
41%
50%
Findings: Nationality
Chi-Square value .467 Not significant
Gamma of -.08 Weak association
Nationality and Poorer
Service in Restaurants and
Stores, once in a while
Significance & Association
0%
10%
20%
30%
40%
50%
60%
59%
36%
 Chi-Square Value .457
 Not statistically significant
 Gamma .10
 Moderate association
Findings: Nationality & Poor Service
Language skills
Language Skills and
Employment/Promotion
Denial
60%
40%
Spanish Bilingual
0%
10%
20%
30%
40%
50%
60%
70%
80%
Only
Spanish
Bilingual
77%
40%
Findings: Language Skills
Chi-Square value .037 Significant
Lambda of .21 Moderate association
Education Level
Education and Discrimination/Unfair
Treatment by Individuals of Their
Own Race
0%
5%
10%
15%
20%
25%
30% 27%
23%
26%
17%
3% 2%
32%
42%
26%
High school graduates
Some college
College graduates
Chi-Square value .567 Not significant
Gamma of .12 Weak association
Findings: Level of Education
Findings: Legal Status
Undocumented
51%
Student visa
3%
Resident
20%
Citizen
26%
Findings:
Legal Status &
Racial
Slurs/Epithets
Undocumented
Mexicans are more
likely than Mexican
citizens and
residents to have
experienced racial
insults and offensive
names against them
in the past 5 to 10
years
0%
10%
20%
30%
40%
50%
60%
70%
80%
77%
29%
38%
Undocumented Resident Citizen
Chi-Square value .046 Statistically significant
Lambda of .20 Moderate association
Findings: Legal Status & Discrimination/Unfair
treatment by individuals of their own race
Undocumented
83%
Residents
17%
Undocumented Mexicans are more
likely than Residents to experiences
racial discrimination and unfair
treatment by individuals of their own
race
Chi-square value .019 Significant
Lambda of .23 Moderate association
Classification of Skin tones
Very Dark Dark Medium Light Very Light
Findings: Skin Tones
Light
21%
Medium
75%
Dark
4%
Skin tone and
Physical
Fights
Mexicans with
medium skin tones
are more likely
than those who are
light skinned to
have been in a
physical fight in
the past 5 to 10
years
36%
61%
Light
Medium
Chi-square value of .037 Statistically significant
With a lambda of .31 Evidence of a strong association
Martial Status
Martial Status and
Physical Fights
32%
59%
3%
3%3%
Single Married
Separated Divorced
N/A
0%
20%
40%
60%
80%
100%
81%
28%
Single Married
Findings: Martial Status
Chi-Square value .020 Statistically significant
Lambda of 3.9 Evidence of strong association
Discussion
 As we can see, racial discrimination against
Mexicans and Americans with Mexican descent
(Chicanos) living in the U.S. still exists today.
 We have found that those individuals who are
undocumented, single, medium skin toned, and
those who do not have the ability to speak English
are more inclined to be the victims of racial
discrimination and unfair treatment in society.
Discussion: Why Does Discrimination Still Occur?
 Discrimination most often takes the form of ignorance.
 For those who have limited social worlds, one bad
experience with a member of a particular group is easily
generalized into a negative perception of everyone
belonging to that group.
 Undocumented Immigrants tend to be discriminated
against because they do not have equal rights as citizens
do.
 People are sometimes subjected to different treatments
because their primary/official language is associated with
a particular group, class or category.
Discussion: Further Investigations
 Since the study only consisted of 35 participants,
further research needs to be conducted to
accomplish a more representative sample.
 Because of ethical reasons, minors were not included
in this study. However, it is important that there be a
specific study devoted to minors in the future.
 Finally, in order to fully understand racial
discrimination among Latinos, additional groups of
minorities need to be included for future studies.
 Thank you for your time!

More Related Content

Similar to Racial Discrimination Among Mexicans in the U.S

Analyzing the western states projected demographics through 2020
Analyzing the western states projected demographics through 2020Analyzing the western states projected demographics through 2020
Analyzing the western states projected demographics through 2020czjones
 
Working with hispanic families
Working with hispanic familiesWorking with hispanic families
Working with hispanic familiesCarlos F Martinez
 
Mexican american presentation
Mexican american presentationMexican american presentation
Mexican american presentationSwilkerson15
 
Aetna Presentation Latino Demographics
Aetna Presentation Latino DemographicsAetna Presentation Latino Demographics
Aetna Presentation Latino DemographicsDanny Santibanez
 
A New Political Beat- Beyond Red and Blue States
A New Political Beat- Beyond Red and Blue StatesA New Political Beat- Beyond Red and Blue States
A New Political Beat- Beyond Red and Blue StatesLerma Agency
 
Minority Groups In Canada
Minority Groups In CanadaMinority Groups In Canada
Minority Groups In CanadaLindsey Rivera
 
DSS presentation poster edit1
DSS presentation poster edit1DSS presentation poster edit1
DSS presentation poster edit1Asad Ahmed
 
Running head DROPOUT RATES OF AFRICAN AMERICAN MALES IN SPECI.docx
Running head DROPOUT RATES OF AFRICAN AMERICAN MALES IN SPECI.docxRunning head DROPOUT RATES OF AFRICAN AMERICAN MALES IN SPECI.docx
Running head DROPOUT RATES OF AFRICAN AMERICAN MALES IN SPECI.docxjeanettehully
 
Presentation+of+review+paper+ +shamecca+perkins
Presentation+of+review+paper+ +shamecca+perkinsPresentation+of+review+paper+ +shamecca+perkins
Presentation+of+review+paper+ +shamecca+perkinsShamecca Perkins
 
Edl 840 culture and ethnicity presentation Mexican American Males
Edl 840 culture and ethnicity presentation Mexican American MalesEdl 840 culture and ethnicity presentation Mexican American Males
Edl 840 culture and ethnicity presentation Mexican American MalesJanet Ilko
 
African Americans
African AmericansAfrican Americans
African Americansst john
 
6-27-13 AHAA Generational Cultural Orientation Webinar Sponsored by AARP
6-27-13 AHAA Generational Cultural Orientation Webinar Sponsored by AARP6-27-13 AHAA Generational Cultural Orientation Webinar Sponsored by AARP
6-27-13 AHAA Generational Cultural Orientation Webinar Sponsored by AARPAHAA: The Voice of Hispanic Marketing
 
AHAA Generational Cultural Orientation Webinar_short_deck_06-27-13_final
AHAA Generational Cultural Orientation Webinar_short_deck_06-27-13_finalAHAA Generational Cultural Orientation Webinar_short_deck_06-27-13_final
AHAA Generational Cultural Orientation Webinar_short_deck_06-27-13_finalSantiago Solutions Group
 
Discrimination in american society
Discrimination in american societyDiscrimination in american society
Discrimination in american societyСНУЯЭиП
 
Ahaa gen co members only web acc vs co 09-24-13-f
Ahaa gen co members only web acc vs co 09-24-13-fAhaa gen co members only web acc vs co 09-24-13-f
Ahaa gen co members only web acc vs co 09-24-13-fSantiago Solutions Group
 

Similar to Racial Discrimination Among Mexicans in the U.S (20)

Analyzing the western states projected demographics through 2020
Analyzing the western states projected demographics through 2020Analyzing the western states projected demographics through 2020
Analyzing the western states projected demographics through 2020
 
Working with hispanic families
Working with hispanic familiesWorking with hispanic families
Working with hispanic families
 
Mexican american presentation
Mexican american presentationMexican american presentation
Mexican american presentation
 
Hispanic Culture for Educators
Hispanic Culture for EducatorsHispanic Culture for Educators
Hispanic Culture for Educators
 
Aetna Presentation Latino Demographics
Aetna Presentation Latino DemographicsAetna Presentation Latino Demographics
Aetna Presentation Latino Demographics
 
A New Political Beat- Beyond Red and Blue States
A New Political Beat- Beyond Red and Blue StatesA New Political Beat- Beyond Red and Blue States
A New Political Beat- Beyond Red and Blue States
 
Minority Groups In Canada
Minority Groups In CanadaMinority Groups In Canada
Minority Groups In Canada
 
DSS presentation poster edit1
DSS presentation poster edit1DSS presentation poster edit1
DSS presentation poster edit1
 
Casey Family Program
Casey Family ProgramCasey Family Program
Casey Family Program
 
Working with Latino Families
Working with Latino FamiliesWorking with Latino Families
Working with Latino Families
 
ECPY 663
ECPY 663ECPY 663
ECPY 663
 
Running head DROPOUT RATES OF AFRICAN AMERICAN MALES IN SPECI.docx
Running head DROPOUT RATES OF AFRICAN AMERICAN MALES IN SPECI.docxRunning head DROPOUT RATES OF AFRICAN AMERICAN MALES IN SPECI.docx
Running head DROPOUT RATES OF AFRICAN AMERICAN MALES IN SPECI.docx
 
Presentation+of+review+paper+ +shamecca+perkins
Presentation+of+review+paper+ +shamecca+perkinsPresentation+of+review+paper+ +shamecca+perkins
Presentation+of+review+paper+ +shamecca+perkins
 
Edl 840 culture and ethnicity presentation Mexican American Males
Edl 840 culture and ethnicity presentation Mexican American MalesEdl 840 culture and ethnicity presentation Mexican American Males
Edl 840 culture and ethnicity presentation Mexican American Males
 
African Americans
African AmericansAfrican Americans
African Americans
 
6-27-13 AHAA Generational Cultural Orientation Webinar Sponsored by AARP
6-27-13 AHAA Generational Cultural Orientation Webinar Sponsored by AARP6-27-13 AHAA Generational Cultural Orientation Webinar Sponsored by AARP
6-27-13 AHAA Generational Cultural Orientation Webinar Sponsored by AARP
 
AHAA Generational Cultural Orientation Webinar_short_deck_06-27-13_final
AHAA Generational Cultural Orientation Webinar_short_deck_06-27-13_finalAHAA Generational Cultural Orientation Webinar_short_deck_06-27-13_final
AHAA Generational Cultural Orientation Webinar_short_deck_06-27-13_final
 
2013 BEYA Seminar: Global Health- Place Matters
2013 BEYA Seminar: Global Health- Place Matters2013 BEYA Seminar: Global Health- Place Matters
2013 BEYA Seminar: Global Health- Place Matters
 
Discrimination in american society
Discrimination in american societyDiscrimination in american society
Discrimination in american society
 
Ahaa gen co members only web acc vs co 09-24-13-f
Ahaa gen co members only web acc vs co 09-24-13-fAhaa gen co members only web acc vs co 09-24-13-f
Ahaa gen co members only web acc vs co 09-24-13-f
 

Racial Discrimination Among Mexicans in the U.S

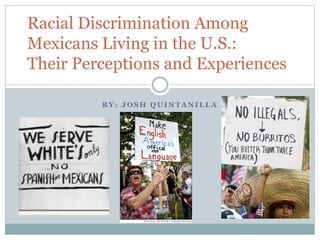
  • 1. B Y : J O S H Q U I N T A N I L L A Racial Discrimination Among Mexicans Living in the U.S.: Their Perceptions and Experiences
  • 2. Overview  The U.S. population will soar to 438 million by 2050 and the Hispanic population will triple (Pew Research Center).  Hispanics will make up 29% of the U.S. population in 2050 (Pew Research Center).  U.S. Census Bureau Report issued in June 2004 estimates that 6.5 percent of the U.S. population is defined as Mexican.  It is important to investigate how Mexicans understand their treatment in society.
  • 3. Overview  This presentation will hypothesize the factors that lead to discrimination  Nationality  Language Ability  Education  Legal Status  Skin Tone  Martial Status  Participants reported their experiences regarding discrimination  Participants were given consent forms in order to conduct an ethical interview.
  • 4. Methods  Participants & Procedures  Areas of Canton, Woodstock & Alpharetta  Mexicans and Mexican Americans  Snowball sampling  35 Face-to-Face Interviews  About 8-10 min. per interview  Telephone Interviews  Interviews were conducted in Spanish & English
  • 5. Gender Years Living in the U.S. 56% 44% Male Female 3% 9% 31% 34% 9% 11% 3% 0% 5% 10% 15% 20% 25% 30% 35% 40% General Demographics
  • 8. Nationality Nationality & Less Respect Once in while 61% 39% Native-born Foreign-born Native-born Foreign-born 41% 50% Findings: Nationality Chi-Square value .467 Not significant Gamma of -.08 Weak association
  • 9. Nationality and Poorer Service in Restaurants and Stores, once in a while Significance & Association 0% 10% 20% 30% 40% 50% 60% 59% 36%  Chi-Square Value .457  Not statistically significant  Gamma .10  Moderate association Findings: Nationality & Poor Service
  • 10. Language skills Language Skills and Employment/Promotion Denial 60% 40% Spanish Bilingual 0% 10% 20% 30% 40% 50% 60% 70% 80% Only Spanish Bilingual 77% 40% Findings: Language Skills Chi-Square value .037 Significant Lambda of .21 Moderate association
  • 11. Education Level Education and Discrimination/Unfair Treatment by Individuals of Their Own Race 0% 5% 10% 15% 20% 25% 30% 27% 23% 26% 17% 3% 2% 32% 42% 26% High school graduates Some college College graduates Chi-Square value .567 Not significant Gamma of .12 Weak association Findings: Level of Education
  • 12. Findings: Legal Status Undocumented 51% Student visa 3% Resident 20% Citizen 26%
  • 13. Findings: Legal Status & Racial Slurs/Epithets Undocumented Mexicans are more likely than Mexican citizens and residents to have experienced racial insults and offensive names against them in the past 5 to 10 years 0% 10% 20% 30% 40% 50% 60% 70% 80% 77% 29% 38% Undocumented Resident Citizen Chi-Square value .046 Statistically significant Lambda of .20 Moderate association
  • 14. Findings: Legal Status & Discrimination/Unfair treatment by individuals of their own race Undocumented 83% Residents 17% Undocumented Mexicans are more likely than Residents to experiences racial discrimination and unfair treatment by individuals of their own race Chi-square value .019 Significant Lambda of .23 Moderate association
  • 15. Classification of Skin tones Very Dark Dark Medium Light Very Light
  • 17. Skin tone and Physical Fights Mexicans with medium skin tones are more likely than those who are light skinned to have been in a physical fight in the past 5 to 10 years 36% 61% Light Medium Chi-square value of .037 Statistically significant With a lambda of .31 Evidence of a strong association
  • 18. Martial Status Martial Status and Physical Fights 32% 59% 3% 3%3% Single Married Separated Divorced N/A 0% 20% 40% 60% 80% 100% 81% 28% Single Married Findings: Martial Status Chi-Square value .020 Statistically significant Lambda of 3.9 Evidence of strong association
  • 19. Discussion  As we can see, racial discrimination against Mexicans and Americans with Mexican descent (Chicanos) living in the U.S. still exists today.  We have found that those individuals who are undocumented, single, medium skin toned, and those who do not have the ability to speak English are more inclined to be the victims of racial discrimination and unfair treatment in society.
  • 20. Discussion: Why Does Discrimination Still Occur?  Discrimination most often takes the form of ignorance.  For those who have limited social worlds, one bad experience with a member of a particular group is easily generalized into a negative perception of everyone belonging to that group.  Undocumented Immigrants tend to be discriminated against because they do not have equal rights as citizens do.  People are sometimes subjected to different treatments because their primary/official language is associated with a particular group, class or category.
  • 21. Discussion: Further Investigations  Since the study only consisted of 35 participants, further research needs to be conducted to accomplish a more representative sample.  Because of ethical reasons, minors were not included in this study. However, it is important that there be a specific study devoted to minors in the future.  Finally, in order to fully understand racial discrimination among Latinos, additional groups of minorities need to be included for future studies.
  • 22.  Thank you for your time!