More Related Content
Similar to 5f4b433e-027c-4d21-961a-929f7b9643bf-141124201617-conversion-gate01
Similar to 5f4b433e-027c-4d21-961a-929f7b9643bf-141124201617-conversion-gate01 (20)
5f4b433e-027c-4d21-961a-929f7b9643bf-141124201617-conversion-gate01
- 1. http://congress-download.pfizer.com/aaps2014_aaps_nb
Please scan this QR code with your smartphone app to view an electronic version of this poster.
If you do not have access to a smartphone, please access the poster via the following link:
http://congress-download.pfizer.com/aaps2014_aaps_nbc_edg_oncology_joseph_chen_1222.html
1222
Poster presented at the 2014 Annual Meeting of the American Association of Pharmaceutical Scientists, November 2–6, 2014, San Diego, CA, USA
Evaluation of a Truncated Pharmacokinetic (PK) Sampling Approach to Estimate Steady State Exposures
for the Gamma Secretase Inhibitor PF-03084014
Joseph Chen, BS1
, M. Naveed Shaik, PhD2
, Rossano Cesari, PhD3
, Kenneth A. Kern, MD, MPH2
1
University of California, San Diego, CA, USA; 2
Pfizer Oncology, La Jolla, CA, USA; 3
Pfizer Oncology, Milan, Italy
BACKGROUND
⦁⦁ An increasing number of procedures is a growing problem in clinical trials.
From 1999 to 2005, study-related procedures rose substantially; unique study
procedures increased by 6.5% and procedural frequency by 8.7% annually. 1
–– In an analysis of 49 phase I trials, there was a mean of 105 events (eg, blood
draws, urine samples, electrocardiograms) per patient over the first 4 weeks
of study.2
–– With the high number of samples required, compounded by the numerous
visits, patient adherence has greatly suffered. Lack of patient adherence can
negatively impact trial outcomes.
⦁⦁ Clinical trial–related testing burden for patients and study sites can be alleviated
by reduced pharmacokinetic (PK) collections.
–– In oncology trials, the need for adequate sampling to characterize drug PK must
be balanced with feasibility, such as patient- and site-related considerations.
–– If less burdensome collections can be shown to accurately predict exposure of
the drug, it will likely improve adherence.
⦁⦁ Two alternative approaches to collecting intensive serial PK samples that can
potentially be used to estimate drug exposure are trough concentration (Ctrough)
and truncated time-point–based area under the concentration–time curve (AUC)
from time zero to tau (AUCtau).
⦁⦁ Although population-based approaches are generally applied in larger phase II/
III trials, the use of Ctrough as a direct measure of AUCtau was evaluated in the
current analysis.
⦁⦁ Additionally, the impact of fewer PK collections to characterize the AUCtau was
also assessed.
–– Within the linear terminal elimination phase, there is a possibility of omitting
select collection times, while still retaining the ability to reliably estimate
steady-state AUCtau.
⦁⦁ PF-03084014, a small molecule gamma-secretase inhibitor currently in clinical
development, dosed twice a day (BID), has a median time to first occurrence of
maximum serum concentration of ~1 h and exhibits first-order kinetics.2
–– In the first-in-patient phase I study in patients with advanced solid tumors,
serial PK profiles and Ctrough samples were collected at steady-state.
⦁⦁ In this analysis, Ctrough was compared with AUCtau to determine correlation.
⦁⦁ For evaluation of truncated time-point AUCtau, 3 different truncations were
compared with full AUCtau, estimated using all time points:
–– 12-h concentration replaced with predose concentration.
–– 12-h concentration replaced with predose minus the 10-h concentration.
–– 12-h concentration replaced with predose minus the 8- and 10-h
concentrations.
–– The replacement of the 12-h concentration with the predose concentrations
was based on the assumption that these would be similar at steady-state and
there are no chronological differences in PK profiles following AM and PM
dosing of PF-03084014.
⦁⦁ The truncated AUCs were then assessed for statistical difference.
OBJECTIVES
⦁⦁ Evaluate if Ctrough is an adequate alternative measure to AUCtau.
⦁⦁ Evaluate if AUCtau using truncated time points is an adequate alternative
measure to estimate steady-state AUCtau based on a full PK profile.
METHODS
⦁⦁ Serial steady-state PK data collected on Cycle 1 Day 21 from 36 patients enrolled
in Study A8641014 were used in this analysis.
⦁⦁ The PF-03084014 dose range tested was 20–330 mg BID, with overall dose-
proportional exposure observed.
⦁⦁ The relationship between Ctrough and AUCtau was evaluated.
⦁⦁ The impact of assigning the predose level as the 12-h postdose concentration
and removing the 8- and 10-h PK time points on the AUCtau estimate was
assessed.
⦁⦁ A mean change of <5% in truncated PK-based AUCtau estimate compared with
AUCtau was chosen a priori as acceptable.
⦁⦁ Phoenix Build 6.3.0.395 (noncompartmental PK analysis; Pharsight Corporation,
Mountain View, CA) and R Studio version 0.98.501 (statistical analysis; RStudio,
Boston, MA) were used for the analysis.
RESULTS
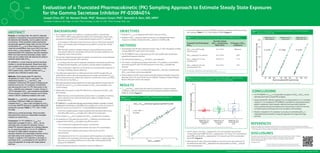
⦁⦁ Ctrough and AUCtau relationship was tested using Pearson’s product-moment
correlation coefficient and found to be well correlated (correlation coefficient
0.969, R2
=0.939) (Figure 1).
Figure 1: Correlation of Ctrough and AUCtau Following Administration of
PF-03084014
log Ctrough (ng/mL)
AUCtau
vs Ctough
with linear regression and 95% Cl (n=36)
y=3.8 + 0.87 · x
R2
=0.939
logAUC(ng·h/mL)
9
10
11
8
7
6
5
2 4 6 8
AUCtau=area under the concentration–time curve (AUC) from time zero to tau; CI=confidence interval; Ctrough=trough concentration.
⦁⦁ A one-way analysis of variance (ANOVA) showed no significant difference among
the 4 groups (Table 1), F (3, 140)=0.006, P=0.999 (Figure 2).
Table 1: Comparison of Truncated Time-Point–Based PF-03084014 AUCtau
Truncated Time-Point–Based
AUCtau
Dose-Normalized
AUCtau (ng·h/mL/mg),
Mean (%CV)
% Change in AUCtau
vs Reference
AUCtau from full PK profile
(all time points)
52.3 (74.9) Reference
AUCtau replacing 12 h with 0 h 52.3 (75.0) –0.01
AUCtau replacing 12 h and
excluding 10 h
52.8 (74.7) 1.16
AUCtau replacing 12 h and
excluding 8 and 10 h
53.4 (73.5) 3.30
% Change in AUCtau = (Reference AUCtau – AUCtau) / Reference AUCtau x 100%
AUCtau=area under the concentration–time curve over the dosing interval; CV=coefficient of variation
Figure 2: Comparison of Truncated Time-Point–Based AUCtau. Percent Over or
Under Predicted Compared With AUCtau, Based on Full PK Profile
Percentageoverorunder
10
20
30
0
Replacing 12 h
with predose
–0.01%
Replacing 12 h
minus 10 h
1.16%
Replacing 12 h
minus 8 & 10 h
3.3%
AUCtau=area under the concentration–time curve from time zero to tau (over the dosing interval); PK=pharmacokinetics
⦁⦁ The R2
value for the AUCtau replacing the 12-h concentration with predose
concentration was 0.999, the AUCtau replacing the 12-h minus 10-h concentration
was 0.996, and the AUCtau replacing the 12-h minus 8- and 10-h concentration
was 0.995 (Figure 3).
⦁⦁ Although the R2
value decreased slightly as more time points were removed, all
truncated time-point AUCtau appeared to be good predictors of AUCtau using all
serial sampling points.
Figure 3: Dose-Normalized Truncated Time-Point AUCtau vs Dose-Normalized
AUCtau, Based on Full PK Profile
Replacing 12 h
with predose
Replacing 12 h
minus 10 h
Replacing 12 h
minus 8 & 10 h
Dose-normalizedAUCall(ng·h/mL/mg)
150
100
50
200
50 100 150 50 100 150 50 100 150
Dose-normalized AUC (ng·h/mL/mg)
R2
=0.999 R2
=0.996 R2
=0.995
AUCtau=area under the concentration–time curve (AUC) from time zero to tau (over the dosing interval); PK=pharmacokinetics
REFERENCES
1. Kurzrock R, Stewart DJ. Compliance in early-phase cancer clinical trials research. The Oncologist 2013;18:308-13.
2. Messersmith WA, Shapiro GI, Cleary JM, et al. A phase I, dose-finding study in patients with advanced solid malignancies
of the oral gamma-secretase inhibitor PF-03084014. Clin Cancer Res 2014;21(2);1-9.
DISCLOSURES
This study was sponsored by Pfizer Inc. M.N. Shaik, R. Cesari, and K.A. Kern were full-time employees
of Pfizer Inc and J. Chen was a contractor of Pfizer Inc during the conduct of this study.
Editorial support was provided by S. Mariani, MD, PhD, of Engage Scientific Solutions,
and was funded by Pfizer Inc.
Copyright © 2014.
ABSTRACT
Purpose: In oncology trials, the need for adequate
sampling to characterize drug pharmacokinetics must
be balanced with feasibility, such as patient and site
convenience. While population-based approaches
are generally applied in larger trials, the use of trough
concentration (Ctrough) as a direct measure of area
under the concentration–time curve (AUC) from zero
to tau (AUCtau) was evaluated. The impact of fewer
pharmacokinetic (PK) collections was also assessed.
Within the linear terminal elimination phase, select
times can be omitted while still retaining the ability to
estimate steady-state AUCtau.
PF-03084014, a small molecule gamma-secretase
inhibitor in clinical development, dosed twice daily,
has a median time to reach maximum concentration
(Tmax) of 1 h and exhibits first-order kinetics. In the
first-in-patient study, serial PK profiles and Ctrough
samples were collected at steady-state.
Methods: Serial steady-state PK data from
36 patients on Cycle 1 Day 21 was used. The
relationship between Ctrough and AUCtau was
evaluated. Furthermore, the impact of assigning the
predose level as the 12-h postdose concentration
and removing the 8 and 10 h PK time points on the
AUCtau estimate were assessed. A mean change of
5% in estimated AUCtau was considered acceptable.
Phoenix Build 6.3.0.395 (PK analysis) and R Studio
version 0.98.501 (statistical analysis) were used.
Results: Ctrough and AUCtau were highly correlated
(correlation coefficient 0.969) and regression
indicated that Ctrough was a valid surrogate for AUCtau.
A one-way ANOVA showed no significant difference
among the 4 groups (Table 1), F (3, 140) = 0.006,
P=0.999.
Differing by a small percentage, these truncated
time-point AUCs serve as a reasonable surrogate
measure for actual AUCtau.
Conclusion: For PF-03084014, Ctrough is a
reasonable surrogate for AUCtau. AUCtau can be
estimated with truncated PK sampling. Using a
limited PK collection approach for oncology patients,
ie, 4-h sampling instead of 12-h for PF-03084014,
will allow for better patient compliance, fewer
samples collected (and associated collection errors),
and sites being more receptive to PK sampling.
Overall, a marginal (4%) reduction in accuracy in
estimating AUCtau is outweighed by the benefits of
using this approach for drugs with longer plasma
half-lives.
CONCLUSIONS
⦁⦁ For PF-03084014, Ctrough is a reasonable surrogate for AUCtau. AUCtau can be
well estimated with truncated PK sampling.
⦁⦁ Using a limited PK collection approach for oncology patients, ie, 4-h sampling
instead of 12-h sampling for PF-03084014, will allow for substantially better
patient compliance, fewer samples collected (and associated collection
errors), patients will only be needed at the clinical site for a third of the time
currently required, and study sites more receptive to PK sampling.
⦁⦁ Overall, a marginal (4%) reduction in accuracy in estimating AUCtau is
outweighed by the benefits of using this approach for drugs with longer
half-lives.