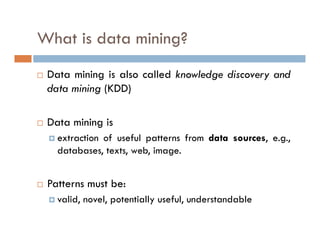
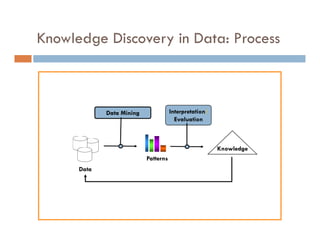
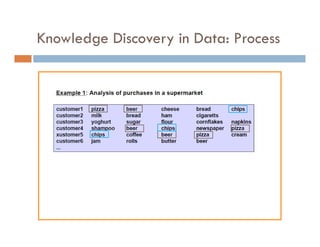
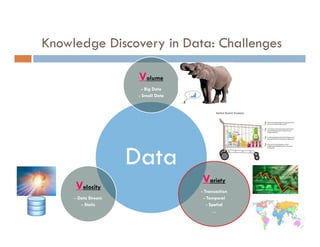
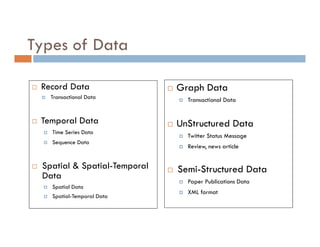
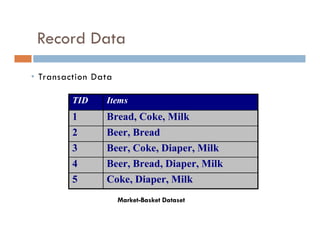
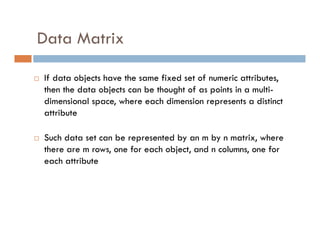
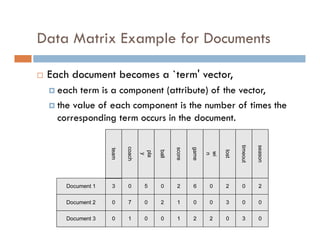
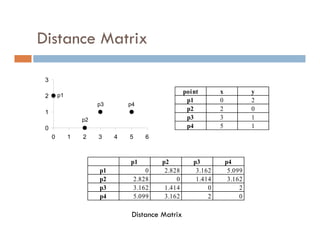
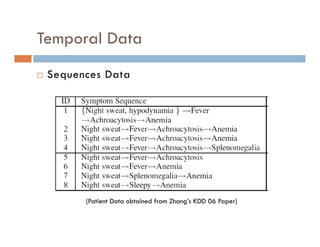
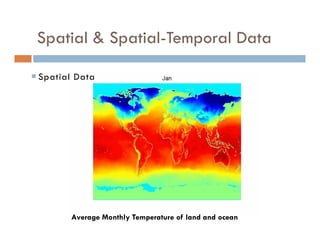
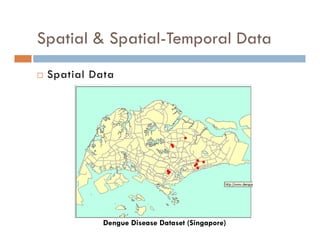
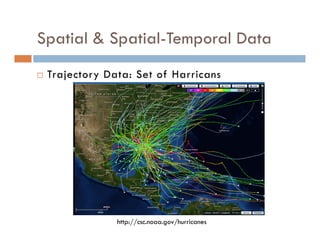
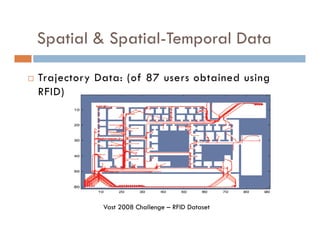
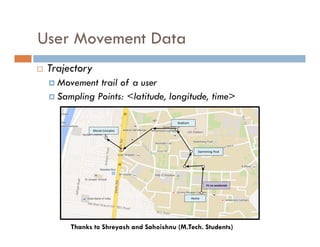
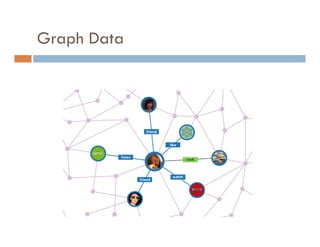
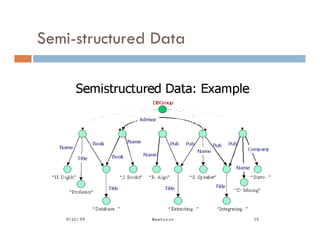
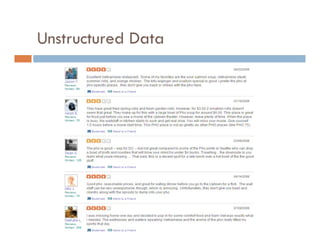
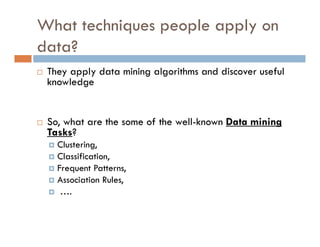
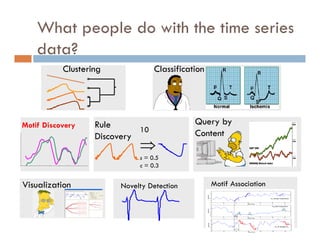
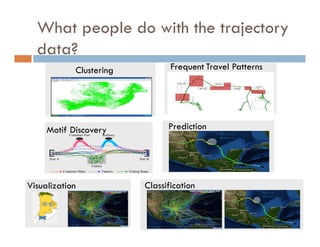
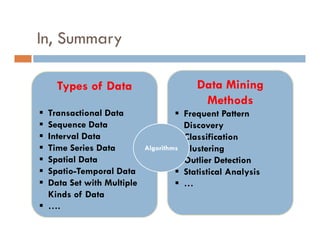
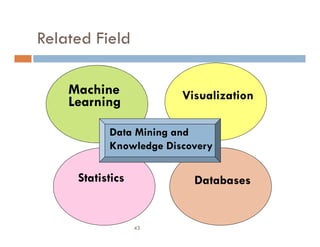
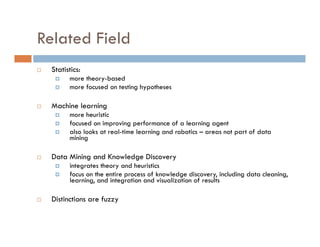
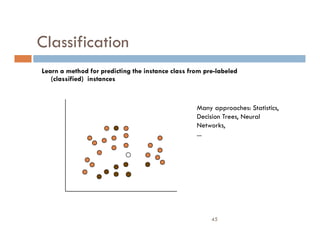
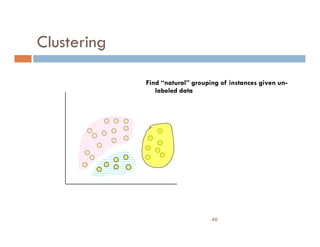
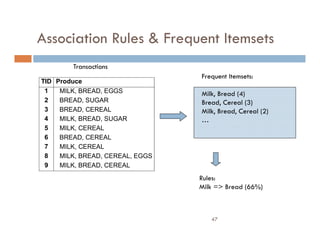
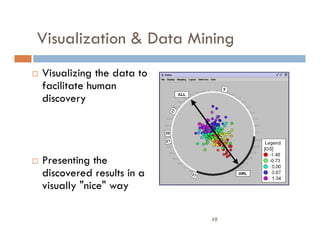
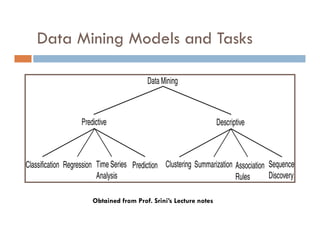
LECTURE 1: INTRODUCTION
TO DATA MINING
Dr. Dhaval Patel
CSE, IIT-Roorkee
What is data mining?
 Data mining is also called knowledge discovery and
data mining (KDD)
 Data mining is
 extraction of useful patterns from data sources, e.g.,
databases, texts, web, image.
 Patterns must be:
 valid, novel, potentially useful, understandable
Data
Knowledge
Knowledge
Patterns
Data Mining
Knowledge Discovery in Data: Process
Interpretation/
Evaluation
Knowledge Discovery in Data: Process
Data
Volume
- Big Data
- Small Data
Variety
- Transaction
- Temporal
- Spatial
…
Velocity
- Data Stream
- Static
Knowledge Discovery in Data: Challenges
5
Outline (Part 1)
 Introduction to Data
 Transactional Data
 Temporal Data
 Spatial & Spatial-Temporal Data
 Data Preprocessing
 Missing Values
 Summarization
INTRODUCTION TO DATA
Data Come from Everywhere
8
Hospital
Stock Exchange
Weather Station
Grocery Markets E-Commerce
Social Media
But, they have different form
What is Data?
 Collection of records and their
attributes
 An attribute is a characteristic of
an object
 A collection of attributes describe
an object
Tid Refund Marital
Status
Taxable
Income Cheat
1 Yes Single 125K No
2 No Married 100K No
3 No Single 70K No
4 Yes Married 120K No
5 No Divorced 95K Yes
6 No Married 60K No
7 Yes Divorced 220K No
8 No Single 85K Yes
9 No Married 75K No
10 No Single 90K Yes
10
Attributes
Objects
Types of Data
 Record Data
 Transactional Data
 Temporal Data
 Time Series Data
 Sequence Data
 Spatial & Spatial-Temporal
Data
 Spatial Data
 Spatial-Temporal Data
 Graph Data
 Transactional Data
 UnStructured Data
 Twitter Status Message
 Review, news article
 Semi-Structured Data
 Paper Publications Data
 XML format
Record Data
TID Items
1 Bread, Coke, Milk
2 Beer, Bread
3 Beer, Coke, Diaper, Milk
4 Beer, Bread, Diaper, Milk
5 Coke, Diaper, Milk
Market-Basket Dataset
• Transaction Data
Data Matrix
 If data objects have the same fixed set of numeric attributes,
then the data objects can be thought of as points in a multi-
dimensional space, where each dimension represents a distinct
attribute
 Such data set can be represented by an m by n matrix, where
there are m rows, one for each object, and n columns, one for
each attribute
Data Matrix Example for Documents
 Each document becomes a `term' vector,
 each term is a component (attribute) of the vector,
 the value of each component is the number of times the
corresponding term occurs in the document.
season
timeout
lost
wi
n
game
score
ball
pla
y
coach
team
Distance Matrix
0
1
2
3
0 1 2 3 4 5 6
p1
p2
p3 p4
point x y
p1 0 2
p2 2 0
p3 3 1
p4 5 1
Distance Matrix
p1 p2 p3 p4
p1 0 2.828 3.162 5.099
p2 2.828 0 1.414 3.162
p3 3.162 1.414 0 2
p4 5.099 3.162 2 0
Temporal Data
 Sequences Data
(Patient Data obtained from Zhang’s KDD 06 Paper)
Temporal Data
 Time Series Data
Yahoo Finance Website
Biological Sequence Data
Interval Data
A
EL= { (A, 1, 5),( C, 3, 12), ( B, 4, 9), ( D, 9, 15) }
C
1 5
3 12
(A overlaps C )
B
4 9
contains B )
(
D
15
overlaps D )
(
time
(Interval Patient Data obtained from Amit’s M.Tech. Thesis Work)
Spatial & Spatial-Temporal Data
(Spatial Distribution of Objects of Various Types : Prof. Shashi Shekhar)
• Spatial Data
Spatial & Spatial-Temporal Data
Average Monthly Temperature of land and ocean
 Spatial Data
Spatial & Spatial-Temporal Data
 Spatial Data
Dengue Disease Dataset (Singapore)
Spatial & Spatial-Temporal Data
 Trajectory Data: Set of Harricans
http://csc.noaa.gov/hurricanes
Spatial & Spatial-Temporal Data
 Trajectory Data: (of 87 users obtained using
RFID)
Vast 2008 Challenge – RFID Dataset
User Movement Data
 Trajectory
 Movement trail of a user
 Sampling Points: <latitude, longitude, time>
P1 on weekends
Home
Swimming Pool
Movie Complex
Stadium
Thanks to Shreyash and Sahoishnu (M.Tech. Students)
Graph Data
Semi-structured Data
Unstructured Data
Data can help us solve specific problems.
How should these pictures be placed
into 3 groups?
How should these pictures be placed into groups?
How many groups should there be?
Which genes are associated with a disease? How can
expression values be used to predict survival?
What items should Amazon display for
me?
Is it likely that this stock was traded
based on illegal insider information?
Where are the faces in this picture?
Is this spam?
Will I like 300?
What techniques people apply on
data?
 They apply data mining algorithms and discover useful
knowledge
 So, what are the some of the well-known Data mining
Tasks?
 Clustering,
 Classification,
 Frequent Patterns,
 Association Rules,
 ….
What people do with the time series
data?
Clustering Classification
Query by
Content
Rule
Discovery
10

s = 0.5
c = 0.3
Motif Discovery
Novelty Detection
Visualization Motif Association
What people do with the trajectory
data?
Clustering
Motif Discovery
Visualization
Frequent Travel Patterns
Classification
Prediction
Types of Data
 Transactional Data
 Sequence Data
 Interval Data
 Time Series Data
 Spatial Data
 Spatio-Temporal Data
 Data Set with Multiple
Kinds of Data
 ….
In, Summary
Data Mining
Methods
 Frequent Pattern
Discovery
 Classification
 Clustering
 Outlier Detection
 Statistical Analysis
 …
Algorithms
Activity 1
 Find top 3 recent research activities around the world
that are analyzing data. You need to write short
summary for each research activities. First three line
must follow following format:
 Line 1: Problem they are trying to sole along with dataset
they are using
 Line 2: How they are solving the problem
 Line 3: Justify yourself why you rate this work as a top 5
activities
 Remaining lines… you can think yourself ….
BigN’Smart Research group at IIT-Roorkee is analyzing “YelpReview”
Dataset for learning Location-to-activity Tagging. They are applying
… . I feel this is an interesting research because …
Activity 2: Why Data Mining ???
 Google
 Facebook
 Netflix
 eHarmony
 FICO
 FlightCaster
 IBM’s Watson
Read
About
Their
Story
Related Field
43
Statistics
Machine
Learning
Databases
Visualization
Data Mining and
Knowledge Discovery
Related Field
 Statistics:
 more theory-based
 more focused on testing hypotheses
 Machine learning
 more heuristic
 focused on improving performance of a learning agent
 also looks at real-time learning and robotics – areas not part of data
mining
 Data Mining and Knowledge Discovery
 integrates theory and heuristics
 focus on the entire process of knowledge discovery, including data cleaning,
learning, and integration and visualization of results
 Distinctions are fuzzy
45
Classification
Learn a method for predicting the instance class from pre-labeled
(classified) instances
Many approaches: Statistics,
Decision Trees, Neural
Networks,
...
46
Clustering
Find “natural” grouping of instances given un-
labeled data
47
Association Rules & Frequent Itemsets
TID Produce
1 MILK, BREAD, EGGS
2 BREAD, SUGAR
3 BREAD, CEREAL
4 MILK, BREAD, SUGAR
5 MILK, CEREAL
6 BREAD, CEREAL
7 MILK, CEREAL
8 MILK, BREAD, CEREAL, EGGS
9 MILK, BREAD, CEREAL
Transactions
Frequent Itemsets:
Milk, Bread (4)
Bread, Cereal (3)
Milk, Bread, Cereal (2)
…
Rules:
Milk => Bread (66%)
48
Visualization & Data Mining
 Visualizing the data to
facilitate human
discovery
 Presenting the
discovered results in a
visually "nice" way
49
Summarization
 Describe features of the selected
group
 Use natural language and
graphics
 Usually in Combination with
Deviation detection or other
methods
Average length of stay in this study area rose 45.7 percent,
from 4.3 days to 6.2 days, because ...
Data Mining Models and Tasks
Obtained from Prof. Srini’s Lecture notes

Lecture-1-Introduction-to-Data-Mining.pdf

  • 1.
    LECTURE 1: INTRODUCTION TODATA MINING Dr. Dhaval Patel CSE, IIT-Roorkee
  • 2.
    What is datamining?  Data mining is also called knowledge discovery and data mining (KDD)  Data mining is  extraction of useful patterns from data sources, e.g., databases, texts, web, image.  Patterns must be:  valid, novel, potentially useful, understandable
  • 3.
    Data Knowledge Knowledge Patterns Data Mining Knowledge Discoveryin Data: Process Interpretation/ Evaluation
  • 4.
  • 5.
    Data Volume - Big Data -Small Data Variety - Transaction - Temporal - Spatial … Velocity - Data Stream - Static Knowledge Discovery in Data: Challenges 5
  • 6.
    Outline (Part 1) Introduction to Data  Transactional Data  Temporal Data  Spatial & Spatial-Temporal Data  Data Preprocessing  Missing Values  Summarization
  • 7.
  • 8.
    Data Come fromEverywhere 8 Hospital Stock Exchange Weather Station Grocery Markets E-Commerce Social Media But, they have different form
  • 9.
    What is Data? Collection of records and their attributes  An attribute is a characteristic of an object  A collection of attributes describe an object Tid Refund Marital Status Taxable Income Cheat 1 Yes Single 125K No 2 No Married 100K No 3 No Single 70K No 4 Yes Married 120K No 5 No Divorced 95K Yes 6 No Married 60K No 7 Yes Divorced 220K No 8 No Single 85K Yes 9 No Married 75K No 10 No Single 90K Yes 10 Attributes Objects
  • 10.
    Types of Data Record Data  Transactional Data  Temporal Data  Time Series Data  Sequence Data  Spatial & Spatial-Temporal Data  Spatial Data  Spatial-Temporal Data  Graph Data  Transactional Data  UnStructured Data  Twitter Status Message  Review, news article  Semi-Structured Data  Paper Publications Data  XML format
  • 11.
    Record Data TID Items 1Bread, Coke, Milk 2 Beer, Bread 3 Beer, Coke, Diaper, Milk 4 Beer, Bread, Diaper, Milk 5 Coke, Diaper, Milk Market-Basket Dataset • Transaction Data
  • 12.
    Data Matrix  Ifdata objects have the same fixed set of numeric attributes, then the data objects can be thought of as points in a multi- dimensional space, where each dimension represents a distinct attribute  Such data set can be represented by an m by n matrix, where there are m rows, one for each object, and n columns, one for each attribute
  • 13.
    Data Matrix Examplefor Documents  Each document becomes a `term' vector,  each term is a component (attribute) of the vector,  the value of each component is the number of times the corresponding term occurs in the document. season timeout lost wi n game score ball pla y coach team
  • 14.
    Distance Matrix 0 1 2 3 0 12 3 4 5 6 p1 p2 p3 p4 point x y p1 0 2 p2 2 0 p3 3 1 p4 5 1 Distance Matrix p1 p2 p3 p4 p1 0 2.828 3.162 5.099 p2 2.828 0 1.414 3.162 p3 3.162 1.414 0 2 p4 5.099 3.162 2 0
  • 15.
    Temporal Data  SequencesData (Patient Data obtained from Zhang’s KDD 06 Paper)
  • 16.
    Temporal Data  TimeSeries Data Yahoo Finance Website
  • 17.
  • 18.
    Interval Data A EL= {(A, 1, 5),( C, 3, 12), ( B, 4, 9), ( D, 9, 15) } C 1 5 3 12 (A overlaps C ) B 4 9 contains B ) ( D 15 overlaps D ) ( time (Interval Patient Data obtained from Amit’s M.Tech. Thesis Work)
  • 19.
    Spatial & Spatial-TemporalData (Spatial Distribution of Objects of Various Types : Prof. Shashi Shekhar) • Spatial Data
  • 20.
    Spatial & Spatial-TemporalData Average Monthly Temperature of land and ocean  Spatial Data
  • 21.
    Spatial & Spatial-TemporalData  Spatial Data Dengue Disease Dataset (Singapore)
  • 22.
    Spatial & Spatial-TemporalData  Trajectory Data: Set of Harricans http://csc.noaa.gov/hurricanes
  • 23.
    Spatial & Spatial-TemporalData  Trajectory Data: (of 87 users obtained using RFID) Vast 2008 Challenge – RFID Dataset
  • 24.
    User Movement Data Trajectory  Movement trail of a user  Sampling Points: <latitude, longitude, time> P1 on weekends Home Swimming Pool Movie Complex Stadium Thanks to Shreyash and Sahoishnu (M.Tech. Students)
  • 25.
  • 26.
  • 27.
  • 28.
    Data can helpus solve specific problems.
  • 29.
    How should thesepictures be placed into 3 groups?
  • 30.
    How should thesepictures be placed into groups? How many groups should there be?
  • 31.
    Which genes areassociated with a disease? How can expression values be used to predict survival?
  • 32.
    What items shouldAmazon display for me?
  • 33.
    Is it likelythat this stock was traded based on illegal insider information?
  • 34.
    Where are thefaces in this picture?
  • 35.
  • 36.
  • 37.
    What techniques peopleapply on data?  They apply data mining algorithms and discover useful knowledge  So, what are the some of the well-known Data mining Tasks?  Clustering,  Classification,  Frequent Patterns,  Association Rules,  ….
  • 38.
    What people dowith the time series data? Clustering Classification Query by Content Rule Discovery 10  s = 0.5 c = 0.3 Motif Discovery Novelty Detection Visualization Motif Association
  • 39.
    What people dowith the trajectory data? Clustering Motif Discovery Visualization Frequent Travel Patterns Classification Prediction
  • 40.
    Types of Data Transactional Data  Sequence Data  Interval Data  Time Series Data  Spatial Data  Spatio-Temporal Data  Data Set with Multiple Kinds of Data  …. In, Summary Data Mining Methods  Frequent Pattern Discovery  Classification  Clustering  Outlier Detection  Statistical Analysis  … Algorithms
  • 41.
    Activity 1  Findtop 3 recent research activities around the world that are analyzing data. You need to write short summary for each research activities. First three line must follow following format:  Line 1: Problem they are trying to sole along with dataset they are using  Line 2: How they are solving the problem  Line 3: Justify yourself why you rate this work as a top 5 activities  Remaining lines… you can think yourself …. BigN’Smart Research group at IIT-Roorkee is analyzing “YelpReview” Dataset for learning Location-to-activity Tagging. They are applying … . I feel this is an interesting research because …
  • 42.
    Activity 2: WhyData Mining ???  Google  Facebook  Netflix  eHarmony  FICO  FlightCaster  IBM’s Watson Read About Their Story
  • 43.
  • 44.
    Related Field  Statistics: more theory-based  more focused on testing hypotheses  Machine learning  more heuristic  focused on improving performance of a learning agent  also looks at real-time learning and robotics – areas not part of data mining  Data Mining and Knowledge Discovery  integrates theory and heuristics  focus on the entire process of knowledge discovery, including data cleaning, learning, and integration and visualization of results  Distinctions are fuzzy
  • 45.
    45 Classification Learn a methodfor predicting the instance class from pre-labeled (classified) instances Many approaches: Statistics, Decision Trees, Neural Networks, ...
  • 46.
    46 Clustering Find “natural” groupingof instances given un- labeled data
  • 47.
    47 Association Rules &Frequent Itemsets TID Produce 1 MILK, BREAD, EGGS 2 BREAD, SUGAR 3 BREAD, CEREAL 4 MILK, BREAD, SUGAR 5 MILK, CEREAL 6 BREAD, CEREAL 7 MILK, CEREAL 8 MILK, BREAD, CEREAL, EGGS 9 MILK, BREAD, CEREAL Transactions Frequent Itemsets: Milk, Bread (4) Bread, Cereal (3) Milk, Bread, Cereal (2) … Rules: Milk => Bread (66%)
  • 48.
    48 Visualization & DataMining  Visualizing the data to facilitate human discovery  Presenting the discovered results in a visually "nice" way
  • 49.
    49 Summarization  Describe featuresof the selected group  Use natural language and graphics  Usually in Combination with Deviation detection or other methods Average length of stay in this study area rose 45.7 percent, from 4.3 days to 6.2 days, because ...
  • 50.
    Data Mining Modelsand Tasks Obtained from Prof. Srini’s Lecture notes