1. Are We Truly Rational?
John McCallie
4/17/2014
Abstract
This study tests the validity of the assumption that “people are rational” in many economic models.
While rationality and Rational Choice Theory is widely debated in the field of economics, this
study seeks to explore how rational University of San Diego undergraduate students are by having
students complete a survey where they played two games: The Prisoner’s Dilemma and a Pick-
the-Average game. The author hypothesizes that students in the Economics major will be more
likely to make rational choices, as well as those with higher GPA. The data consists of a cross-
sectional, self-reported survey over a two-month span (n=227), and is estimated in four separate
Probit estimations. The results disprove the hypotheses, since neither Econ nor GPA are significant
in any of the models. The equation does give significance to being Male, undeclared, or any major
besides Arts and Econ in the average game, and therefore are more likely to make rational
decisions. This indicates that there is either an issue with the data collection, since there is little
significance shown in the estimation, or that there may not be any uniform, predicable method of
proving how rational an individual is.
2. 1
I. Introduction
Almost every economic theory has the assumption that “people behave rationally,” and
most students and economists take that statement at face value. But how accurate is that
assumption? It’s fairly plain to see how humans appear to make irrational decisions all the time,
sometimes at great personal harm, and yet economists rely on these people behaving rationally
when presented with their models and games. It is in the face of this reality that I seek to
question the assumptions of Rational Choice Theory and the many models that rely on it as their
basis. If people truly are rational, what factors makes them so, and can we predict who will
behave rationally based on certain characteristics they have? If people do not behave rationally,
or there is no way to show how people come to make rational decisions, then are the assumptions
economists make about the people in their models accurate and applicable to the real world?
I aim to test these questions by surveying University of San Diego undergraduate
students and asking them to play two different games. These games, which are rooted in game
theory, were chosen due to their different styles and approaches to rational choice. Their choices
are regressed in four separate Probit estimations in order to see how individuals make rational
decisions, and if there are any factors that significantly affect their ability to do so. My main
assumptions are that those with an economics background and high intelligence should be able to
make more rational choices, due to their academic and personal backgrounds. This assumption
ends up being false, though, since neither variable ends up being significant, as well as most
variables that are included in the models. While there are a few short-comings to the survey
methods used and the external validity of the study, I argue that this research should open the
door to new studies in order to see if basing models in Rational Choice Theory, or rationality in
general, is a flawed practice, and urge Economists to seek better models to explain human
behavior.
II. Literature Review
The subject of “rationality” is a touchy one in the field of Economics, with varying
opinions and stances taken on what it even means to be rational. Sippel (1997) finds in his
research that people do not follow the positivist outlook on how they make decisions. Rather,
while many individuals have motivations and preferences, they are usually in violation of many
neoclassical assumptions on human behavior, and make decisions that contradict their revealed
3. 2
preference axioms. Given this, Sippel (1997) claims that “we economists should perhaps be a
little more modest in our ‘imperialist ambitions’ of explaining non-market behavior by economic
principles.” Simply put, while Rational Choice Theory does allow for economists to create
models to explain how people should and do behave in markets, it is much harder to see those
results in actuality. As stated, people will behave in ways that theory cannot explain, which
opens up a whole new avenue for why people may behave “irrationally,” or differently than
would be expected.
This idea of irrational behavior is one that is studied intensely by game theorists, who
rely on rational reasoning in order to explain decisions made by players, especially when
concerning the infamous Prisoner’s Dilemma. Many economists try to explain why people would
choose to cooperate when playing this game, since defection (in an appropriately set up game) is
the preferred strategy (e.g. Andreoni & Miller, 1993; White, 2009; Kanazawa & Fontaine, 2013).
In their study, Andreoni & Miller (1993) find that altruism plays a huge part in whether or not a
player chooses to cooperate. By treating some of their subjects to the assumption that they may
be playing altruistic players, the authors find a significant move towards cooperation in both
finite and single-shot games. Further, they find that some players actually were altruists, and
therefore leaned towards cooperation even in single-shot games. Andreoni & Miller (1993)
attribute this pattern to the idea of a “warm-glow,” in which mutual cooperation adds utility, and
therefore can be seen as a preferred choice, hence why single-shot players would seek
cooperation. So, it would not be unfounded to think people choose to cooperate due to extra
utility they hope to gain from the other player choosing to cooperate as well. This would mean
their choice would not be considered irrational.
White (2009) cites previous scholars’ emphasis on Kantian ethics (and morality in
general) as a reason for why people would behave with cooperation rather than deviation. He
claims that this stance is false, since deviation does not strictly fail Kantian requirements of
ethics, and therefore is not an adequate explanation as to why cooperation would be a rational
decision. Rather, White (2009) suggests that economists use other moral systems to achieve the
cooperation result, which indirectly acknowledges that morality can be an acceptable reason for
why cooperation should be desired. Opp (2013) supports this conclusion, by asserting that the
autonomy thesis, in which many economists follow when discussing rational choice, is not the
correct way of understanding human behavior. He claims this path ignores the impact internal
4. 3
morality, or norms, has on utility. Instead, if scholars allow internal morality and norms to be
deciding factors in utility (the incentives thesis), it gives credence to the idea that cooperating
may actually be the more rational choice (i.e. the guilt a person feels for betraying their
partner/society outweighs the less time they would spend in jail by defecting).
On the other hand, Kanazawa & Fontaine (2013) present a challenge to previous findings,
in which they try to find why individuals might lean towards cooperating. The authors find that
as intelligence increased, so does the probability that the individual will defect. They also notice
that less intelligent individuals are more likely to cooperate when presented with a photo of their
“opponent,” although this is not statistically significant. Their results contradict previous
findings, and suggest that morality may only be important in those who either do not understand
the game, or are considered “less intelligent,” which in itself is a controversial stance.
If we define intelligence more broadly, as Cecchi & Bulte (2013) do in their study of
Ethiopian farmers and brokers, we can see how Kanazawa & Fontaine’s (2013) stance on
intelligence is not as controversial. They find that those who participated in actual markets
gained experience to form rational choices. After participation in their make-shift auction, both
farmers and brokers reduced the amount of Generalized Axioms of Revealed Preferences
(GARP) violations, signifying an increase in understanding of making rational choices. The
intuition behind this is fairly straightforward. The more experience an individual has with
something, the more efficient they become at it. Therefore, one would expect an individual who
is either familiar with a topic or has more “life experience” will be more rational and make
correct choices.
This raises a question of what is the actual rational choice? Marinescu (2012) takes a
fairly pessimistic stance when it comes to rational and irrational behavior in general. He argues
that in the current economic and political system, it is almost impossible to behave rationally in
any sense. He concludes that participants are influenced by “animal spirits, moral hazard or
irrational exuberance” and cannot make rational decision when introduced to corruption,
inefficiency, and informal sectors (Marinescu, 2012). While this viewpoint is directed to the
economy as a whole, it can be applied to the Prisoner’s Dilemma in that it is impossible to
determine what the true rational choice is. This viewpoint should be considered too extreme,
since it discredits the ability of the individual and renders any economic modeling invalid. His
critique does hold some value, though, in that it highlights the need for the field of economics to
5. 4
take a step back from purely neoclassical theory to explain human behavior, and give some
consideration to other, non-economic incentives individuals might have.
I seek to apply these concepts in order to determine if they apply to the undergraduate
students at the University of San Diego. In other words, my research will serve as a case study to
see if the concept of rationality applies to those who are pursuing higher education. The external
validity of this study is fairly limited, mainly due to the resources and time available, but it does
hold value in seeing if there are certain factors, such as intelligence, experience, and personal
pursuits in academia, which bias individuals towards a certain way of rationalizing their choices.
My study is different than previous in that it uses another game that, as far as I can tell during my
research, has not been tested in an academic setting. I use this game since it has a clearer rational
answer than in the Prisoner’s Dilemma, due to it dealing purely with numbers and averages, and
nothing to do with moral influences. This will hopefully clarify how people make rational
choices, once the concept of morality is removed.
III. Empirical Framework
i. Empirical Methodology
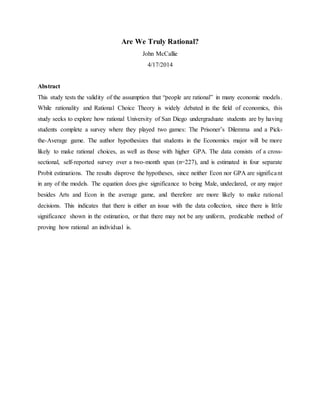
[Insert Figure 1 here]
In order to test rational choice, I utilize the outcomes of two games as my dependent
variables. In the Prisoner’s Dilemma, students are asked to pick either “confess” or “stay quiet”,
with confess being the Nash Equilibrium. Since the ability of rational choice theory to be
adequately supported by this game is disagreed upon, I am comparing this game’s results to a
second game.
This second game, dubbed the Pick-the-Average game, directs the individual to pick an
integer (0, 1, 2, 3…) between 0 and 100, and whoever is closest to a third of the average wins the
game. Because the highest possible average value is 33 (if everyone picks 100, the average is
33), rational individuals should pick 11 (33/3=11). In response to this, every person should pick
3-4, and this logic continues until every person is picking 0. This variable is constructed as a
dummy variable which is equal to 1 if an individual picks 0-10. Values in this range indicate that
the person understood the nature of the game, and adjusted his/her choice to represent that
understanding. This is the rationale behind why this game should avoid any kind of moral
quandary that surrounds the Prisoner’s Dilemma.
6. 5
For both of the games, my main hypothesis is that an economics major will have a higher
probability of choosing confess and choosing a value of 1-10. This is mainly due to his/her
knowledge of game theory and understanding of payoffs and equilibria.1 My second hypothesis
is that those with a higher intelligence, as measured by cumulative college GPA, will have an
increased probability of making a rational decision as well. Due to there not being a timely and
efficient method of testing student’s intelligence available, I use this variable as a close
approximation of intelligence. Although there is some understandable hesitation with using GPA
as a placeholder for intelligence, it serves as a reasonable proxy for the purposes of this research.
I will use a Probit estimation, since I’m dealing with the probabilities of choosing a
certain answer. The complete model will look as such:
Pr(Y=1|X)= Φ(β0 + β1XECON+ β2XGPA + β3XECON*GPA + β4XAGE + β5XMALE + β6XPARENT
+ β7XEXPERIENCE + β8XSAVING + β9XECONUNIT + β10XMATHUNIT + β11XPLAY + β12XGAME
+ β13XBUSINESS + β14XSCIENCE + β15XHUMANSCIENCES + β16XUNDECIDED)
The first two variables, Econ and GPA, are what will be used to test the hypotheses. The
variable for Econ will be the obvious placeholder for whether or not the individual is an
economics major. If the variable ends up being positive in a significant way, then that will show
economics majors have an increased probability of choosing the rational decision, and support
the first hypothesis. GPA is self-reported and, as stated earlier, will be a placeholder for
intelligence. Here, the interpretation is that the higher the GPA, the higher the intelligence of the
person. Therefore, a positive significant coefficient with this variable would prove the second
hypothesis that increased GPA is linked to increased probability of making the rational choice.
The interaction term, Econ*GPA, is to see if there is any additional effect from being both Econ
and having high intelligence. I expect this relationship to be positive as well.
[Insert Table 1 here]
Table 1 lists the descriptions for all variables included in the model. After he/she played the
game, the participant was asked to fill out a series of demographic questions about their major,
1 Because there is a low percentage of undergraduate students in the field of economics at the University of San
Diego, there is danger of havingsamplingbias by either havingtoo much representation in the estimation,or too
littlerepresentation of the diversity of students that make up the major.If either of these is the case, more
research is recommended to correct for this effect, and assess thevalidity of the results given here.
7. 6
GPA, age, sex, parental education (in total years), work experience (in months), average percent
of income saved, units taken in both Economics and Mathematics, whether they have played the
games presented, and if they have knowledge of game theory. The control variables Econunit,
Play, and Game are all expected to have positive relationships in both games, with Mathunit only
expected significant in the Average game model, due to the game being math based. I expect
Parent to be positive as well, following along the same assumption of the student being more
intelligent (i.e. parents who have more education would make more rational choices, and that
effect would transfer to their children). Experience and Saving is also assumed to be positive,
since having more work experience and better saving habits should mean that the students are
making more conventionally-accepted rational choices. The major variables Business, Science,
Huamnsciences, and Undecided are all compared to a fifth variable, Arts, and do not have any
expected significant direction. Age and Male relationships are unclear, but they are included
regardless to control for their effects, if any.
[Insert Table 2 here]
As shown in Table 2, there is a possibility of multicollinearity with the variables Play and
Game, but only within the model concerning Prisoner’s Dilemma (due to it being a game theory
topic). This is found to not be the case, as the model is not significantly changed when the Play
variable is taken out, and therefore was left in. This is also a worry with Econ and Econunit, for
obvious reasons, but due to the need to test for the effect of having econ courses for those outside
of the major, it was left in to test for its effects as well.
ii. Data and Descriptive Statistics
The data consists of a cross-sectional, self-report survey of 227 USD undergraduates
from February 2014 to April 2014. The data is collected as such: The students are approached at
the start or end of their class, either by myself or a proctor, and asked to complete the survey. All
the games are single-shot, or played once, with the only direction of filling out every question.
The survey first asks individuals to play the average game. The directions ask the participant to
pick an integer between 0-100, and that whoever is closest to a third of the average would win.
This is followed by a short example as to how the winner is picked, by explaining how after the
average is calculated, it will be divided by three, and whoever is closest to that number would
win.
8. 7
Next, participants are instructed that they are prisoner 1, and is presented with Figure 1.
The directions ask him/her to pick stay quiet or confess, and their sentencing is dependent on
both their choice and the other prisoner. There is no further explanation given by the proctors
about the games, in order to prevent giving away the correct answer. The demographic answers
from each student is used as the independent variables for the model, and each variable is used as
it was collected, with no alterations (such as logs or growth), except for D1, which is changed to
a dummy variable of 1 if 0-10.
[Insert Table 3 here]
Table 3 provides the summary stats for each variable, with D1 being described as it is
before being converted to a dummy variable. Here, the mean average game choice is about
23.96, but responses do go as high as 100. A total of 38 respondents (16.74%) pick a value over
33, which is impossible to achieve in this game. Only 6 respondents (2.64%) pick 0 as his/her
answer, which is the most rational choice given the rules of the game. Additionally, only 63
individuals (24.75%) chose 0-10, the rational choice for the Average game. For the Prisoner’s
game, 47.58% picked confess, which is the rational choice for this game, meaning a little over
roughly half of the college’s population will pick the strictly irrational choice of confess. It
should be of note that because no prize or incentive is offered in this survey, there is a possibility
that students do not accurately play the game, and this can skew the results.
IV. Results
[Insert Table 4 here]
Table 4 shows the outputs for the regression equation concerning the Average game,
where the probability of picking 0-10 (which holds the value =1) is regressed against the possible
influences. In the table are the results for two equations, with the difference being that the second
specification includes all the other dummy major variables.
Equations 3 and 4 follow the same formula as the previous equations, except they display
the results for the Prisoner’s Dilemma (the dependent being 1 if “confess” is picked, 0 if “stay
quiet” is picked) and changes Play to its respective game (Play2 in the Table 4), which asks if
they have played the Prisoner’s Dilemma before. The overall fit of the model is low, given the
pseudo-R2. However, the pseudo-R2 increases for each game, indicating that the inclusion of the
9. 8
other major variables improves the fit of the empirical estimation. But, as with Probit models, R2
are not very reliable due to they not having the same inference as with an OLS regression.
In the first two equations, both Econ and GPA are shown to have positive coefficients,
indicating that being an economics major or having a higher GPA would increase your
probability of picking low values, which follows along with the hypothesis. But, the values are
insignificant, meaning that these equations cannot reliably predict that this value is different than
zero, and therefore the hypotheses are not upheld for this game. The same can be said for the
latter equations, which shows each variable having a negative impact instead of positive. Still,
the values are again insignificant, so I cannot make any assumptions given the current
specification. Therefore, for both the Pick-the-Average game and the Prisoner’s Dilemma, this
data cannot prove with confidence that being an economics major or having a higher GPA is
correlated with increased probability of picking the correct answer.
[Insert Table 5 here]
On the other hand, the results for the other control variables are intriguing. Most
surprisingly is how the Male variable ended up being extremely significant at the 1% level for
the Average game for the first equation, and significant at the 5% level in the expanded second
equation, as shown in Table 5. This is interesting, since this is saying that being male will
increase the probability of picking 0-10 by 16.77% or 13.69% at the mean, respectively,
according to the marginal probability outputs in columns 1 & 2 of Table 4. I cannot say for sure
why this is the case. While there could be a possibility that because males tend to fall into majors
like Science and Business, which can be number heavy, the data used for analysis doesn’t show
any significant correlation issues. This leads to me believing that there is either an unexplained
effect caused by the data collection or there is something about this game that favors males. If
there was bias, I would expect this relationship to exist with the Prisoner’s game as well, which it
does not. Therefore, if it is truly not due to data collection, it would be interesting to further
study this effect.
As for the rest of the regression, the results that are significant have mixed implications.
When the other major categories are added in equation 2, Sciences and Human Sciences are
significant at the 10% level, with Business and Undecided being significant at 5%. They all have
a positive effect, which means that choosing any of these majors will lead to them being more
likely to pick the rational answer in this game. Even more interesting is not having a major
10. 9
(being undecided) is also more rational. Granted, these are also broad categories, and a more
complex regression specification indicating each individual major might explain these results
more clearly. These results should be examined in the future if enough data points were
accessible, and with a grain of salt.
The Prisoner’s Dilemma equations has a much different result for the control variables.
Here, the only variable that holds any significance is Play, at the 1% level. Table 5 shows that if
a person has played this game, the probability of picking confess increases 23.46%, and
increases slightly to 23.82% when the other majors are factored in. Because knowing how to
play the game should lead to picking confess, this result isn’t too controversial. Despite that, the
Game variable, which measures if a person knows what game theory is, is extremely
insignificant. This leads me to believe that just because people know what game theory is,
doesn’t mean they actually know how it works, or that they have played the games themselves.
Finally, counter to the average game, being a Business, Science, Human Science, or
Undecided major has no significant effect. Why this ends up being insignificant compared to the
average game is unclear. It could be that, unlike the average game, there is more utility gained
from staying quiet or cooperation than from the reduced terms from confessing or defecting.
How this is valued is up for debate, though, and therefore should constitute further research.
V. Conclusions
The main purpose of this research was to see if people truly behaved rationally, and what
factors significantly affect their ability to make those rational choices if that is the case.
Historically there has been disagreement on how accurately we can measure rational ability, and
if it is even possible to act rationally given the state of markets and society we live in; as such,
there has never been a clear answer. Therefore, I surveyed 227 college students to see if previous
methods, as well as a couple new ones, could help explain what constitutes rationality in
individuals. I hypothesized that of all the factors, the two main influences for making the rational
choice in both the Pick-the-Average game and Prisoner’s Dilemma is being an economics major
and having high intelligence, explained through GPA. Since economics majors study Rational
Choice Theory and how to make rational choices in markets, this hypothesis seems intuitive, and
therefore the expected relationship is positive. Similar logic is used for GPA being significant, as
11. 10
those who are more intelligent should be able to understand and master the games, and therefore
this relationship should be positive as well.
After running a Probit regression for each game against the two hypothesized variables
and a number of control variables, both hypotheses fail to be supported. None of the models were
able to show a significant relationship between being an economics major or having a higher
GPA and making the correct choice. The only variables that end up being significant were Male,
Business, Sciences, Humansciences, and Undecided in the average game. This suggests that
being any majors other than Arts and Econ, even Undecided, will lead a student to make the
more rational choice. This is only true for the average game, since only Play is significant in the
Prisoner’s game. This result isn’t surprising, since an individual who has played this game or
were told the answer before should logically make that choice.
If these results are accurate, the implications do not bode well for economics majors; this
is saying that those who study this discipline do not gain any significant advantage, even though
rationality is a focus of many economic concepts. But, more importantly, this shows that there is
no way to safely assume that people are actually rational, since only roughly a quarter of
respondents actually make a rational choice in the Average game, and about half make the
correct choice in the Prisoner’s game. Even for those who do, there are no common
characteristics that were both significant and went in the expected direction, meaning that even
when people are rational, we cannot predict who those people will be with these demographic
indicators.
Even though these results are surprising (or not, for some), there are some limitations to
what this survey is able to accomplish. Due to the short time frame I faced for data collection and
research, a limited amount of respondents were able to be reached. Also, a number of the surveys
turned in were incomplete, and therefore could not be used in the models. Another shortcoming
with the survey methods was the inability to collect a truly random sample. Since I had to rely on
both convenience and snowball techniques in order to get the number of respondents needed for
a Probit estimation, there is a possibility of bias in the data. Therefore, to put too much stake in
these results would be irrational in itself. Regardless, I do believe this study does serve as a good
stepping off point for future researchers, who can address these shortcomings and expand upon
the findings. Also, this experiment can be a good framework in order to collect information on
more than just college students and see how these concepts apply to those who seek different
12. 11
paths and careers. Even though my specific study may not accomplish what I want from this kind
of research, it is my hope that this is taken and expanded upon, in order to more clearly explain
the enigma that is rational choice.
13. 12
References
Andreoni, J. A., & Miller, J. H. (1993). Rational cooperation in the finitely repeated prisoner's
dilemma: experimental evidence. Economic Journal, 103(418), 570-585.
Cecchi, F., & Bulte, E. (2013). Does market experience promote rational choice? Experimental
evidence from rural Ethiopia. Economic Development and Cultural Change, 61(2), 407-
429.
Kanazawa, S., & Fontaine, L. (2013). Intelligent people defect more in a one-shot prisoner's
dilemma game. Journal of Neuroscience, Psychology, And Economics, 6(3), 201-213.
Marinescu, C. (2012). The limit between the rational and irrational behaviour in the economic
science. Theoretical and Applied Economics, 19(6), 143-156.
Opp, K. (2013). Norms and rationality: is moral behavior a form of rational action?. Theory And
Decision, 74(3), 383-409. doi:http://0-dx.doi.org.sally.sandiego.edu/10.1007/s11238-012-
9315-6
Sippel, R. (1997). An experiment on the pure theory of consumer's behaviour. Economic
Journal, 107(444), 1431-1444.
White, M. D. (2009). Kantian Ethics and the Prisoners' Dilemma. Eastern Economic
Journal, 35(2), 137-143.
15. 14
Table 1: Variable Descriptions
Variable Description
D1 1 if values 0-10 picked, 0 otherwise
D2 1 if “confess” picked, 0 if “stay quiet” picked
Econ 1 if an Econ major, 0 otherwise
GPA Variable representing cumulative college GPA of individual
Econ*GPA Interaction term between being an Econ major and GPA
Age Age of person completing survey
Male 1 if male, 0 if female
Parent Measures total years of parental education (If both parents completed
high school, value is 24 [12+12])
Experience Measures total # of months in work force
Saving Measures percentage of respondent income that is saved, on average
Econunit # of Economic units taken in college
Mathunit # of Mathematic units taken in college
Play 1 if respondent has played respective game, 0 otherwise
Game 1 if respondent has knowledge of Game Theory, 0 otherwise
Arts 1 if respondent is an Arts major, 0 otherwise
Business 1 if respondent is a Business major (excluding Econ), 0 otherwise
Sciences 1 if respondent is a Science major, 0 otherwise
Humansciences 1 if respondent is a Human Sciences major, 0 otherwise
Undecided 1 if respondent has no major/undeclared, 0 otherwise