1. The Effects of Iron Deficiency Anemia on Mitochondrial Capacity
Purpose: The purpose of this study was to compare the
mitochondrial capacity of those with iron deficiency to
non-anemic controls.
Methods: Participants were divided into two groups: an
anemic group (n = 6) and a control group (n = 14). Blood
samples were taken in order to identify anemia.
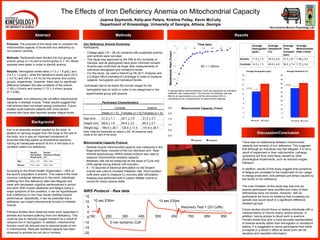
Results: Hemoglobin levels were (11.0 + 1.5 g/dL) and
(14.3 + 1.3 g/dL), while the hematocrit levels were (34.5
+ 4.0 %) and (40.6 + 4.0 %) for the anemic and control
groups, respectively. However, there was no significant
difference between the rate constants of the anemic
(1.69 + 0.4/min) and control (1.72 + 0.4/min) groups
(P = 0.86).
Conclusion: Iron deficiency did not affect mitochondrial
capacity in skeletal muscle. These results suggest that
mild anemia does not impair energy production. Future
studies could examine patients with more severe
anemia who have also reported greater fatigue levels.
Iron Deficiency Anemia Screening
Participants:
- College aged (19 – 28 yrs) students with suspected anemia
and controls were recruited.
- This study was approved by the IRB at the University of
Georgia, and all participants have given informed consent.
- Anemia was confirmed via finger stick measurements of
individual hemoglobin and hematocrit levels.
- For this study, we used a HemoCue Hb 201+ Analyzer and
a CritSpin Micro-Hematocrit Centrifuge in order to measure
subjects’ hemoglobin and hematocrit levels.
Individuals had to be below the normal ranges for the
hemoglobin test (or both) in order to be categorized in the
experimental group with anemia.
Abstract
Background
Methods
Joanna Szymonik, Kelly-ann Peters, Kristine Polley, Kevin McCully
Department of Kinesiology, University of Georgia, Athens, Georgia
Results
Discussion/Conclusion
NIRS Protocol - Raw data
Non-Invasive Muscle Physiology Lab
Iron is an essential mineral needed by the body. In
addition to carrying oxygen from the lungs to the rest of
the body, iron is also an important component of
enzymes that help speed up biochemical reactions.
Having an inadequate amount of iron in the body is a
condition called iron deficiency.
According to the World Health Organization, ~30% of
the world's population is anemic. This makes it the most
common nutritional deficiency in the world. Individuals
suffering from this deficiency often feel fatigued and
weak with decreased cognitive performances in school
and work.With muscle weakness and fatigue being a
major symptom of this condition, it can be hypothesized
that a deficiency in iron may impact skeletal muscle
performance. Specifically, it can be predicted that a
deficiency can impair mitochondrial function in skeletal
muscle.
Previous studies have observed lower work capacities in
animals and humans suffering from iron deficiency. This
could be due to reduced oxygen transport as a result of
reduced iron in hemoglobin. In addition, mitochondrial
function could be reduced due to reduced levels of iron
in mitochondria. Reduced oxidative capacity has been
observed in animals but not yet in humans.
Normal
Hemoglobin
Range (g/dL)
Normal
Hematocrit Range
(%)
Men 13.5 - 17.5 38.8 - 50.0
Women 12.0 - 15.5 34.9 - 44.5
Mitochondrial Capacity Protocol
- Skeletal muscle mitochondrial capacity was measured in the
finger/wrist flexor muscles of the non-dominant arm. Near-
infrared spectroscopy (NIRS) based protocol was used to
measure mitochondrial oxidative capacity.
- Metabolic rate will be measured as the slope of O2Hb and
HHB signals during arterial cuff occlusion.
- 5 – 10 seconds of electrical stimulation on the forearm
muscle was used to increase metabolic rate. Short duration
cuffs were used to measure O2 recovery after stimulation.
- Analysis was performed with a custom Matlab routine to
correct for blood volume shifts.
There was no relationship between mitochondrial
capacity and severity of iron deficiency. This suggests
that although an individual may feel fatigued, it is not a
result of impairment in their mitochondria. Lethargic
symptoms are thus more likely caused by other
physiological impairments, such as reduced oxygen
transport.
In addition, results of this study suggest that symptoms
of fatigue are unrelated to the impairment of iron usage
in energy production, and perhaps just simply caused by
low levels of iron deficiency.
The main limitation of this study was that only six
anemic participants were enrolled and many of their
deficiencies were not severe. However, with six
participants we found no evidence that increasing our
sample size would result in a significant difference
between groups.
Future studies should focus on testing individuals with a
medical history of chronic and/or severe anemia. In
addition, having access to blood work to examine
Ferratin levels may give a more accurate representation
of anemia severity rather than hemoglobin or hematocrit
testing. It is suggested to recruit participants from either
a hospital or a doctor’s office as blood work can be
sensitive and classified information.-20
-15
-10
-5
0
5
10
15
150 250 350 450 550 650 750 850 950
10 sec EStim
5 min Ischemic Cuff
10 sec EStim
Recovery Test 1 (20 Cuffs)
Participant Characteristics
Controls Anemic
Males (n = 5) Females (n = 9) Females (n = 6)
Age (yrs) 21.2 + 1.1 20.1 + 1.5 21.3 + 3.7
Height (cm) 68.6 + 1.8 64.8 + 3.2 65.3 + 2.7
Weight (kg) 166.4 + 28.7 125.6 + 17.5 141.8 + 29.7
Note: Data are presented as means + SD. All measures were
made at the start of the study.
Average
Hemoglobin
(g/dL)
Average
Hematocrit
(%)
Average
Time
Constant
(sec)
Average
Mitochondrial
Rate (1/min)
Anemic 11.0 + 1.5 34.5 + 4.0 37.3 + 8.1 1.69 + 0.4
Controls 14.3 + 1.3 40.6 + 4.0 36.5 + 7.4 1.72 + 0.4
-3
-2.5
-2
-1.5
-1
-0.5
0
0 50 100 150 200 250 300
MetabobolicRate(%/sec)
Time (sec)
RC = 1.39/min
A representative mitochondrial test. Each dot represents an individual
metabolic rate measurement. The recovery of metabolic rate was
fitted to an exponential curve, and the rate constant (RC) is
considered to be a measurement of mitochondrial capacity.
0.0
0.5
1.0
1.5
2.0
2.5 Mitochondrial Capacity (1/min)
Control Anemic
0
2
4
6
8
10
12
14
16
18
Average Hemoglobin (g/dL)
Anemic Control
0
5
10
15
20
25
30
35
40
45
50
Average Hematocrit (%)
Anemic Control
Normal
Normal