About SQC
Ⅰ Whatis SQC?
Ⅱ Factor analysis
(1) Treatment of language data
(2) Treatment of numeric character data
Ⅲ Correct grasp of the situation
(1)Treatment of numeric character data
(2)Treatment of language data
Ⅳ Others
05.6.29
Quality Division
SQC Promotion Group
Kanai Yukio
2.
G-SDC Principles ofAction
To ensure the achievement of the execution and
mid-term plans, we commit thoroughly to
take action based on STQM SANDEN WAY
But, What is “SQC”? What do we concretely do?しかし、SQCとは、何か?具体的に何をすることか?
Ⅰ About SQC
3.
S Q C
StatisticalQuality Control
Scientific Quality Control
Confirmation of word
言葉の確認
SW-7
We solve the problem in scientific methods.
科学的に 問題解決する
Standard
SANDEN
Concretely
具体的
4.
SQC
(Technique for problemsolving)
【 SQC Technique 】 = 【Tools】
・Cause and effect diagram
・Distribution diagram
・Histogram
・Regression analysis
・Experimental design
・Multivariate analysis
・FMEA
・QFD
etc.
Working
by using the
SQC technique
=
Scientific working
〈SQC〉 and 〈SQC Technique〉
Driver
Pincers
Drill
=
問題解決のための手法
特性要因図
系統図
ヒストグラム
回帰分析
実験計画法
多変量解析
SQC手法を使って
仕事をする
科学的な仕事
SQC手法
道具
5.
Idea of qualitycontrol and tools
・Quality the first
・Priority aim
・Fact control
・Process control
・Source control
・Recurrence prevention
・Prevention
Sample of tool(Pareto diagram)
品質管理の考え方 と 道具
品質第一
重点指向
ファクトコントロール
プロセスコントロール
源流管理
再発防止
未然防止
0
20
40
60
80
100
120
Numberofdefectives
0%
20%
40%
60%
80%
100%
Accumulationratio
Gloss
disappearin
g
Foreign
body
Bubble
Abrasio
n
Swelling
Dirt
Others
道具のサンプル(パレート図)
6.
QC story tosolve problem
1・2 [Select Topic and Selection reason]
①To dig up problems and subjects considering difficult problems amongst members and also policy and subjects at workplace and to
focus on those evaluating them from viewpoints of necessity and to decide topic and subject.
②To decide QC story so that topic and subject can be solved effectively and efficiently.
③To plan activities’ schedule like overall schedule and assignment of roles so that activities can sure be performed.
3 [To understand & analyze situation and to set targets]
①To survey present bad situation of subject from several angles. To focus on badness and to find out serious problems affecting overall
badness.
②To decide to what degree badness is to be improved.(to set targets)
4 [Analyze causes]
To dig up causes which seem to be sauces of badness and to extract important causes out of them. To verify them with fact and data and
to find out real cause.
[Consider countermeasures]
To consider several methods to get rid of real sauce(countermeasures) and to evaluate them from viewpoints of effect and possibility of
realization. To select methods.
5 [Implementation of countermeasures]
To plan and implement countermeasures.
6 [Check results]
①To check results with facts and data if what results are obtained against targets originally aimed and if what effects other than direct
effects originally aimed are also obtained.(Tangible effects)
②To evaluate yourself and confirm how you grow up through activities.(Intangible effects)
7 [Standardization]
To investigate and implement methods how to maintain and manage effects in order not to go back- ward and also to confirm if effects
are maintained or not.
8 [Problems left and Future Plan]
To reflect procedures of activities regarding QC Stories to achieve subject as well as to solve problem so that level of future activities can
be raised. To plan future activities clarifying good and bad points and also problems and subjects left.
もっとも重要なステップは何処か?
8.
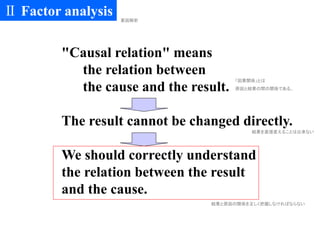
"Causal relation" means
therelation between
the cause and the result.
The result cannot be changed directly.
We should correctly understand
the relation between the result
and the cause.
「因果関係」とは
原因と結果の間の関係である。
結果を直接変えることは出来ない
結果と原因の関係を正しく把握しなければならない
Ⅱ Factor analysis 要因解析
9.
環境 設備大雨
雪
年令
市街地
山中
天候
若い
年配
出身地
群馬
Environment Method
MaterialPerson
High temperature(Summer)
Low temperature(Winter)
age
Driving
Rotational speed
Speed
Temperature
Young
Old
Skill
New face
Leader
Tightening power
Torque
Number of screw
Strength
Hardening
Engine oil
leakage
Cause and effect diagram
Result(Characteristic)
Cause(Factor)
エンジン油洩れ
環境 方法
材料 人
結果(特性)
原因(要因)
Ⅱー(1) Causal relation grasp by language data
The approval of the relation between the cause and the result is important.
10.
Checkpoint
1. Does theresult change if the cause is changed?
[ OK or NG ]
2.Was the cause different when the result was different?
[ OK or NG ]
3.Can I control by myself?
[ OK or NG ]
Result(Characteristic)
Cause(Factor)
結果(特性)
原因(要因)
Three checkpoints 3つのチェックポイント
11.
Checkpoint ①
Y
X
・・ ・・・・・
Scatter chart
No causal
relation
The execution condition
is not suitable.
X
Y
・ ・ ・
Cause change
Sameresult
Age or weather, etc.Oilleakagenochange
05.5.21
QHO
When the result doesn't change
even if the cause is changed
⇒Not a true cause.
散布図
相関なし
実行条件が×
結
果
同
じ
油
洩
れ
変
化
な
し
原因変化
年齢・天候等
原因を変えても結果が変わらない場合
真の原因ではない
12.
No causal
relation
Y
X
・・
・
・
・
・
・
Scatter chartThe sufficient condition
is not suitable.
X
Y
・
・
・
Same cause
ResultchangeWhen good results and bad results exist.
Number of screw
Oilleakandnot
Checkpoint ② 05.5.21
QHO
⇒Not a true cause.
散布図
相関なし
結
果
変
化
油
洩
れ
有
無
十分条件が×
原因同じ
ネジ本数
結果に良いモノと悪いモノがある場合
真の原因ではない
13.
Causal
relation
Y
X
・・
Scatter chart
Correct graspof the situation
X
Y
・
・
・
Engine rotational speed
05.5.21
QHO
When we cannot control the cause.
⇒Worthless cause
Resultchange
Oilleakandnot
Cause change
The execution condition
is not suitable.
散布図
相関あり
結
果
変
化
油
洩
れ
有
無
原因変化
エンジン回転数
原因を自分たちで制御できない場合
原因としての価値がない
Checkpoint ③
14.
Has causal relationbeen approved to
your cause and effect diagram?
Hereafter, you will check it by yourself
by three checkpoints.
First of all, the example is shown.
みんなが持ってきた特性要因図は因果関係が成立しているか?
これから各自、3つのチェックポイントでチェックする。
その前に、例を示す。
15.
Checkpoint
1. Does theresult change if the cause is changed? ⇒ ○ ×
2.Was the cause different when the result was different? ⇒ ○ ×
3.Can I control by myself? ⇒ ○ ×
環境 設備大雨
雪
年令
市街地
山中
天候
若い
年配
出身地
群馬
Environment Method
Material Human
High
Low
age
Humidity
Rain
Dry
Engine
rotational
speed
Young
Old
Skill
New face
Leader
Tightening power
Torque
Number of screw
Strength
Hardening
Engine oil
leakage
Cause and effect diagram 特性要因図
環境 方法
材料 人
エンジン油洩れ
トルク
ネジ本数
チェックポイント
原因を変化させたら、結果が変わるか?
結果が違うとき、原因は違っていたか?
自分たちで制御できるか?
締め付けトルクについて、3つのチェックをしてみる。
チェックポイントが成立していたら要因(原因)に○、成立していなければ×を付ける。
Do three checks to the tightening torques.
Put ○ to the factor (cause) when
the checkpoint has been approved.
Put × when it is not.
16.
Checkpoint
1. Does theresult change if the cause is changed? ⇒ ○ ×
2.Was the cause different when the result was different? ⇒ ○ ×
3.Can I control by myself? ⇒ ○ ×
環境 設備大雨
雪
年令
市街地
山中
天候
若い
年配
出身地
群馬
Environment Method
Material Human
High
Low
age
Humidity
Rain
Dry
Engine
rotational
speed
Young
Old
Skill
New face
Leader
Tightening power
Torque
Number of screw
Strength
Hardening
Engine oil
leakage
Cause and effect diagram 特性要因図
環境 方法
材料 人
エンジン油洩れ
トルク
ネジ本数
チェックポイント
原因を変化させたら、結果が変わるか?
結果が違うとき、原因は違っていたか?
自分たちで制御できるか?
Confirm checkpoint 1 first.
Does the engine oil leakage change if the torque is changed?
Put ○ if change. Put × if not change.
What do you think?
最初はチェックポイントの1である。トルクを変化させたら、エンジン油漏れ
は変化しますか?変化すれば○。変化しなければ×です。どう思います
か?
チェックポイント1の結果
Because I think that it change, I put ○.
○←Result of checkpoint 1
変化すると思うので、○を付けます。
17.
Checkpoint
1. Does theresult change if the cause is changed? ⇒ ○ ×
2.Was the cause different when the result was different? ⇒ ○ ×
3.Can I control by myself? ⇒ ○ ×
環境 設備大雨
雪
年令
市街地
山中
天候
若い
年配
出身地
群馬
Environment Method
Material Human
High
Low
age
Humidity
Rain
Dry
Engine
rotational
speed
Young
Old
Skill
New face
Leader
Tightening power
Torque
Number of screw
Strength
Hardening
Engine oil
leakage
Cause and effect diagram 特性要因図
環境 方法
材料 人
エンジン油洩れ
トルク
ネジ本数
チェックポイント
原因を変化させたら、結果が変わるか?
結果が違うとき、原因は違っていたか?
自分たちで制御できるか?
Next, confirm checkpoint 2.
Was there a difference of the torque of whether the oil leakage was or
did not exist?
Put ○ when there was a difference. Put × if there was no difference.
What do you think?
○
次はチェックポイントの2である。油漏れがあったときと無いときで、トルクに違い
があったか?違いがあったら○。違いが無ければ×です。どう思いますか?
チェックポイント2の結果
Because I think there was a difference, I put ○.
○←Result of checkpoint 2
違いがあったと思うので、○を付けます。
18.
Checkpoint
1. Does theresult change if the cause is changed? ⇒ ○ ×
2.Was the cause different when the result was different? ⇒ ○ ×
3.Can I control by myself? ⇒ ○ ×
環境 設備大雨
雪
年令
市街地
山中
天候
若い
年配
出身地
群馬
Environment Method
Material Human
High
Low
age
Humidity
Rain
Dry
Engine
rotationa
l speed
Young
Old
Skill
New face
Leader
Tightening power
Torque
Number of screw
Strength
Hardening
Engine oil
leakage
Cause and effect diagram 特性要因図
環境 方法
材料 人
エンジン油洩れ
トルク
ネジ本数
チェックポイント
原因を変化させたら、結果が変わるか?
結果が違うとき、原因は違っていたか?
自分たちで制御できるか?
Next, confirm checkpoint 3.
Can we control the tightening torque?
Put ○ if we can control by ourselves. Put × if we can not.
What do you think?
○ ○
次ははチェックポイントの3である。締め付けトルクは、自分たちで制御できるか?
自分で制御出来れば○。出来なければ×です。どう思いますか?
チェックポイント3の結果
Because I can control by myself, I put ○.
○←Result of checkpoint 3
自分で制御出来るので、○を付けます。
19.
環境 設備大雨
雪
年令
市街地
山中
天候
若い
年配
出身地
群馬
Environment Method
MaterialHuman
High
Low
age
Humidity
Rain
Dry
Engine
rotational
speed
Young
Old
Skill
New face
Leader
Tightening power
Torque
Number of screw
Strength
Hardening
Engine oil
leakage
Cause and effect diagram 特性要因図
環境 方法
材料 人
エンジン油洩れ
トルク
ネジ本数
All of the three checkpoints ware ○.
Therefore, I can judge it as follows.
○ ○ ○
The tightening torque has the possibility of
the cause of the engine oil leakage.
3つのチェックポイントが全て○になった。従って、次のように判断できる。
20.
環境 設備大雨
雪
年令
市街地
山中
天候
若い
年配
出身地
群馬
Environment Method
MaterialHuman
High
Low
age
Humidity
Rain
Dry
Engine
rotational
speed
Young
Old
Skill
New face
Leader
Tightening power
Torque
Number of screw
Strength
Hardening
Engine oil
leakage
Cause and effect diagram 特性要因図
環境 方法
材料 人
エンジン油洩れ
トルク
ネジ本数
○ ○ ○
Next, check the number of the screw.
Check it from checkpoint 1.
Do you think that the oil leakage changes if the number of
the screw is changed?
Checkpoint
1. Does the result change if the cause is changed? ⇒ ○ ×
2.Was the cause different when the result was different? ⇒ ○ ×
3.Can I control by myself? ⇒ ○ ×
チェックポイント
原因を変化させたら、結果が変わるか?
結果が違うとき、原因は違っていたか?
自分たちで制御できるか?
次にネジ本数をチェックします。チェックポイントの1からチェックします。
ネジ本数を変化させれば、油漏れは変わると思いますか?
ネジ本数を増やせば、油漏れは減ると思うので、○を付けます
The oil leakage will decrease if the number of the screw is
increased. I put ○.
○←Result of checkpoint 1
21.
環境 設備大雨
雪
年令
市街地
山中
天候
若い
年配
出身地
群馬
Environment Method
MaterialHuman
High
Low
age
Humidity
Rain
Dry
Engine
rotational
speed
Young
Old
Skill
New face
Leader
Tightening power
Torque
Number of screw
Strength
Hardening
Engine oil
leakage
Cause and effect diagram 特性要因図
環境 方法
材料 人
エンジン油洩れ
トルク
ネジ本数
○ ○ ○
Next, confirm checkpoint 2.
Was there a difference of the number of the screw of whether the oil
leakage was or did not exist?
Put ○ when there was a difference. Put × if there was no difference.
What do you think?
Checkpoint
1. Does the result change if the cause is changed? ⇒ ○ ×
2.Was the cause different when the result was different? ⇒ ○ ×
3.Can I control by myself? ⇒ ○ ×
チェックポイント
原因を変化させたら、結果が変わるか?
結果が違うとき、原因は違っていたか?
自分たちで制御できるか?
次に、チェックポイントの2をチェックします。油漏れがあったときと無いときで、ネジ
本数に違いがあったか?違いがあったら○。違いが無ければ×です。どう思います
か?
○
ネジ本数が製品毎に変わっているはずはないので、×を付けます。
×←Result of checkpoint 2
Because the number of the screw of each product doesn't
change, I put ×.
22.
環境 設備大雨
雪
年令
市街地
山中
天候
若い
年配
出身地
群馬
Environment Method
MaterialHuman
High
Low
age
Humidity
Rain
Dry
Engine
rotational
speed
Young
Old
Skill
New face
Leader
Tightening power
Torque
Number of screw
Strength
Hardening
Engine oil
leakage
Cause and effect diagram 特性要因図
環境 方法
材料 人
エンジン油洩れ
トルク
ネジ本数
○ ○ ○
Checkpoint
1. Does the result change if the cause is changed? ⇒ ○ ×
2.Was the cause different when the result was different? ⇒ ○ ×
3.Can I control by myself? ⇒ ○ ×
チェックポイント
原因を変化させたら、結果が変わるか?
結果が違うとき、原因は違っていたか?
自分たちで制御できるか?
次に、チェックポイントの3をチェックします。ネジ本数は自分たちで変えられます
か?
どう思いますか?
Next, confirm checkpoint 3.
Can we change the number of the screw ?
Put ○ if we can change. Put × if we can not.
What do you think?
設計変更をすれば変えられるので○を付けます。
Because I can change by the design change, I put ○.
○←Result of checkpoint 3○×
23.
環境 設備大雨
雪
年令
市街地
山中
天候
若い
年配
出身地
群馬
Environment Method
MaterialHuman
High
Low
age
Humidity
Rain
Dry
Engine
rotational
speed
Young
Old
Skill
New face
Leader
Tightening power
Torque
Number of screw
Strength
Hardening
Engine oil
leakage
Cause and effect diagram 特性要因図
環境 方法
材料 人
エンジン油洩れ
トルク
ネジ本数
○ ○ ○
One is × among three checkpoints.
Therefore, I can judge it as follows.
The number of the screw is not a cause of
the oil leakage.
○× ○
24.
環境 設備大雨
雪
年令
市街地
山中
天候
若い
年配
出身地
群馬
Environment Method
MaterialHuman
High
Low
age
Humidity
Rain
Dry
Engine
rotational
speed
Young
Old
Skill
New face
Leader
Tightening power
Torque
Number of screw
Strength
Hardening
Engine oil
leakage
Cause and effect diagram 特性要因図
環境 方法
材料 人
エンジン油洩れ
トルク
ネジ本数
○ ○ ○
Next, check the Engine rotational speed.
Check it from checkpoint 1.
Do you think that the oil leakage changes if the engine
rotational speed is changed? What do you think?
Checkpoint
1. Does the result change if the cause is changed? ⇒ ○ ×
2.Was the cause different when the result was different? ⇒ ○ ×
3.Can I control by myself? ⇒ ○ ×
チェックポイント
原因を変化させたら、結果が変わるか?
結果が違うとき、原因は違っていたか?
自分たちで制御できるか?
次にエンジン回転数をチェックします。チェックポイントの1からチェックし
ます。回転数を変化させれば、油漏れは変わると思いますか?
どう思いますか?
○×○
The oil leakage will change if the engine rotational speed is
changed. I put ○.
○
回転数が変わると油漏れが変わると思うので、○を付けます。
25.
環境 設備大雨
雪
年令
市街地
山中
天候
若い
年配
出身地
群馬
Environment Method
MaterialHuman
High
Low
age
Humidity
Rain
Dry
Engine
rotational
speed
Young
Old
Skill
New face
Leader
Tightening power
Torque
Number of screw
Strength
Hardening
Engine oil
leakage
Cause and effect diagram 特性要因図
環境 方法
材料 人
エンジン油洩れ
トルク
ネジ本数
○ ○ ○
Next, confirm checkpoint 2.
Was there a difference of the engine rotational speed of whether
the oil leakage was or did not exist?
Put ○ when there was a difference. Put × if there was no difference.
What do you think?
Checkpoint
1. Does the result change if the cause is changed? ⇒ ○ ×
2.Was the cause different when the result was different? ⇒ ○ ×
3.Can I control by myself? ⇒ ○ ×
チェックポイント
原因を変化させたら、結果が変わるか?
結果が違うとき、原因は違っていたか?
自分たちで制御できるか?
次に、チェックポイントの2をチェックします。油漏れがあったときと無いときで、回転
数に違いがあったか?違いがあったら○。違いが無ければ×です。どう思います
か?
○×○
○
回転数に違いがあったと思うので、○を付けます。
Because I think there was a difference, I put ○.
○
26.
環境 設備大雨
雪
年令
市街地
山中
天候
若い
年配
出身地
群馬
Environment Method
MaterialHuman
High
Low
age
Humidity
Rain
Dry
Engine
rotational
speed
Young
Old
Skill
New face
Leader
Tightening power
Torque
Number of screw
Strength
Hardening
Engine oil
leakage
Cause and effect diagram 特性要因図
環境 方法
材料 人
エンジン油洩れ
トルク
ネジ本数
○ ○ ○
Checkpoint
1. Does the result change if the cause is changed? ⇒ ○ ×
2.Was the cause different when the result was different? ⇒ ○ ×
3.Can I control by myself? ⇒ ○ ×
チェックポイント
原因を変化させたら、結果が変わるか?
結果が違うとき、原因は違っていたか?
自分たちで制御できるか?
次に、チェックポイントの3をチェックします。エンジン回転数は自分たちで制御できますか?
Next, confirm checkpoint 3.
Can we change the engine rotational speed ?
○×○
○ ○
The driver of the car decides the engine rotational speed.
Because we can not change, I put ×.
×
エンジン回転数は車の運転手が決めることです。自分たちでは変えられないので、×を付けます。
27.
環境 設備大雨
雪
年令
市街地
山中
天候
若い
年配
出身地
群馬
Environment Method
MaterialHuman
High
Low
age
Humidity
Rain
Dry
Engine
rotational
speed
Young
Old
Skill
New face
Leader
Tightening power
Torque
Number of screw
Strength
Hardening
Engine oil
leakage
Cause and effect diagram 特性要因図
環境 方法
材料 人
エンジン油洩れ
トルク
ネジ本数
○ ○ ○
One is × among three checkpoints.
Therefore, I can judge it as follows.
The engine rotational speed is not a cause of oil leakage.
(Even if it is a cause, we can not possible to control. )
○× ○
3つのチェックポイントのうち、1つが×になった。従って、次のように判断できる
エンジン回転数は油漏れの原因ではない。(原因だとしても制御できない)
○ ○×
28.
Exercise by yourexample
Please check your cause and effect
diagrams by such a way.
You may partially execute it while it
takes time when everything is done.
自分の実例での演習)
このようなやり方で、自分たちの特性要因図をチェックしてみてください。
全てやると時間がかかるので、部分的に実施していいです。
29.
How did theresult of the check become it?
If 3 ○ is put on all factors, a good cause and effect
diagram is good.
If there are a lot of factors that 3 ○ is not put,
a cause and effect diagram is not good.
The SQC technique is a tool.
In a word, it is not "Made thing" and "Thing used “.
The cause and effect diagram is made. →NG
The causal relation is examined by using the cause
and effect diagram. →OK
○が3つ付かない要因が多かったら、あまり良くない特性要因図である。
チェックした結果はどうなったか?
全て○が3つ付いたら良い特性要因図である。
特性要因図を使って因果関係を調べる・・・○
SQC手法は道具である。
つまり、「作る物」ではなく「使う物」である。
特性要因図を作る・・・×
30.
Examine the relationbetween two amounts.
Scatter chart
2つの量の関係を調べる
散布図
Next, I explain the scatter chart to examine
the relation between two amounts.
Exercise before the explanation.
次に、2つの量の関係を調べるための、散布図について説明する。
説明の前に、演習をやる。
Ⅱー(2) Causal relation grasp by numeric character data
数値データによる因果関係把握
31.
Causal relation analysisused numeric character data
【Exercise 1 】Please make the scatter chart after completing an empty column below.
Leakage
of oil
Tightenin
g torque
50 10
30 20
20 30
20 40
10 50
結果 原因
× ○
Notes
(Yes or No)
Can you operate?
(cause or result)
R2
= 0.9
0
10
20
30
40
50
60
0 10 20 30 40 50 60
Tightening torque
Leakageofoil
Causal relation analysis used numeric character data
Exercise 1 Please make the scatter chart after completing an empty column below.
Which is cause
or result?
Which can you
operate?
The relation between cause and result is important.
数値データを用いた因果関係分析
下の空欄を埋めた後、散布図を作成してください演習1
原因と結果の関係が重要
32.
1.The cause isapplied to a horizontal axis.
And, the result is applied to a vertical axis.
2.The generation time earliness is applied to a
horizontal axis for the scatter chart without
the relation between the cause and the result.
3.Besides, application to the axis is free.
原因は横軸にとり、結果を縦軸に取る。
原因と結果の関係が無い散布図の場合は発生時間の早いほうを横軸に取る。
それ以外であれば、軸の採り方は自由。
Attention when axis in scatter chart is decided
散布図の軸を決める際の注意
Meaning of R2= coefficients of determination by Excel
R
2
= 0.9
0
10
20
30
40
50
60
0 10 20 30 40 50 60
Tightening torque
Leakageofoil
ST=Total
dispersion
SB=Undecided
dispersion
R2= ST= Total dispersion
SA=Decided dispersion
=1-
ST
SB
(=0.9)
(In this case)
It is possible to
calculate by Excel.
エクセルでのR2=決定係数の意味
エクセルで、計算出来る。
全体のばらつき
決定できなかったばらつき
決定できたばらつき
全体のばらつき
35.
Exercise 2 Considerthe following combination of the heights.
My height Father’s
height
Neighbors’
height
170 165 165 165
170 175 175 175
185 180 180 180
180 185 185 185
190 195 195 195
Notes
160
170
180
190
200
160 180 200
Father’s height
Myheight
160
170
180
190
200
160 180 200
Neighbors’ height
Myheight
160
170
180
190
200
160 180 200
Brother’s height
Myheight
Causal relation Relation Irrelevance
While the same figure filled, the
shape of the scatter chart is same.
What relations are these relations
of three?
Write in the square below.
Judge whether there is a relation between the cause and the result
from a peculiar technology.
Brother’s
height
Do exercise 2
36.
Summary:The basis ofthe problem solving is
to grasp the causal relation.
① Evaluate in 3 checkpoints.
1. Does the result change if the cause is
changed?
2.Was the cause different when the result was
different?
3.Can I control by myself?
② Evaluate coefficients of determination
(strength of the relation).
③ Finally, judge from a peculiar technology.
まとめ:問題解決の基本は因果関係を把握すること
③ 最終的には固有技術で判断する
① 3つのチェックポイントで評価する
1.原因を変化させたら、結果が変わるか?
2.結果が違うとき、原因は違っていたか?
3.自分たちで制御できるか?
② 決定係数(関係の強さ)を評価する
37.
Grasp of causalrelation is necessary
to investigate a true cause.
If a true cause was investigated, the problem
was just solved. It only has to do measures to
the cause.
Understanding raw data correctly is
necessary to investigate the cause in
a scientific manner.
Then, let's practice the data grasp by the simple calculation.
真の原因を究明するには、因果関係を把握しなければならない
真の原因が究明できれば問題は解決したのと同じ事.
原因に対して対策をすればいいのだから
科学的に原因究明するためには、生データを正しく把握することが必要
では、簡単な計算をして、データを把握することの練習をします。
Ⅲ Correct grasp of the situation
正しい現状把握
38.
Note the accuracyof data
データの吟味
3つの部品を組み合わ
せて製品にします。そ
れぞれの重さは次の通
りです。製品の重さは
いくらになりますか?
縦は6m、横は1m53
cmの長方形の土地
があります。面積はい
くらですか?
12.6Vの電池に2Ω
の抵抗をつなぎました。
流れる電流は何Aで
すか?
データの精度に注意
足し算・引き算の場合
は、位取りを一番上に
揃えます。だから、詳
しい方の数字は無視
します。
かけ算・割り算の場合は、位取りでは
なく、有効数字の桁数で揃えます。一
番小さい桁数に揃えます。
Ⅲー(1)Numeric character data
Examination of data
Exercise 3 Calculate
① Make the product by combining 3 parts.
Each weight is as follows.
9kg 2.3kg 135g
How much is the weight of the product? answer 11kg
② Make the product by combining three parts.
Each weight is as follows.
9.0kg 2.3kg 135g
How much is the weight of the product? answer 11.3kg
Exercise 4
① There is rectangular land of 6m in length and 1m53cm in side.
How much is the area? answer 9m2
② The resistance of 2Ω tied to the battery of 12.6V.
How much is flowing current A? answer 0.8A
39.
Note the accuracyof the measurement data!
①For the addition and the
subtraction, arrange a unit to most
big figure. Therefore, you may
disregard a detailed figure.
②For the putting calculation and
the dividing calculation, arrange the
number of digits to the number of
digits of significant digits instead
scaling. Arrange in the smallest
number of digits.
足し算・引き算の場合は、位取りを一番上に揃える。
だから、詳しい方の数字は無視する。
かけ算・割り算の場合は、位取りではなく、有効数字の桁数
で揃える。一番小さい桁数に揃える。
測定データの精度に注意!
40.
Exercise 5
① Calculatethe mean value.
Weights of four parts 3g, 4g, 5g, 6g
answer 4.5g
② Age of three people 35, 36, 37 years old
answer36.5years old
Note the accuracy of the measurement data!
次の平均値を求めてください
4つの部品の重さ
3人の年齢
測定データの精度に注意!
Do exercise 5
41.
Attention of averagecalculation
【Number of digits】
Calculate the mean value of 20 data or less even of a
digit that is one digit larger than the number of digits of
former data.
Calculate the mean value of 20 data or more even of a
digit that is two digits larger than the number of digits
of former data.
【Kind of former data】
The data of the age is a value of the round-down though
usual data is a half-adjust. Such an example is special.
Add 0.5 to the mean value when former data is a round-
down.
平均を求める際の注意!
【桁数】
20個以下のデータの平均値は、元のデータの桁より、1桁小さい桁まで求める。
20個を超えるデータがある場合は、元のデータの桁より、2桁小さい桁まで求める。
【元のデータの種類】
普通のデータは4捨5入だが、年齢のデータは切り捨ての値である。この様な例
は特殊である。元のデータが切り捨ての場合、平均値には、0.5を加える。
42.
⇒To secure necessaryaccuracy finally, select
the measuring instrument and measure the
measurement data.
+ ー × ÷
Data from various measuring instruments
For the result by the calculation processing
いろいろな測定器からのデータ
計算処理して結果を得る場合
最終的に必要な精度を確保できるように、計測器の
選定や測定データの採り方をしなければならない
0.000001 0.01 1 0.01
0.001 ←精度
43.
Though the numericcharacter data are more
excellent than the language data, there is no
numeric character data but there might be
only language data.
Understand the current state correctly to
investigate the cause in a scientific manner.
科学的に原因究明するためには、現状を正しく把握することが必要
数値データの方が言語データより優れるが、数値データが無く、
言語データしかない場合がある
Ⅲー(2) Language data
44.
Difference between thenumeric
character data and language data
・Experience shortage
・Insufficient attention
・Insufficient guidance
・Parts supplier A company
In volume of information and accuracy,
the numeric character data is superior
to the language data.
Whether a quality
item or a defective
item are understood.
It disperses for the
standard on a
large side.
★For instance,
only at the quality judgment because it
takes time to record all sizes
However, we should
understand causal
relation by language
data.
Sizes of parts(standard value: 10.0~11.0)
numeric character data language data
10.8
11.3
10.8
11.2
10.9
10.7
OK
NG
OK
NG
OK
OK
★For instance,
when not becoming the numeric
character data
数値データと言語データの違い
例えば、
寸法を全て記録するのは時間がかかる
ので、良否判定しかしない場合
規格に対して、大きい側に
ばらついている事が分かる
良品か不良品かしか分からない
言語データより数値データの方
が ・情報量が多い ・正確
例えば、
数値データにしたくても、
なりにくい場合もある
・経験が浅い
・注意が足りない
・指導が不十分
・部品メーカーA社
しかし、言語データでも因果関係は把握しなければならない
45.
The seven newQC tools 【Affinity diagram method】
Ⅰ.Affinity Diagram
Find out problems in the chaos and get solutions.
1.Features
1)Possible to clarify existence and form of problems to
be solved by grasping facts, opinions and concepts with
text data concerning ambiguous problems such as
problems in the future and unknown and inexperienced
problems and by drawing integrated pictures with
mutual affinity obtained from text data.
2)Effective for focusing on problems.
3)Originated from “KJ Method” and called as Affinity
Diagram due to Trade Mark Registration.
2. How to make Affinity Diagram
Method to make Affinity Diagram by individual
Enumerate problems, enter them in cards, group them
by similarity, title them and repeat it.
Put them in order, stick them to a large paper and
arrange them to be possible to see them easily at a
glance.
Example of technique for analyzing language data.
言語データを分析する手法の例を示す。
46.
Ⅱ.Relation Diagram
This servesto clarify cause and effect of problems that
intertwine complexly and to find out appropriate
solutions.
1. Features
Possible to solve problems by connecting relations
logically in which cause-effect and purpose-measure
etc. intertwine complexly.
2.How to make Relation Diagram
Set a subject of “why------can not be achieved”, find out
causes repeating “why”, “why”
primarily and secondary etc. towards the subject,
connect the revealed causes with
solid lines and clarify their relations.
The seven new QC tools 【Relation diagram method】
47.
High
Handling
Cost
Small
Purchase
Volume
Multiple
Forwarder
Purchase based on
nextmonth
requirement +
buffer
Insufficient Lead-
time
Free choice of
forwarder
Different location
Increase purchase
volume
Combine delivery
Weekly forecast review
PROBLEM CAUSES ROOT CAUSES COUNTERMEASURES
Request supplier to
keep stock
Forwarder nomination
Delivery to one
location for
consolidation
III.System Diagram
This serves to pursue systematically the most suitable
measures to perform objectives.
1.Features
Setting ideal image and target, deploy means and
measures to achieve it as below
and find out next most suitable means and measures.
2. How to make System Diagram
(1) Get ideas on means and measures based on key
word of “in order to do ~”.
(2) Confirm always if it is concrete after deployment.
※It’s also applicable to “why, why” questions based on
the key word of “why it becomes so” instead of “in order
to do ~”.
The seven new QC tools 【System diagram method】
48.
IV.Matrix Diagram
This servesto clarify problems by pluralistic thinking
ways.
1. Features
(1) Paying attention to a point of intersection of X and Y
axes utilizing dual
viewpoints which are the features of Matrix Diagram;
・to search existence and form of problems
・to get ideas of problem-solving
3. How to make Matrix Diagram
(1)Set items related to phenomena, causes,
countermeasures and processes in X and
Y axes (Z axis etc.) and clarify interrelations.
(2) Pay attention to related items deeply and evaluate
their importance. Find out causes and countermeasures.
The seven new QC tools 【Matrix diagram method】
49.
No. Text dataKinds
1 There is a book in the room. 事実
2 The book is putting out to the room. 意見
3 There is a space in the bookshelf. 事実
4 The material five years ago remains on the bookshelf. 事実
5 It takes time to look for target material. 意見
【Exercise】Please think about the kind of the following data.
A common problem to the language data is that the meaning is
vague. Therefore, it is necessary to lose vagueness as much as
possible.
It is necessary to take care about the following classifications.
Text data can be divided into the following 3 types
Fact Data Data that expressed results of observation
as they are with language.
Opinion data Data including Fact-ism and Insistence
Conceptual data Data newly built up based on the facts
ContentsKinds
Classification of dataにんじんの長さ(n=100)
0
10
20
30
40
50
1314 15 16 17 18 19 20 21 22 23 24 25 26 27 28
120%、95%、115%、・・
60kg、70kg、65kg、・・
10 pieces, 12 pieces,15
pieces・・・
..the second place.. third
place the first place
0 , 0 , 0 , 1 ( D u m m y )
0 , 0 , 1 , 0
0 , 1 , 0 , 0
1 , 0 , 0 , 0
A、O、B、AB(Blood type)
The machine broke.
He was late to the conference.
Proportion
standard
Measureme
nt value
Calculation
value
Nominal
scale
Ordinal
scale
Interval
Quantitat
ive
variable
Qualitativ
e variable
The
numeric
character
data
Language
data
Image data
The interval standard has a quantitative meaning at intervals
between data and data.
Ordinal scale doesn't have a quantitative meaning between data
and data.
Nominal scale doesn't mean the order between data and data.
52.
にんじんの長さ(n=100)
0
10
20
30
40
50
13 14 1516 17 18 19 20 21 22 23 24 25 26 27 28
The
numeric
character
data
Language
data
Image data
Easiness
tosee
◎
△
×
Q7
N7
◎
×
◎
△
×
It is N7 to convert the language data into the image data.
It is Q7 to convert the numeric character data into the image data.
The photograph and the graph are the image data.
120%、95%、115%、・・
60kg、70kg、65kg、・・
10 pieces, 12 pieces,15
pieces・・・
..the second place.. third
place the first place
0 , 0 , 0 , 1 ( D u m m y )
0 , 0 , 1 , 0
0 , 1 , 0 , 0
1 , 0 , 0 , 0
A、O、B、AB(Blood type)
The machine broke.
He was late to the conference.
The purpose to use the tool is visualization.Accuracy
Volumeof
information
Easiness
tosee
53.
The result ofthe questionnaire of the user of the car is this table.
Even if the enumeration of the figure is seen, anything cannot be understood. However, when this figure is converted into the image data
by the principal component analysis, essence is shown. Men are more than women, and driving is 15 minutes or more in the company
employee. The housewife of the part work makes shopping a night and short for 15 minutes or less at the driving time. The full-time
housewife can shop in daytime because it can freely spend time of daytime. Such a natural thing is hidden as information in the table.


![QC story to solve problem
1・2 [Select Topic and Selection reason]
①To dig up problems and subjects considering difficult problems amongst members and also policy and subjects at workplace and to
focus on those evaluating them from viewpoints of necessity and to decide topic and subject.
②To decide QC story so that topic and subject can be solved effectively and efficiently.
③To plan activities’ schedule like overall schedule and assignment of roles so that activities can sure be performed.
3 [To understand & analyze situation and to set targets]
①To survey present bad situation of subject from several angles. To focus on badness and to find out serious problems affecting overall
badness.
②To decide to what degree badness is to be improved.(to set targets)
4 [Analyze causes]
To dig up causes which seem to be sauces of badness and to extract important causes out of them. To verify them with fact and data and
to find out real cause.
[Consider countermeasures]
To consider several methods to get rid of real sauce(countermeasures) and to evaluate them from viewpoints of effect and possibility of
realization. To select methods.
5 [Implementation of countermeasures]
To plan and implement countermeasures.
6 [Check results]
①To check results with facts and data if what results are obtained against targets originally aimed and if what effects other than direct
effects originally aimed are also obtained.(Tangible effects)
②To evaluate yourself and confirm how you grow up through activities.(Intangible effects)
7 [Standardization]
To investigate and implement methods how to maintain and manage effects in order not to go back- ward and also to confirm if effects
are maintained or not.
8 [Problems left and Future Plan]
To reflect procedures of activities regarding QC Stories to achieve subject as well as to solve problem so that level of future activities can
be raised. To plan future activities clarifying good and bad points and also problems and subjects left.
もっとも重要なステップは何処か?](https://image.slidesharecdn.com/sqc1-191017095302/85/Sqc1-6-320.jpg)


![Checkpoint
1. Does the result change if the cause is changed?
[ OK or NG ]
2.Was the cause different when the result was different?
[ OK or NG ]
3.Can I control by myself?
[ OK or NG ]
Result(Characteristic)
Cause(Factor)
結果(特性)
原因(要因)
Three checkpoints 3つのチェックポイント](https://image.slidesharecdn.com/sqc1-191017095302/85/Sqc1-10-320.jpg)


![Rodebaugh sixsigma[1]](https://cdn.slidesharecdn.com/ss_thumbnails/rodebaugh-sixsigma1-191102025225-thumbnail.jpg?width=640&height=640&fit=bounds)

