SlideShare a Scribd company logo
1 of 75
Download to read offline
Running Head: SUCCESSFUL ALTERNATIVES TO 1
Abstract
This research was conducted to demonstrate the decreased costs to the government to
alternatives to incarceration (total cost per individual for justice reinvestment versus total cost of
incarceration) and to quantify the additional benefits that program components from programs such as
Back on Track offer in assisting individuals to maintain successful crime-free lives. By investigating the
correlation between education/literacy and the general prison population, a clear link between education
level and potential to commit low-level crime was established.
The research involved comparisons of the U.S. data and justice practices with other countries to
allow the recognition that the high incarceration rate in the U.S. is not typical of any other country and
the crime rate in the U.S. does not correspond to its high incarceration rates. This data shows that
approaches used in other countries, such as coordinating efforts with offender services such as health
and housing and community organizations, coupled with reducing prison admissions and lengths of
incarceration by offering reinvestment in justice, is more financially beneficial and increases public
safety.
As spending and the expenditures of incarceration are increasingly impacting U.S. state
spending, including education, decision makers must examine justice reinvestment as a solution to
managing offenders instead of incarceration, and reducing penalties using a broad range of approaches,
including, but not limited to, higher educational attainment, workforce development training, life skills
training, and parenting support. Promoting usable skills allows offenders to obtain legal employment
and establish the foundation for leading a crime-free life.
SUCCESSFUL ALTERNATIVES TO 2
Successful Alternatives to Incarceration for Low-level Offenders
Jennifer M. York
Columbia Southern University
DBA9406D
Student ID 118075
SUCCESSFUL ALTERNATIVES TO 3
Approval
We, the undersigned, certify we have read this dissertation and approve it as adequate in scope and
quality for the degree of Doctor of Business Administration.
Recipient of Degree: Jennifer M. York
Title of Dissertation: Successful Alternatives to Incarceration for First-Time Offenders
________________________________________ ________________________________
Chair of Committee, Dr. Corinne Patrick, DPA Date
________________________________________ ________________________________
Member, Dr. Robert Goldwasser Date
________________________________________ ________________________________
Member, Dr. Monica Sainz, DSM Date
SUCCESSFUL ALTERNATIVES TO 4
Dedication
This body of work is dedicated to my dad, Bill Mays, who never stopped believing in me.
SUCCESSFUL ALTERNATIVES TO 5
Acknowledgements
I want to thank the many individuals who contributed to the successful completion of this work.
SUCCESSFUL ALTERNATIVES TO 6
Table of Contents
Introduction............................................................................................................................................... 9 
Statement of Problem............................................................................................................................ 9 
Purpose Statement............................................................................................................................... 10 
Breaking the Cycle of Crime. ....................................................................................................... 11 
BOT Program Eligibility............................................................................................................... 11 
BOT Program Components........................................................................................................... 12 
Significance of the Study.................................................................................................................... 13 
Literature Review ................................................................................................................................... 14 
Workforce Development..................................................................................................................... 14 
Parenting Support................................................................................................................................ 14 
Life Skills Training............................................................................................................................. 15 
Education ............................................................................................................................................ 16 
Methodology of Research....................................................................................................................... 17 
Description of Decision Criteria......................................................................................................... 17 
Research Methodology: Quantitative Approach........................................................................... 17 
Quantitative Data Analysis. .......................................................................................................... 18 
Incarceration ....................................................................................................................................... 19 
Definition...................................................................................................................................... 19 
Educational and Socioeconomic Characteristics of the Incarcerated Population......................... 22 
Changes in the Criminal Justice System and the Effect on Incarceration Rates. ......................... 28 
Juvenile Crime. ............................................................................................................................. 35 
Recidivism .......................................................................................................................................... 36 
Definition...................................................................................................................................... 36 
San Francisco Recidivism Rates................................................................................................... 37 
California Recidivism Rates. ........................................................................................................ 37 
U.S. Recidivism Rates. ................................................................................................................. 40 
International Recidivism Rates..................................................................................................... 42 
Comparison of U.S. Recidivism Rates to International Recidivism Rates................................... 42 
Linking Crime/Incarceration and Education................................................................................. 44 
Linking Recidivism and Education............................................................................................... 46 
Additional Consequences for Incarcerated Individuals Re-entering the Public Community....... 47 
Sample U.S. Educational Programs and Early Results................................................................. 54 
Findings.................................................................................................................................................... 58 
Research Purpose................................................................................................................................ 58 
Incarceration and Recidivism. ...................................................................................................... 59 
Linking Crime/Incarceration and Education................................................................................. 59 
Linking Recidivism and Education............................................................................................... 59 
Conclusions and Recommendations...................................................................................................... 61 
Statistical Analysis.............................................................................................................................. 62 
SUCCESSFUL ALTERNATIVES TO 7
Long-Term Economic and Public Safety Impacts of Incarceration.................................................... 66 
Impacts of incarceration on children............................................................................................. 66 
Recommendations for Future Research.............................................................................................. 67 
References................................................................................................................................................ 69 
SUCCESSFUL ALTERNATIVES TO 8
List of Tables
1 Total U.S. Jail Population 2001, 2008, 2009 .............................................................................................. 20
2 Total U.S. Prison Population 2001, 2008, 2009.......................................................................................... 21
3 Total Male Prisoners Under the Jurisdiction of State or Federal Authorities ............................................. 25
4 Total Female Prisoners Under the Jurisdiction of State or Federal Authorities.......................................... 26
5 U.S. Incarceration Rates: 1980 through 2009............................................................................................. 29
6 Entire World – Prison Population Totals.................................................................................................... 33
7 Recidivism Rates Within 1- and 2-Year Follow-up Periods for Felons Paroled
to California Supervision ............................................................................................................................ 39
8 Comparison of Recidivism Rates................................................................................................................ 43
9 Incarceration Data....................................................................................................................................... 63
10 Statistical Analysis...................................................................................................................................... 63
11 Statistical Analysis...................................................................................................................................... 65 
List of Figures
1 Total U.S. Jail Population 2001, 2008, 2009 .............................................................................................. 20 
2 U.S. Prison Population 2001, 2008, 2009................................................................................................... 21 
3 Institutional Population by Racial/Ethnic Group and Gender..................................................................... 24 
4 Total Male Prisoners Under State or Federal Jurisdiction 2001, 2008, 2009 ............................................. 25 
5 Total Female Prisoners Under State or Federal Jurisdiction 2001, 2008, 2009.......................................... 26 
6 General and Prison Population Education Data.......................................................................................... 27 
7 Number of Incarcerated per 100,000 .......................................................................................................... 29 
8 The Cycle of Prison Release....................................................................................................................... 41 
9 Prison Count 1987-2007 ............................................................................................................................. 52 
10 Prison Costs 1987-2007 .............................................................................................................................. 52 
11 State Spending on Corrections.................................................................................................................... 53 
12 State Spending on Higher Education .......................................................................................................... 53 
13 Total Number Incarcerated ......................................................................................................................... 64 
14 Total Cost of Incarceration ......................................................................................................................... 64 
15 Graphical Analysis...................................................................................................................................... 65 
SUCCESSFUL ALTERNATIVES TO 9
Introduction
The Back on Track (BOT) program is designed to break the cycle of crime. Releasing prisoners
at the end of their sentences with no skills, no plan, nowhere to turn, and no other changes to the
circumstances that initially led them to prison creates a revolving door in and out of the criminal justice
system. The BOT program uses the tools of the existing criminal justice system, combined with direct
services and advocacy, to improve the economic opportunity for some of the Bay Area and City of San
Francisco’s most underserved residents. The BOT program demonstrates the economic and social
effectiveness of providing workforce development tools for young adults to avoid felony conviction.
Program participants (defendants) plead guilty to a crime and their sentencing is deferred for 12 to
18 months, during which time the defendants appear before a judge every 2 weeks to monitor
compliance and progress. When a participant has successfully completed the program, the San Francisco
District Attorney’s (SFDA) Office motions the court to dismiss the case under California Penal Code
1000.5 (http://law.onecle.com/california/penal/1000.5.html), the Public Defender then requests the
records be sealed under California Penal Code Section 851.90 (http://www.leginfo.ca.gov/cgi-
bin/displaycode?section=pen&group=00001-01000&file=833-851.90), and the participants retain a
clean record. If a participant is charged with a new crime or fails the program, that individual is
immediately terminated from the program and set to be sentenced. The BOT program costs
approximately $5,000 per participant, compared with $10,000 to adjudicate a case and almost
$50,000 per year to incarcerate a low-level offender in a California prison or jail (Rivers &
Anderson, 2009).
Statement of Problem
The problem is the lack of benefit resulting from the current justice system practice for the last
30 years, which has focused on incarcerating low-level offenders without identifying the long-term
SUCCESSFUL ALTERNATIVES TO 10
effects of those incarcerated. Incarcerating low-level offenders has not resulted in deterring low-level
offenses. Low-level offenders are often individuals without adequate education or workforce
development skills, who then commit crimes as a means of producing income. When these individuals
are released from incarceration, they continue to commit crimes and are re-incarcerated because they
have no additional education or workforce training than they had at the time of their first commission of
a crime. After 30 years, it is time to review the current practices in the U.S. and in other countries, which
offer a different approach to the “tough on crime” stance. This study is important, as U.S. states and the
federal government are running out of funding for the current trend of putting individuals through the
criminal justice system, building and staffing more prisons, and then repeating the cycle. The
importance of the study is to acknowledge that the current approach is ineffective and begin to identify
alternative options to incarceration, including increasing funding in the areas of education and workforce
development.
Purpose Statement
The purpose of the research is to demonstrate the decreased costs to the government of
incarceration (total cost per individual versus total cost of incarceration), and quantify the additional
benefits the program components offer in assisting individuals to maintain successful crime-free lives—
investigating the correlation between education/literacy and the general prison population and
identifying some non-financial additional successes of similar programs throughout the U.S. for
individuals prior to incarceration and for individuals who are incarcerated—i.e., secondary successes
derived from gaining literacy and the opportunities realized from workforce development education,
which sustains a significant decrease in recidivism. This data will be developed using existing research
for prison education programs within and outside the U.S. to demonstrate the correlation between the
decreasing return on investment of continuing to fund the prison system at the expense of funding
SUCCESSFUL ALTERNATIVES TO 11
education. The BOT program promotes an intelligent approach to crime, using interventions that benefit
the community, victims, and offenders.
Breaking the Cycle of Crime.
The BOT program uses Deferred Entry of Judgment in place of a felony conviction for narcotics
sales. Most low-level offenders enter into and out of the system and are released from incarceration with
no additional support or skills besides those which they possessed at the time of committing the initial
crime and were sentenced. Lacking any work, education, or social integration prospects, many offenders
commit additional crimes (Allen & Stern, 2007). Left with no other resources than what these
individuals possessed prior to incarceration, they return to criminal activities. Within 3 years after
release, 7 out of 10 California prisoners will return to prison, following additional offenses (Rivers &
Anderson, 2009). Communities are recognizing that investing in rebuilding the communities to which
the prisoners return by providing better education, health care, and public space resources may be a
solution to expanding and funding the prison system (Allen & Stern, 2007). The BOT program
demonstrates a snapshot into the broader picture of spending on prosecuting and sentencing low-level
offenses, incarceration, recidivism, and cycle of crime, and the potential benefit of spending on
education and workforce development.
BOT Program Eligibility.
Eligibility in the BOT Program is restricted to young adult first-time drug offenders arrested with
small quantities of narcotics. If a defendant has a history of gun possession, gang involvement, or
violence, they are not eligible for the program. The program grants preference to offenders who are the
parents of young children. Once an individual is arrested for possession-for-sale or drug sales, the
SFDA’s office reviews the case as well as the individual’s criminal record to determine eligibility.
Following the determination of eligibility, the defendant is granted the option of participation in the
SUCCESSFUL ALTERNATIVES TO 12
BOT Program.
BOT Program Components.
Participants are closely supervised by the court while engaged in intensive, mandatory personal
responsibility programs. Initially, individuals participate in a 6-week probationary screening phase to
assess their motivation and commitment. During this initial period, participants must complete an
orientation and perform an intensive program involving 60 hours of community service. Individuals are
then eligible to enroll in the program.
During the program, participants work with Goodwill Industries’ BOT Career Advisors, and
each participant develops a personal responsibility plan that outlines her or his individual, specific
workforce, educational, family, and other objectives for the 12- to 18-month program. The participants’
objectives may include the following: finding and securing full-time employment, learning to read,
obtaining a high school diploma, enrolling in City College, opening and maintaining a bank account,
stabilizing their housing situation, attending parenting classes, and abiding by child support orders.
Participants are provided significant support services to allow them access to the tools they need to reach
each objective outlined in their personal responsibility plan.
Program participants are offered access to the following (San Francisco District Attorney, 2011):
1. Workforce development and placement, Union-based pre-apprenticeships, Goodwill
Industries’ paid Transitional Jobs Program
2. Interactive monthly life skills workshops
3. Parenting support and mental health services
4. Educational opportunities, including GED (general educational development) classes and
assistance with applications and financial aid at San Francisco City College and other
colleges
SUCCESSFUL ALTERNATIVES TO 13
Significance of the Study
The study is significant because it provides documentation of the population incarcerated, the
cost of incarceration, and potential alternatives to incarceration. In addition, the study offers additional
benefits to identifying and implementing alternatives to incarceration beyond simply comparing the cost
of incarceration versus the cost to employ alternatives. Additional benefits to change the criminal justice
system from incarceration to rehabilitation include less overall cost to the U.S. economic system, as
individuals have the opportunity to become taxpayers and discontinue use of the public assistance
service for housing, medical, and food. Additional studies may investigate not simply the amount saved
by not incarcerating individuals during their life cycle, but may also quantify the amount paid back into
the economic system through legitimate work throughout an individual’s life.
SUCCESSFUL ALTERNATIVES TO 14
Literature Review
The program resources are targeted at increasing the potential for success in the program and
maintaining a crime-free future. The program is composed of 4 components, this research will briefly
discuss the benefits of 3 of the components, workforce development, parenting, and life skills, but the
main focus of the research is the educational component.
Workforce Development
Offering workforce development and placement, Union-based pre-apprenticeships, and the
Goodwill Industries’ paid Transitional Jobs Program offers a positive workplace experience and
provides opportunities for full-time employment, which have previously been difficult for the program
participants. Recent research has shown that employment opportunities are associated with decreased
potential for recidivism—committing a new crime resulting in a new conviction or for violating parole
or probation—as well as increased time between release and reincarceration for offenders that commit
additional crimes. In addition, one particular research study argues that increased time spent crime-free
indicates a positive change of behavior that allows individuals to maintain the initial motivation
associated with employment (Tripodi et al., 2009).
Parenting Support
Research shows a correlation between juvenile delinquency and adult criminality. According to a
National Institute of Justice study, abused and neglected children were 11 times more likely to be
arrested for criminal behavior as juveniles, 3.1 times more likely to be arrested for 1 of many forms of
violent crime (juvenile or adult), and 2.7 times more likely to be arrested for violent and criminal
behavior as adults (English et al., 2004). Supporting individuals to parent using models that promote
healthy interaction is critical to successful parenting.
SUCCESSFUL ALTERNATIVES TO 15
Life Skills Training
Much of the underserved youth population suffers from undeveloped life skills. Through
interactive life skills workshops, BOT participants are given specific tools to succeed in the workplace.
Research shows that early interventions with youth are extremely important in preventing criminal
behavior in young adults. Because aggressive behavior is learned early in a child’s life, education in
impulse control, anger management, and conflict resolution are important for offering tools for
managing life situations and preventing socially unacceptable behavior. Interventions that promote good
social relationships between young people and adults have also resulted in effectively building resilience
and reducing criminal behavior in youth. The underserved youth do not always have an opportunity to
observe functional social role models or receive mentoring in order to acquire the range of interpersonal
and social skills needed for proper social development, i.e., skills used in daily interactions, which can
be violence prevention skills, as they prevent violence by maintaining social interactions.
Basic life skills training includes behaviors such as developing empathy for others, reflecting on
the consequences of actions, and conflict resolution. To produce a successful outcome to a conflict,
many individuals must be trained in the skills needed to resolve conflicts peacefully (La Vigne et al.,
2006). While additional research is necessary, research also suggests that cognitive-behavioral programs
may be more effective at reducing recidivism, however, the current research supports life skills
programs combined with probation as an indicator to help reduce recidivism and decrease violations to a
greater degree than probation only. Programs that teach life skills for criminal populations tend to
encompass a broad range of areas, including workforce development, personal care, time management,
budgeting, anger management, and relationship building (Farkas, 2000; Finn, 2000; Orosz, 1996).
Because the content of life skills programs is different from one program to the next, the statistical data
on the success of life skills programs is deficient. However, among the limited existing individual
SUCCESSFUL ALTERNATIVES TO 16
program evaluations of life skills programs, the results are positive. One study found prisoners that were
taught problem solving, assertiveness, and interpersonal and practical living skills became more
assertive, had higher self-esteem, were more empathetic, and had better social skills (Marshall et al.,
1989).
Education
Program participants are offered a range of educational opportunities, including GED classes and
assistance with applications and financial aid at San Francisco City College and other colleges.
Statistical data indicates that more than 60% of all prison inmates are functionally illiterate; penal
institution records show that inmates have a 16% chance of returning to prison if they receive literacy
help, as opposed to 70% who receive no help. Currently, more than 70% of inmates in U.S. prisons
cannot read above a fourth grade level (Write Express, 2011). Research has shown that internationally,
the quality and amount of education a youth receives and their academic success is strongly linked to
whether they choose to commit crimes (Dawes & Donald, 1999).
SUCCESSFUL ALTERNATIVES TO 17
Methodology of Research
Description of Decision Criteria
Incarceration can have a profound impact on the emotional and physical health of individuals as
well as friends, families, and society as a whole. Establishing that a rigorous program encompassing
workforce development, life skills, parenting education, and education is cost-effective for reducing the
overall numbers of incarcerated individuals, as well as contributing to the potential to maintain a crime-
free future will be demonstrated using the quantitative research methodology approach.
Research Methodology: Quantitative Approach.
The quantitative research design will be used to quantify the benefits of education in preventing
and reducing crime. This approach uses theoretical assumptions and methods of inquiry. These
assumptions will steer the methodology and direction of the data collection and analysis, and expand
the existing research to demonstrate approaches in specific areas of prevention prior to incarceration or
reentry programs for incarcerated individuals. The method itself involves the collection, analysis, and
combination of the quantitative data, which allows for a significant understanding of the
research problems.
The research dilemma of the existence of a possible alternative to incarceration can be solved
using statistical analysis in the form of numbers, and reinforced by statistical data showing success and
failure rates of existing programs throughout and outside the U.S.
The pre-existing and existing data is collected, analyzed, and combined to develop a more
complete representation of the problem than when separate studies are conducted prior to incarceration
or during incarceration—specifically, breaking the cycle of crime prior to incarceration by providing
previously non-existent education opportunities and breaking the cycle of crime during/after
incarceration by providing previously non-existent education opportunities. Using a quantitative
SUCCESSFUL ALTERNATIVES TO 18
approach for individuals prior to entering the prison system and for individuals within the prison system,
will offer additional insight into breaking the cycle of crime before imprisonment becomes a lifestyle, as
well as after it has become a life pattern. This research seeks to demonstrate that regardless of an
individual’s history or incarceration status, an education or adequate training have the potential to end
the cycle of crime regardless of the phase of that lifestyle the individual is experiencing. This design
corroborates that the data is less influenced by any one, individual personal bias toward one specific
program and/or interpretation of the researcher inherent in using the qualitative research process only for
one existing program.
Quantitative Data Analysis.
Instruments.
1. Statistical data analysis from the City of SFDA’s office from the program’s initial startup in
2005 until the July 2011 graduation to quantify the numbers of successful participants of the
current BOT program.
2. Statistical data analysis on crime and educational level in California and the U.S. using the 2010
Census and additional data, for the 5-year period of time during which the BOT program has
been operational. This data is necessary to support the hypothesis that a correlation between
crime and education exists.
3. Statistical data analysis on the educational level of incarcerated individuals in California and the
U.S. using available publications and information, for the 5-year period of time during which this
program has been operational. This data is necessary to support the hypothesis that a correlation
between crime and education exists.
4. Statistical data analysis on the educational programs being offered in the California prison
system for successful reentry of prisoners.
SUCCESSFUL ALTERNATIVES TO 19
5. Statistical data analysis on educational and reentry programs being offered in states outside the
California prison system for successful reentry of prisoners.
6. Statistical data analysis on educational and reentry programs being offered outside the U.S. to
allow successful reentry of prisoners in other countries.
Analysis.
The quantitative data analysis focuses on correlating the following research data, which links the
changes in the criminal justice system and effect on incarceration rates, educational and socioeconomic
characteristics of the incarcerated population, juvenile crime, recidivism and education, education and
incarceration, additional consequences to incarcerated individuals reentering the public community, and
potential changes to the additional legal consequences to reentering individuals. The data will then be
combined with data for incarcerated individuals reentering society outside the prison system in the State
of California, in the U.S. outside the State of California, and nations outside the U.S.
Incarceration
Definition.
For the purposes of this research project, incarceration includes individuals imprisoned in both
jails and prisons. The number of individuals (male and female) incarcerated in U.S. jails in the years
2001, 2007, and 2008 is shown in Table 1 and Figure 1. Table 2 and Figure 2 show the number of
prisoners (male and female) incarcerated in U.S. prisons in 2001, 2007, and 2008.
SUCCESSFUL ALTERNATIVES TO 20
TABLE 1
Total U.S. Jail Population 2001, 2008, 2009
12/31/2001 12/31/2008 12/31/2009
Total US 63,140 83,497 86,653
Total Federal 2,438 2,438 2,896
Total California 2,758 2,736 2,611
FIGURE 1
Total U.S. Jail Population 2001, 2008, 2009
Source: California Prisoners and Parolees, 2009
SUCCESSFUL ALTERNATIVES TO 21
TABLE 2
Total U.S. Prison Population 2001, 2008, 2009
12/31/2001 12/31/2008 12/31/2009
Total US 1,298,027 1,609,759 1,613,740
Total Federal 145,416 201,280 208,118
Total State 163,001 173,670 171,275
FIGURE 2
U.S. Prison Population 2001, 2008, 2009
Source: California Prisoners and Parolees, 2009
SUCCESSFUL ALTERNATIVES TO 22
Educational and Socioeconomic Characteristics of the Incarcerated Population
Today, more than 90% of the prison population is male; almost 50% is African American, and
the data currently available shows that 40% have not completed high school. Currently, 18% of the
general population does not have a high school diploma or equivalent compared to more than 40% of the
adult correctional population. Only 13% of the adult correctional population has any postsecondary
education, while almost one-half of the general population has some postsecondary education.
Incarcerated individuals are more likely than non-incarcerated individuals to have a GED than the
general population. Caucasian prisoners have a higher education level than African American and
Hispanic prisoners, while African Americans have a higher education level than Hispanics.
A higher education attainment may increase the ability to return to work, and thus may reduce
the likelihood of incarceration because the opportunity costs of illegal behavior, the psychological
effects of criminal activity, and the preferences involved in the decision-making process prior to
committing a crime, are different depending on educational level (Ewert & Wildhagen, 2011).
In the general population, 25% of young African American men did not complete high school,
compared to 14% of young white men. This is an 11 percentage point difference that can be compared to
58% of young African American men in prison who did not complete high school and 41% of young
white men in prison who did not, which is a 17% difference. The percentage of females in the general
population and the prison population is similar to the males; however, the educational attainment
percentage for the at-risk women was more similar to prisoners’ educational attainment than was the
distribution for the general household population outside prison. Female prisoners had lower levels of
educational attainment than women who were economically disadvantaged in the general population
(Ewert & Wildhagen, 2011).
Additional statistics show a 68% national graduation rate—almost one-third of public high
SUCCESSFUL ALTERNATIVES TO 23
school graduates do not graduate. These dropout/graduation rates show an extensive racial gap for
graduates, specifically:
 Students from minority groups that have been historically disadvantaged minority groups
(African American, Native American, and Hispanic) have a 50% chance of not finishing high
school with a diploma)
 The graduation rate for Asians and Caucasians is 77 and 75%, respectively
 The graduation rate for females is 8% higher than for males
 The gap for students that attend schools in racially segregated, high poverty, and urban
school districts is 15 to 18% higher
 The gaps in graduation rates are stratified in specific regions throughout the U.S.
(Harlow, 2003)
 Figure 3 shows the institution population gender as of December 31, 2009.
 Tables 3 and 4 and Figures 4 and 5 show the U.S. prison population broken out by gender
(California Prisoners and Parolees, 2009)
Learning disabilities.
As shown in the 2003 National Assessment of Adult Literary Prison Survey, a higher percentage
of prison inmates than adults living in households in the general population were male, African
American, and Hispanic, and a higher percentage had been diagnosed with a learning disability (17%
versus 6%) (Greenberg et al., 2007) (Figure 6).
As the rates of incarceration have increased, a significantly disproportionate of population
subgroups has been incarcerated, prompting researchers to focus their research on the characteristics
of prisoners.
SUCCESSFUL ALTERNATIVES TO 24
FIGURE 3
Institutional Population by Racial/Ethnic Group and Gender
Source: California Prisoners and Parolees, 2009
SUCCESSFUL ALTERNATIVES TO 25
TABLE 3
Total Male Prisoners Under the Jurisdiction of State or Federal Authorities
12/31/2001 12/31/2008 12/31/2009
Total US 1,391,261 1,609,759 1,500,278
Total Federal 135,171 188,007 194,493
Total California 163,001 173,670 171,275
FIGURE 4
Total Male Prisoners Under State or Federal Jurisdiction
2001, 2008, 2009
Source: California Prisoners and Parolees, 2009
SUCCESSFUL ALTERNATIVES TO 26
TABLE 4
Total Female Prisoners Under the Jurisdiction of State or Federal Authorities
12/31/2001 12/31/2008 12/31/2009
Total US 93,234 114,649 113,642
Total Federal 10,245 13,273 13,625
Total California 11,161 11,620 10,989
FIGURE 5
Total Female Prisoners Under State or Federal Jurisdiction
2001, 2008, 2009
Source: California Prisoners and Parolees, 2009
SUCCESSFUL ALTERNATIVES TO 27
FIGURE 6
General and Prison Population Education Data
Learning Disability-General Population 6
Caucasian High School Dropouts-General Population 18
African American High School Dropouts-General Population 25
Learning Disability-Prison Population 17
Caucasian High School Dropouts-Prison Population 31
African American High School Dropout-Prison Population 58
Source: California Prisoners and Parolees, 2009
SUCCESSFUL ALTERNATIVES TO 28
In the 1980s, the U.S. criminal justice policy changed, increasing the proportion of individuals to
serve prison time for more punitive crimes, such as low-level drug offenses. The increased sentencing
guidelines correlated with the rapid increase in the size of the prison population during the 1980s,
particularly for young, low-skilled male minorities.
Changes in the Criminal Justice System and the Effect on Incarceration Rates.
In 1980, the U.S. prison and jail system accommodated 500,000 individuals. In the 10 years
between 1990 and 2000, the state and federal prison population doubled. By 2008, the number of
incarcerated individuals had reached 2.3 million (Pew Charitable Trust, 2008) (Table 5 and Figure 7).
Total state spending on corrections is currently approximately $52 billion, the majority of which is spent
on prisons. State spending on prisons is 4 times higher than it was 20 years ago (Pew Center on the
States, 2011).
Currently, the impact of 25 years of tougher sentencing guidelines is being scrutinized, with
additional research being conducted to examine the inequality of the prison population, using lifetime
projected risk for imprisonment statistics of African American and Caucasian men, specifically
incarceration, education level, and race as determining variables. A combination of survey, census, and
administrative data shows that for men born between 1965 and 1969, 3% of Caucasians and 20% of
African Americans had served time in prison by the time they reached their early 30s. This study data
demonstrates that the risks of incarceration are highly influence by educational level. Of the African
American men born during this period, 30% of African American men with no education and close to
60% of high school dropouts were sentenced to prison by 1999 (Petit & Western, 2004).
SUCCESSFUL ALTERNATIVES TO 29
TABLE 5
U.S. Incarceration Rates: 1980 through 2009
Year Number Per 100,000 Year Number Per 100,000
1980 139 1995 411
1981 154 1996 427
1982 171 1997 444
1983 179 1998 461
1984 188 1999 476
1985 202 2000 478
1986 217 2001 470
1987 231 2002 476
1988 247 2003 482
1989 276 2004 486
1990 297 2005 491
1991 313 2006 501
1992 332 2007 506
1993 359 2008 504
1994 389 2009 502
FIGURE 7
Number of Incarcerated per 100,000
Source: Pew Charitable Trust, 2008
SUCCESSFUL ALTERNATIVES TO 30
California incarceration rates.
Of the 50 largest jail jurisdictions in the U.S., 9 are located in California (Minton, 2010). In a
2007 report to the governor of California, the Little Hoover Commission found that, “Despite the
rhetoric, 30 years of “tough on crime” politics have not made the state safer. Quite the opposite: today
thousands of hardened, violent offenders are released without regard to the danger they present to an
unsuspecting public…California’s parole system remains a billion dollar failure” (Gilroy et al., 2010).
The strict supervision requirements in the State of California are such that almost all individuals
released from prison are put on mandatory parole for 3 years. California currently has the second highest
number of released offenders returning to prison, at a rate of 40% (Pew Center on the States, 2011).
U.S. incarceration rates.
Currently, 1 out of every 100 U.S. adults resides in a U.S. jail or prison. Of these, 1 of every
30 incarcerated individuals is aged 20 to 34, and from this age group, 1 in 9 are African American men.
The number of incarcerated individuals in the U.S. increased in 2007; however, there was no
demonstrable decrease in overall crime or recidivism. Today, it is becoming apparent that it is not an
increase in the general population or an increase in crime that has caused the increase in the incarcerated
individuals. The increase in the population of individuals incarcerated is the direct result of the policy
choices aimed at cleaning up or getting tough on crime. Changes in public policy have resulted in stiffer
penalties for criminal behavior and have increased the period of incarceration.
These figures do not account for the larger number of individuals on probation or parole. These
individuals are convicted offenders that are not incarcerated, or on parole, which means they are under
community supervision subsequent to a period of incarceration; when these individuals are combined
with the individuals incarcerated, the total is more than 6.9 million adults under correctional supervision
in 2003. This comprises 3.2% of the U.S. adult population.
SUCCESSFUL ALTERNATIVES TO 31
The U.S. and the individual U.S. states are experiencing an increasingly debilitating fiscal crisis
for incarcerating non-violent, low-risk offenders. The cost of the court system, housing, medical
services, and rehabilitation programs have now resulted in some states examining their approach and
strategy for reducing recidivism and involving communities for support and supervision to allow the
lowest-risk offenders a second chance (Pew Charitable Trust, 2008). Exhibits 4 and 5 show the
U.S. prison population in 2001, 2007, and 2007, with the percentage of federal and state prison
populations.
International incarceration rates.
Russia, Belarus, and Bermuda have the second highest rates of incarceration following the U.S.,
with approximately 532 prisoners per 100,000 people. In comparison, Western European countries have
lower rates, France at 91, Germany at 96, and England and Wales at 142 per 100,000 people,
respectively. The non-Western European nations have rates of 29 in India, 118 in China, and 190 in
Cuba. Overall, more than three-fifths of the world’s countries have incarceration rates that are below
150 per 100,000 people.
Currently, more than 10.1 million people are held in penal institutions worldwide, generally as
sentence prisoners or pre-trial detainees/remand prisoners. The U.S. houses almost one-half of this total
(2,290,000), Russia (810,000), and China (1,650,000 sentenced prisoners). In addition, detention centers
in China house more than 650,000—including these brings the overall Chinese total to more than
2.3 million and the total worldwide to more than 10.75 million. These figures comprise the latest
information available as of May 2001; however, there are 7 countries that do not report their
incarceration numbers (Walmsley, 2011).
Comparison of U.S. incarceration rates to international incarceration rates.
While the U.S. currently has the highest incarceration rate in the world, with 726 per every
SUCCESSFUL ALTERNATIVES TO 32
100,000 people, a comparison of victimization rates shows the U.S. has rates similar to other countries,
and in some areas, U.S. citizens are at less risk of victimization than citizens in other countries. In other
words, the U.S. does not have significantly higher rates of victimization or crime, just higher rates of
incarceration than other nations. The U.S. murder rate is 4 times higher than most western European
nations, and while murder did increase through the 1970s and 1960s, that increased rate cannot account
for the increase in incarceration in the last 30 years (Table 6).
In the 16 years beginning 1980, crime increased only 12%, while incarceration increased 88%
due to sentencing and drug policy changes. These policy changes resulted in increased incarcerations as
well as increased incarceration periods of time. In the U.S., 41% of prisoners have sentences exceeding
10 years, while only 12% of prisoners in England and Wales are sentenced for more than 10 years or
more. In addition, 27% of U.S. drug offenders serve sentences in excess of 10 years, while in England
and Wales, only 6% of prisoners are sentenced to 10 years or more (Defending Justice, 2011).
Recent research in Australia indicates the following general statistics about Australia and its
recidivism rate. Approximately 2 in every 3 prisoners will be re-imprisoned. Within 3 months of being
released, approximately 1 of 4 prisoners will be reconvicted. Within 2 years of release, between 35 and
41% of prisoners will again be imprisoned. The Australian recidivism rates, regardless of the
measurement instrument, appear consistent over time (Australian Bureau of Statistics, 2007).
SUCCESSFUL ALTERNATIVES TO 33
TABLE 6
Entire World – Prison Population Totals
Rank-
ing Country
Prison
Popula-
tion
Rank
-ing Country
Prison
Popula-
tion
Rank-
ing Country
Prison
Popula-
tion
1 U.S. of America 2,292,133 74 Panama 12,293 146 Kosovo/Kosova c.1,450
2 China 1,650,000 75 Puerto Rico (USA) 12,130 147 Montenegro 1,438
3 Russian Federation 806,100 76 Serbia 12,000 148 Oman 1,403
4 Brazil 496,251 77 Honduras 11,846 149 Belize 1,396
5 India 384,753 78 Ecuador 11,800 150 Bahamas 1,322
6 Thailand 224,292 79 Malawi 11,672 151 Central African Republic 1,320
7 Mexico 222,330 80 Costa Rica 11,635 152 Slovenia 1,311
8 Iran 220,000 81 Greece 11,364 153 Reunion (France) 1,307
9 South Africa 159,265 82 Yemen 11,313 154 Cape Verde (Cabo Verde) c.1,300
10 Ukraine 154,027 83 United Arab Emirates 11,193 155 Fiji 1,150
11 Turkey 124,074 84 Cote d'Ivoire 11,143 156 Maldives 1,125
12 Indonesia 117,863 85 Guatemala 11,140 157 Bahrain 1,100
13 Vietnam 108,557 86 Turkmenistan 10,953 158 Bosnia and Herzegovina:
Republika Srpska
1,046
14 Philippines 104,710 87 Nepal 10,923 159 Congo (Brazzaville) c.1,000
15 Ethiopia c.85,450 88 Syria 10,599 160 Macau (China) 935
16 United Kingdom: England
& Wales
84,635 89 Belgium 10,561 161 Suriname 915
17 Colombia 84,444 90 Kyrgyzstan 10,163 162 Martinique (France) 914
18 Poland 83,476 91 Slovakia 10,031 163 Barbados 910
19 Pakistan 75,586 92 Hong Kong (China) 9,988 164 Cyprus (Republic of) 883
20 Japan 74,476 93 Burundi 9,844 165 Guadeloupe (France) 784
21 Spain 73,459 94 Tajikistan 9,317 166 Gambia 780
22 Bangladesh 69,650 95 Lithuania 9,139 167 Netherlands Antilles
(Netherlands)
713
23 Germany 69,385 96 Bulgaria 9,071 168 Luxembourg 706
24 Italy 67,615 97 Uruguay 8,783 169 French Guiana/Guyane
(France)
c.680
25 France 66,975 98 New Zealand 8,755 170 Djibouti c.600
26 Taiwan 64,420 99 Bolivia 8,700 171 Virgin Islands (USA) 587
27 Egypt 64,378 100 Austria 8,694 172 Malta 583
28 Rwanda c.62,000 101 Jordan c.8,500 173 Guam (USA) 559
29 Morocco 61,405 102 United Kingdom: Scotland 7,957 174 Qatar 551
30 Argentina 60,611 103 Senegal 7,550 175 St. Lucia 551
31 Myanmar (formerly
Burma)
60,053 104 Mongolia 7,265 176 Grenada 440
32 Algeria 58,000 105 Sweden 7,106 177 Seychelles 432
33 Kazakhstan 55,552 106 Latvia 7,055 178 St. Vincent and the
Grenadines
413
34 Chile 52,581 107 Niger c.7,000 179 French Polynesia (France) 404
35 Nigeria 50,000 108 Benin 6,908 180 Brunei Darussalam 379
36 Kenya 49,757 109 Nicaragua 6,803 181 New Caledonia (France) 326
37 Peru 48,045 110 Moldova (Republic of) 6,324 182 Sao Tome e Principe 305
38 Republic of (South)
Korea
45,681 111 Switzerland 6,181 183 Samoa (formerly Western
Samoa)
300
SUCCESSFUL ALTERNATIVES TO 34
TABLE 6
Entire World – Prison Population Totals
Rank-
ing Country
Prison
Popula-
tion
Rank
-ing Country
Prison
Popula-
tion
Rank-
ing Country
Prison
Popula-
tion
39 Saudi Arabia 44,600 112 Paraguay 6,146 184 Antigua and Barbuda 295
40 Venezuela 43,461 113 Haiti 5,331 185 Dominica 289
41 Uzbekistan c.42,000 114 Burkina Faso 5,238 186 Bermuda (United
Kingdom)
278
42 Canada 39,132 115 Botswana 5,216 187 Aruba (Netherlands) 277
43 Malaysia 38,387 116 Croatia 5,165 188 Solomon Islands 265
44 Tanzania 37,811 117 Lebanon 5,122 189 St. Kitts and Nevis 260
45 Belarus 36,533 118 Armenia 5,100 190 Timor-Leste (formerly East
Timor)
223
46 Iraq 31,645 119 Mali 5,041 191 Mayotte (France) 211
47 Tunisia 31,000 120 Jamaica 4,709 192 Cayman Islands (United
Kingdom)
198
48 Uganda 30,312 121 Albania 4,482 193 Greenland (Denmark) 194
49 Democratic Republic of
Congo (formerly Zaire)
c.30,000 122 Ireland, Republic of 4,433 194 Jersey (United Kingdom) 192
50 Australia 29,700 123 Papua New Guinea 4,268 195 Iceland 189
51 Romania 29,644 124 Namibia 4,251 196 Vanuatu 187
52 Sri Lanka 26,798 125 Kuwait 4,179 197 Tonga 159
53 El Salvador 24,283 126 Togo 4,116 198 American Samoa (USA) 132
54 Georgia 23,995 127 Denmark 4,091 199 Comoros c.130
55 Cameroon 23,368 128 Laos 4,020 200 Northern Mariana Islands
(USA)
124
56 Czech Republic 23,238 129 Norway 3,602 201 Virgin Islands (United
Kingdom)
117
57 Israel 22,725 130 Trinidad and Tobago 3,591 202 Kiribati 102
58 Dominican Republic 21,050 131 Chad 3,416 203 Micronesia, Federated
States of
100
59 Azerbaijan 20,470 132 Estonia 3,405 204 Isle of Man (United
Kingdom)
97
60 Sudan 19,144 133 Finland 3,189 205 Palau 79
61 Madagascar 18,647 134 Republic of Guinea 2,780 206 Guernsey (United
Kingdom)
69
62 Afghanistan 18,283 135 Gabon c.2,750 207 Andorra 61
63 Hungary 16,537 136 Swaziland 2,628 208 Anguilla (United Kingdom) 58
64 Angola 16,183 137 Lesotho 2,498 209 Gibraltar (United Kingdom) 50
65 Mozambique 16,000 138 Mauritius 2,354 210 Marshall Islands 43
66 Netherlands 15,604 139 Macedonia (former
Yugoslav Republic of)
2,329 211 Cook Islands (New
Zealand)
27
67 Zambia 15,544 140 Sierra Leone 2,237 212 Monaco 23
68 Zimbabwe c.15,000 141 Guyana 2,122 213 Nauru 20
69 Cambodia 14,043 142 Mauritania 1,700 214 Faeroe Islands (Denmark) 11
70 Ghana 13,573 143 United Kingdom: Northern
Ireland
1,692 215 Tuvalu 8
71 Libya 13,242 144 Bosnia and Herzegovina:
Federation
1,671 216 Liechtenstein 7
72 Singapore 12,978 145 Liberia 1,524 217 San Marino 2
73 Portugal 12,344
SUCCESSFUL ALTERNATIVES TO 35
Juvenile Crime.
Education and juvenile crime.
International evidence indicates that young people, particularly first-time offenders, tend to get
involved in a range of crimes rather than specializing in a certain type of crime. Research also shows
that young people that are involved in petty acts of delinquency (minor crimes) at a very young age will
likely continue committing crimes. The evidence also indicates that preventing youth violence at an
early age is critical, as it is increasingly difficult to intervene once a criminal activity pattern has started.
As a child gets older, the role of peers in discouraging or encouraging crime becomes more
important. International evidence indicates that young people who receive a higher amount and quality
of education and have greater academic success show a strong correlation about whether or not they
choose to commit crimes (Palmary & Moat, 2002).
Additional research shows that access to education, community, and social involvement, and
consistent, supportive parenting increase a young person’s resilience to crime. While local governments
are challenged to provide alternatives for at-risk youth, alternatives besides prison-based and law
enforcement options are being developed. A high quality education increases a child’s resilience to
criminality; thus, ensuring all youth access to high quality, consistent education is the responsibility of
the community as well as law enforcement (Palmary & Moat, 2002).
School dropout rates and juvenile crime.
While the correlation between criminal activity and low levels of education is clear, the
correlation between the high school dropout rate and criminal activity is profound. Graduating high
school by age 18 is associated with a 9% decrease in property crime, a 17% reduction in violent crime,
and a 10% decrease in crimes that are related to drugs. Statistics show that dropouts have double the
criminal activity as high school graduates. While high school dropouts comprise only 23% of the general
SUCCESSFUL ALTERNATIVES TO 36
population, this same population is responsible for 37% of juvenile crime. High school graduates
comprise 77% of the general population and are responsible for 63% of crime (Belfield & Levin, 2009).
Economic cost of school dropouts and crime.
One significant component of the fiscal and social costs of low education attainment is the higher
rate of criminal activity, for example, high school dropouts make up approximately two-thirds of all
prison inmates (Harlow, 2003).
Examining the significant losses resulting from juvenile crime, it is valuable to consider whether
educational reforms would be effective. While it is not easy to definitively determine the link between
education and juvenile crime, the review by Farrington and Welsh (2006) highlighted low attainment
and cognitive scores as key determinants of juvenile crime.
One key to offering a higher quality education and improving high school graduation rates is to
establish a social bond between student and school, which may result in reducing crime. Education is
psychologically linked to such variables as time preference and social control. Students that develop a
social bond with school show an increased commitment to their education, a perception of the value of
education, and higher acceptance of the authority of school. Physically attending school also affects the
ability and opportunity to commit crime, as these juveniles are physically located at school during the
time when they could be outside school and involved in criminal activities.
Recidivism
Definition.
Understanding recidivism is important in the context of this research because, for the majority of
low-level offenders who have no options for producing income outside crime, incarceration is the
beginning of the cycle of recidivism the moment they enter the prison system. Recidivism derives from
the Latin word recidivus, which means falling back. In terms of the criminal justice system, recidivism
SUCCESSFUL ALTERNATIVES TO 37
involves committing a crime in spite of being previously punished for committing a crime. For parolees
and probationers, recidivism also extends to a technical violation of supervision, i.e., failing a drug test,
or not reporting to a parole or probation officer (Pew Center on the States, 2011).
San Francisco Recidivism Rates.
The California Department of Corrections (CDCR) cites that of the more than 2,500 felons
paroled in San Francisco in 2003, 59% of felons were again incarcerated within 3 years of their release
from prison (California Reentry Program, 2011) (Table 7). This may be due in part to San Francisco
receiving more re-released inmates than those that were released to begin with (CDCR, 2009).
California Recidivism Rates.
The California Department of Corrections and Rehabilitation studied inmates released from state
prisons between the years of 2005 and 2006 for 3 years. This study found that in San Francisco, 78.3%
of offenders were returned to prison within 3 years of their release (CDCR, 2009).
During calendar year 2009, 85,360 of the arrivals in California state prisons were parole returns,
including 66,185 felon parole violators returned to custody (including those pending revocation hearings
and psychiatric returns) for violating a condition of parole; 18,594 felon parole violators returned with a
new term; 581 were returning civil narcotic addict outpatients; and 122 were returned from other
jurisdictions (California Prisoners and Parolees, 2009).
Currently, California has a prison population of approximately 168,000, with 112,500 parolees
released from prison and living outside prison. In 2007, 92,000 parolees returned to prison as the result
of the commission of additional post-release crimes.
While these California state parolees are intended to be the beneficiaries of specific reentry
assistance programs, oftentimes they cannot access these programs immediately upon their release,
leaving these individuals with no additional options or resources than they had when they were first
SUCCESSFUL ALTERNATIVES TO 38
incarcerated. This lag in reentry services results in individuals with no additional survival skills or
means of survival than they possessed prior to incarceration. Lack of immediate support and inadequate
dissemination of information result in some parolees unable to ever access the assistance required to
remain outside incarceration.
Although the CDCR offers several reentry programs, the programs reach only a small percentage
of parolees and are not comprehensive enough to meet the needs of the individuals they are intended to
serve. Case managers are unavailable to assist on an individual basis with reentry needs—this combined
with the lack of personal case management, a lag time for services to be offered, and the lack of
availability to access information—results in the typical incarcerated individual attempting to reenter life
outside prison confronted with significant life challenges without the appropriate tools (California Reentry
Program, 2011).
As shown in Figure 8, the recidivism rate is high during the within 1- and 2-year follow-up periods
for felons paroled to California supervision within the California Department of Corrections and
Rehabilitation first paroled to parole in 2006 by principal commitment offense (California Prisoners and
Parolees, 2009).
SUCCESSFUL ALTERNATIVES TO 39
TABLE 7
Recidivism Rates Within 1- and 2-Year
Follow-up Periods for Felons Paroled to California Supervision
Source: California Prisoners and Parolees, 2009
SUCCESSFUL ALTERNATIVES TO 40
U.S. Recidivism Rates.
In 2004, the Reentry Policy Council, Council of State Governments estimated that, on a national
level, of the more than 7.5 million people released from incarceration, more than 50% would be
rearrested within 3 years of their release (Office of Justice Programs and Reentry Council, 2011).
Figure 8 shows a table listing state prison releases and recidivism rates for each state in the U.S.
and the proportion of released offenders returning to incarceration for committing either a technical
violation or a new crime, in addition to individuals who did not return within 3 years.
SUCCESSFUL ALTERNATIVES TO 41
FIGURE 8
The Cycle of Prison Release
SUCCESSFUL ALTERNATIVES TO 42
International Recidivism Rates.
Tracking international recidivism rates is difficult, as the definition of recidivism does not
account for parole violations, rearrests, or reconvictions. Not all reoffenders are arrested, not all guilty
are caught and tried, and not all arrests involve an outcome of guilty and sentencing. Additionally,
different countries or regions measure data during different time periods, for varying demographics,
which makes precise side-by-side comparisons difficult.
Comparison of U.S. Recidivism Rates to International Recidivism Rates.
Table 8 shows a snapshot of recidivism using data from the City of San Francisco, the State of
California, U.S., Canada, Australia, and United Kingdom (CDCR, 2011; New World Encyclopedia,
2011; U.S. Bureau of Justice, 2011; and Whitehead, 2010).
SUCCESSFUL ALTERNATIVES TO 43
TABLE 8
Comparison of Recidivism Rates
Location and
Study Year
Total Number
Tracked
Number
of States
Rearrested
Within 3 Years
Percent
Reconvicted
During the
3-year Time
Frame
Percent Returned
to Prison
San Francisco, California1
2011 78.30%
California1
2005-2006 108,000 67.50%
U.S.2
1983 108,580 11 62.50% 47
1994 272,111 15 67.50% 47
California
2005-2006 108,000 67.50%
Canada2
Rearrested Within 2 Years
1994-1995 46.00%
1996-1997 44.00%
Australia3
Rearrested Within 2 Years Males Females
1990-1991 35-38% 35% 38%
UK4
Rearrested Within 10 Years
January-March 2000 74%
Sources:
1
CDCR, 2011
2
U.S. Bureau of Justice, 2011
3
New World Encyclopedia, 2011
4
Whitehead, 2010
SUCCESSFUL ALTERNATIVES TO 44
Linking Crime/Incarceration and Education.
Linking Education and incarceration in San Francisco and the State of California.
The number of students enrolled in California’s public high school system comprises 13% of the
nation’s total public high school enrollment. Given the size of the state’s dropout population, California
would benefit tremendously from improving its high school graduation rates. Based on the state’s
reported number of dropouts in 2007-2008, we can infer that approximately 98,420 new dropouts enter
California’s labor market each year. Permanently reducing the dropout rate by one-half for each new
graduating class of high school students would yield more than $1.4 billion in direct gross economic
benefits to the state through direct tax revenue. This $1.4 billion does not account for the money saved
by California by not incarcerating individuals. Completely eliminating the dropout problem would save
the state $2.8 billion annually, or approximately 14% of its present budget deficit, a significant
economic opportunity for California (Stuit & Springer, 2010).
Linking education and incarceration in the U.S.
The differences in schooling explain at least part of the 23% gap between Caucasian and African
American incarceration rates. It is not difficult to conclude that many African Americans who live in
impoverished areas do not receive the same quality of education that they would if they lived in school
districts with better schools. Given the 23% gap, it appears it would be possible to reduce crime rates by
improving the quality and level of education of potential offenders. The following reasons may explain
why education has a positive effect on crime—schooling increases the opportunity costs of illegal
behavior because it increases the returns gained from legitimate work; education may affect the
preferences for behavior to commit crimes because the punishment usually entails incarceration; and
education may decrease some of the psychological rewards of the individual acts of crime, which could
lead to significant reductions in incarcerations correlating to an increase in educational level (Lochner &
SUCCESSFUL ALTERNATIVES TO 45
Moretti, 2002). Obtaining a high school diploma or equivalent may decrease an individual’s perception
that they need to commit a crime (Alliance for Excellent Education, 2006).
Following are the reasons Lochner and Moretti (2002) indicated for their theories that an
increase in an individual’s educational attainment could cause a decrease in his subsequent probability
of engaging in a crime.
1. Schooling increases potential income rates, which also increases the opportunity costs
of crime.
2. Educated individuals tend to suffer greater punishment resulting from criminal activity.
3. Schooling has the potential to change the individual rates of time preference or risk aversion,
which means schooling may increase an individual’s patience or risk aversion, i.e., more
patient risk-averse individuals would be more influenced by the potential for future
punishments.
4. Schooling may affect individual desires to commit crime by directly impacting the psychic
costs of breaking the law.
5. The act of committing a crime may be influenced by the commission of crimes in the past.
Literacy rates.
In 2003, approximately 1.4 million adults were incarcerated in state or federal prisons. This
represents 1.5 million more than were incarcerated in prisons 10 years earlier, which comprises a 55%
increase. Only 43% of prison inmates entered prison with a high school diploma or a GED/high school
equivalency certificate (Greenberg et al., 2011); 68% of state prison inmates did not receive a high
school diploma; and approximately 26% of state prison inmates completed their GED while serving time
in a correctional facility (Harlow, 2003).
SUCCESSFUL ALTERNATIVES TO 46
There has been a rapid increase in the growth of the incarcerated population since the early
1980s. In 2002, the total incarcerated population exceeded 2 million people for the first time. Males of
minority status, particularly young African American males, have been disproportionately affected by
tougher anticrime measures. Today, almost 10% of young African American males between the ages of
18 and 24 is now incarcerated, with estimates that more than 33% of all African American male high
school dropouts from the ages of 20 to 35 were in prison on an average day in the late 1990s—which is a
higher proportion than those individuals in paid employment (Pettit & Western, 2000).
It is undeniable that the negative causal relationship between education and crime is high and the
educational attainment levels of prisoners are greatly decreased from those of the non-incarcerated
public (Lochner & Moretti, 2004). In addition, 56% of the incarcerated high school completion category
comes through completion of a GED, in other words, certification of a graduation equivalent but not an
actual high school education.
Linking Recidivism and Education.
The average inmate has not attended school beyond the tenth grade and is typically from an
educationally and culturally deprived environment. Statistics show that attendance is increasing,
however, the academic achievement has stayed the same, just below the seventh grade level. This lack
of performance appears to be partially due to at least 50% of inmates having a specific learning
disability, typically associated with auditory or visual perception. Of the total prison population, 70% of
inmates have never had any formal trade, skill, or profession training or preparation. The percentage of
inmates with no work experience history prior to incarceration was also 70% (Bell, 2011).
The correlation between criminal activity and low levels of education shows that the high school
dropout is 5 to 8 times more likely to be incarcerated than an individual that has graduated from college.
For incarcerated individuals that choose to attend school while incarcerated, a study conducted in 3
SUCCESSFUL ALTERNATIVES TO 47
states indicated that attending school while in prison was associated with only a 29% chance of being
incarcerated again. Regardless of whether or not inmates found a job following release from prison, the
rates for recidivism remained the same for those who sought and obtained additional education while
behind bars. An education, in and of itself, has high value, even if it does not directly result in
employment. California has a 96% recidivism rate, in other words, all except 4 of every 100 inmates
released returns to prison or jail within 3 years. This is one of the highest rates in the U.S. and has
resulted in increased overcrowding in the justice system and facilities (Darche et al., 2009).
Additional Consequences for Incarcerated Individuals Re-entering the Public Community.
Two-thirds of all offenders will reoffend and return to prison/jail within 3 years (Langan &
Levin, 2002). During the time period in which the incarceration rates in the U.S. have reached
unparalleled levels, there has been a dramatic increase in the state, municipal, and federal legal barriers,
increasing the challenges faced by individuals as they complete their sentences, move into the public
community, and seek housing and employment. One of the strongest indicators of repeat offenses is the
lack of a stable employment and living situation (Periman, 2011). Low levels of education and very little
prior work experience make these individuals difficult to employ. A critical success factor for released
offenders is their ability to obtain legitimate employment as soon as possible after release (Redcross et
al., 2009).
At this time, legislation in certain states has been enacted to make drug offenders ineligible for
drivers’ licenses, certain federal health care benefits, federal educational aid, and residency in public
housing. This inability of convicted individuals to work in specific fields, and obtain certain benefits or
even a driver’s license is considered a collateral disability. These collateral disabilities greatly determine
the future of released incarcerated individuals. As a result, the Uniform Collateral Consequences Act has
been developed to assist states in altering the due process issues associated with hidden collateral
SUCCESSFUL ALTERNATIVES TO 48
consequences, which could result in recidivism by limiting or eliminating the barriers to safe housing,
education, and productive employment. The Uniform Collateral Consequences Act is the product of the
National Conference of Commissioners on Uniform State Laws (NCCUSL). The NCCUSL was
established in 1892, as a confederation of state representatives specifically to improve state law and
promote uniformity of legislation in areas of national importance. The NCCUSL was developed as part
of an 1889 resolution by the American Bar Association, which recommended individual states appoint
commissioners to meet with representatives from other states to develop uniform state laws. By 1912,
each state was sending commissioners to an annual meeting (Periman, 2011).
U.S. Federal Interagency Reentry Council working to change reentry consequences.
The U.S. Federal Interagency Reentry Council was formed in 2011 by U.S. Attorney General
Eric Holden. The mission and goals of the U.S. Federal Interagency Reentry Council are to work with
federal partners to examine barriers to successful reentry. The U.S. Attorney General is encouraging
each individual U.S. state’s Attorney General to review the collateral consequences of incarceration in
their states and eliminate the laws that impose burdens on former offenders. Again, the policies and
penalties vary from state to state and individual states are recognizing the need to end the revolving door
of incarceration in the U.S. prison and jail system. Successful reentry is the best solution to productively
integrating ex-offenders back into the community, which involves assisting reentering individuals to
become productive in their communities (Office of Justice Programs and Reentry Council, 2011).
However, since 1994, when the Violent Crime Control and Law Enforcement Act eliminated the use of
Pell Grants for prisoners, the college enrollment of prisoners has decreased dramatically, and
reintroduction of free higher education in the prison system has fallen to individuals and individual
educational institutions. Since 1994, approximately 350 programs throughout the U.S. were shut down
due to lack of funding. Although prison education has rebounded since it declined following the 1994
SUCCESSFUL ALTERNATIVES TO 49
decision by the U.S. Congress to set limits on educational assistance, the majority of the prison
population enrolled in postsecondary programs is vocational, as opposed to solely academic studies
(Inside Higher Ed, 2007).
The Urban Institute Justice Policy Center recognized the importance of employment education,
including the following potential steps: enrolling eligible exiting prisoners in work release programs
prior to release; providing prerelease employment readiness training; providing appropriate workforce
development agency referrals; providing prerelease education services; offering referrals to education
institutions; and conducting prerelease education and employment skills and needs assessments
(La Vigne & Halberstadt, 2010).
Linking the educational component of the BOT Reentry Program to break the cycle of crime.
The education component of the BOT program is critical to its success, as research consistently
shows literacy levels among the U.S. prison population are generally lower than among the general
population (Alteneder, 2007). In addition to U.S. Census Bureau statistics showing that prisoners are
more likely to have GEDs than high school diplomas and have an overall lower level of educational
attainment than the general population, research also indicates that prisoners have lower levels of
education attainment than economically disadvantaged household populations (Ewert & Wildhagen,
2011). (The U.S. Census Bureau counts incarcerated individuals as residing in their “usual residence”
and at the time of the Census taking, if that individual is incarcerated, their place of residence is as a
resident of the institution in which they are housed [Census Advisory Committee, 2004]).
Within the prison system, receiving a higher quality education is increasingly the focus, a
reflection of the significance of the correlation between education level and incarceration. Focusing the
attention on prison education programs is significant because attaining a higher level of education may
predict an array of outcomes for individuals, including employment, health, income, and political
SUCCESSFUL ALTERNATIVES TO 50
participation. A higher education level is also associated with a decrease in the potential to apply for
public assistance. Unequal outcome in education not only affects the socioeconomic outcomes of the
U.S. in direct costs of incarceration, it prevents the potential for individuals to contribute back into the
economic system in a beneficial way to the socioeconomic status of society. In addition, since the
strongest predictor of whether a given individual will attend college is determined by whether that
individual’s parents attended college, an incarcerated person who has received a college education,
regardless of the eventual outcome of release, has children that are more likely to pursue their own
educations (Education Justice Project, 2011).
Linking the educational component of the California Prison System Reentry Program to break
the cycle of crime.
In 2003, the California Reentry Program was started with one San Quentin prisoner interested in
continuing his education after release and while on parole from San Quentin. This individual’s request
resulted in a reevaluation of the lack of systematic delivery of information regarding opportunities and
services in local communities to prisoners prior to release from incarceration. Currently, the program
counts 25 volunteers and serves 150 to 200 prisoners per month
(http://www.newworldencyclopedia.org/entry/Recidivism).
Linking the educational component and the prison reentry programs outside the State of
California prison system to break the cycle of crime.
The widespread acceptance and normalcy of imprisoning young, poorly educated African
American men by the punitive criminal justice polices of the 1980s resulted in few economic
opportunities in impoverished urban neighborhoods. The impact of returning more than 700,000
prisoners to inner-city areas with concentrated poverty, high unemployment, lack of social services, and
disintegration of quality of life can be significantly shifted, depending on the quality of the population
SUCCESSFUL ALTERNATIVES TO 51
returning to the community. Typically, former prisoners are unequipped to lead productive, crime-free
lives. This mass incarceration does nothing to improve public safety in the long term, as improving
economic opportunity is critical to reducing crime. However, spending on prisons has increased from
$19,000,000 in 1982 (in 2007 dollars) to $70,000,000 in 2005.
In 2008, the U.S. Sentencing Commission began seriously considering alternatives to prison for
certain offenders. These alternatives included employment training for minor parole violators. This shift
in thinking from incarceration to education marks a significant course correction for lawmakers who
now recognize that mandatory sentences imprisoning first-time offenders disproportionately impacts
minorities (Fears, 2008).
SUCCESSFUL ALTERNATIVES TO 52
FIGURE 9
Prison Count 1987-2007
FIGURE 10
Prison Costs 1987-2007
SUCCESSFUL ALTERNATIVES TO 53
FIGURE 11
State Spending on Corrections
FIGURE 12
State Spending on Higher Education
SUCCESSFUL ALTERNATIVES TO 54
Sample U.S. Educational Programs and Early Results.
Following are additional institutions and brief descriptions of education programs for reentry and
education programs outside California.
Texas: An innovative program in the State of Texas, which has one of the highest incarceration
rates in the world, offenders may be put on probation and sentenced to read through the rehabilitation
program Changing Lives Through Literature (CLTL). The CLTL program involves reading specific
books and attending a reading group, along with the other specific probation requirements. This program
currently shows only a 6% recidivism rate of individuals having their probation revoked and being
sentenced. The average cost to incarcerate an individual in Texas is $30,000 per year, the cost to enroll
an individual in the CLTL program is $500 (Barker, 2010).
Bard Prison Initiative (New York): The Bard Prison Initiative is the largest program of its type
in the U.S., with 250 enrolled incarcerated men and women. From its start in 1999, Bard has granted
157 degrees to participants and enrolled a total of nearly 500 students. The graduates of the Bard
program have shown consistent success following their release from prison, choosing a broad range of
professions and working toward additional academic and professional degrees. Citing the statistic that
the U.S. has the longest, most punitive sentencing structures in the world, 750,000 inmates are released
each year and nationwide, out of every 100 prisoners, almost 68 are rearrested within 3 years of release,
more than half return to prison. Research indicates that the rate of recidivism falls to less than 22% if
prisons offer significant educational opportunity to incarcerated men and women. Fewer than 2% of
formally incarcerated Bard students have returned to prison and the estimated cost per person, per year
of the BPI program is a small percent of the cost of continuing incarceration (Bard Prison Initiative,
2011).
SUCCESSFUL ALTERNATIVES TO 55
Cornell Prison Education Program (New York). This prison education program was
established to provide college courses to inmates at a medium- and maximum-security prison in New
York. The program involves Cornell faculty and students in educating the country’s increasing
incarcerated population. The Cornell Prison Education Program is committed to supporting incarcerated
persons’ preparation for successful reentry and academic ambitions (Cornell Prison Education
Program, 2011).
In the New Bedford Court program, 10 consecutive CLTL educational seminars were evaluated
from the first seminar offered in April 1991 through January 1, 1996. This analysis focused on the
number of crimes committed by those who completed the program compared to the number of crimes
committed by those who did not complete the program. The results indicated an overall 68% decrease in
criminal activity between individuals who completed the program and those that did not complete the
program (Ste. Pierre, 1996).
Other institutions with similar programs include the Bedford Hills College Program in New
York, which has graduated 100 students; Ball State, Indiana; The Alabama Prison Arts & Education
Project; Georgetown Prison Outreach; Inside-Out Prison Exchange Program at Temple University,
Pennsylvania, Indiana; Wesleyan Center for Prison Education; Vassar; Patten University; Columbia;
Cornell; Wesleyan; Education Justice Project in Illinois; Lansing Correctional Facility Program, Kansas;
and the Prison Studies Project in Massachusetts. The goal of the Prison University Program is to move
public policy toward the priority of making increased educational opportunities a priority for individuals
with criminal records (Vitale, 2011).
SUCCESSFUL ALTERNATIVES TO 56
Linking the educational component and prison reentry programs outside the U.S. prison
system to break the cycle of crime.
New Zealand: New Zealand allows offenders, victims, and community representatives to come
to terms with the crime and create an action plan for the offender to make amends to the victim and
community. In New Zealand, this results in less than 10% of offenders being referred back to the court
for not complying with the action plan. In 2002, this innovative system was recognized for “reducing
recidivism rates while retaining public confidence” and won an International Community Justice Award.
Cuba: The Cuban government emphasizes rehabilitation and return to the community more than
societal isolation or punishment. In Cuba, prisoners earn a comparable income to that of a free person in
the same job, and prisoners are permitted to wear street clothes. In addition, some prisoners are allowed
to work in a conditional release program midway through their sentence (sentences less than 5 years),
and they work in factories or on farms without divulging their status. In this way, prisoners can visit
their families in their homes with no supervision, 2 times a month for up to 3 days per visit. The
recidivism for this type of program in Cuba is about 15%.
If the Cuban approach were used in the U.S., individuals could be electronically monitored for
$10,000 each per year outside prison (compared to the higher yearly cost to house a prisoner) i.e.,
Missouri has 14,700 nonviolent offenders incarcerated at a cost of more than $16,400 each per year.
Nearly 60% of nonviolent offenders are back in prison after 5 years (Vitale, 2011). The average cost
across the U.S. to incarcerate an individual for 1 year is $28,817. Some states are much higher, for
example the average cost to incarcerate in California is $44,563 per person per year (Skolnick, 2011).
SUCCESSFUL ALTERNATIVES TO 57
Great Britain: On July 31, 2006, Great Britain introduced the Offenders’ Learning and Skills
Service (OLASS), having completed a 1-year trial in 3 development regions. The OLASS program seeks
to integrate the Learning and Skills Council and the National Probation Service to address the
educational needs of offenders. The program focuses on improving the educational level and the
employability of young offenders. The term employability encompasses not just employment but
additional work characteristics such as working as a team member, using good communication skills,
being self motivated, and having tolerance for others (The Prince’s Trust, 2007).
The Prince’s Trust report estimates that, based on the efforts of other countries, one can estimate
that encouraging social development of children and families can decrease crime and for every $1.00
spent, results in returns of $7.16. To effect a change and decrease crime by 10%, $228.00 additional tax
dollars per family would need to be spent on incarceration compared to just a $32.00 dollar increase to
help at-risk children complete school (http://www.newworldencyclopedia.org/entry/Recidivism).
SUCCESSFUL ALTERNATIVES TO 58
Findings
Research Purpose
The purpose of the research was to demonstrate the decreased costs to the government of
alternatives to incarceration (total cost per individual versus total cost of incarceration), and quantify the
additional benefits the program components offer in assisting individuals to maintain successful crime-
free lives—investigating the correlation between education/literacy and the general prison population
and identifying some non-financial additional successes of similar programs throughout the U.S. for
individuals prior to incarceration and for individuals who are incarcerated—i.e., secondary successes
derived from gaining literacy and the opportunities realized from workforce development education,
which sustains a significant decrease in recidivism. This data was developed using the following
existing research for prison education programs within and outside the U.S. to demonstrate the
correlation between the decreasing return on investment of continuing to fund the prison system at the
expense of funding education. The BOT program uses an intelligent approach to crime, using
interventions that benefit the community, victims, and offenders.
1. Statistical data analysis from the City of SFDA’s office from the BOT program’s initial
startup in 2005 until the recent graduation in July 2011 to quantify the numbers of successful
participants of the current BOT program.
2. Statistical data analysis on crime and educational level in California and the U.S. using the
2010 Census and additional data, for the 5-year period of time during which the BOT
program has been operational. This data is necessary to support the hypothesis that a
correlation between crime and education exists.
3. Statistical data analysis on the educational level of incarcerated individuals in California and
the U.S. using available publications and information, for the 5-year period of time during
SUCCESSFUL ALTERNATIVES TO 59
which this program has been operational. This data is necessary to support the hypothesis
that a correlation between crime and education exists.
4. Statistical data analysis on the educational programs being offered in the California prison
system for successful reentry of prisoners.
5. Statistical data analysis on educational and reentry programs being offered in states outside
the California prison system for successful reentry of prisoners.
6. Statistical data analysis on educational and reentry programs being offered outside the U.S.
to allow successful reentry of prisoners in other countries.
Incarceration and Recidivism.
For the purposes of this research project, incarceration includes individuals imprisoned in both
jails and prisons. In terms of the criminal justice system, recidivism involves committing a crime in spite
of being previously punished for committing a crime. For parolees and probationers, recidivism also
extends to a technical violation of supervision, i.e., failing a drug test, or not reporting to a parole or
probation officer (Pew Center on the States, 2011).
Linking Crime/Incarceration and Education.
It is undeniable that the negative causal relationship between education and crime is high and the
educational attainment levels of prisoners are greatly decreased from those of the non-incarcerated
public (Lochner & Moretti, 2004). In addition, 56% of the incarcerated high school completion category
comes through completion of a GED, in other words, certification of a graduation equivalent, but not an
actual high school education.
Linking Recidivism and Education.
The average inmate has not attended school beyond the tenth grade and is typically from an
educationally and culturally deprived environment. The correlation between criminal activity and low
SUCCESSFUL ALTERNATIVES TO 60
levels of education shows that the high school dropout is 5 to 8 times more likely to be incarcerated than
an individual that has graduated from college.
SUCCESSFUL ALTERNATIVES TO 61
Conclusions and Recommendations
The tougher legislation enacted in the 1980s, adopted to protect public safety, has succeeded in
increasing incarceration of low-level offenders but not necessarily increasing public safety. These
legislative measures, which involve increased prosecution, longer prison sentences, and stiffer
punishment for parole and probation violations have resulted in a prison population that has tripled in
the last 30 years.
Because the data from the last 30 years indicates that the strict legal initiatives resulted in tripling
the incarceration rate, we can then infer that approximately two-thirds of the individuals in incarceration
during the time frame in 2011 were low-level offenders, prosecuted and sentenced due to tougher
sentencing guidelines. In other words, 30 years ago, given the same circumstances, 1.5 million currently
incarcerated individuals would not or may not have been imprisoned. The amplified spending and
expenditures of incarceration are increasingly impacting U.S. state spending, including education.
Additional research is being conducted to examine using justice reinvestment instead of incarceration,
and reduction in penalties using a broad range of approaches.
The current incarceration growth does not correlate to an increase in crime, or even an increase
in the overall population. If the “tough on crime” initiatives resulted in tripling the incarceration rate, we
can infer that approximately two-thirds of the individuals incarcerated (1.5 million) during the 2008 time
frame were low-level offenders, prosecuted and sentenced due to tougher sentencing guidelines and
imprisoned as additional punishment for parole or probation violations. Continued reliance on
incarceration is resulting in decreased benefits in crime prevention and no increase in public safety.
Reinvestment in justice for low-level offenders is a process designed to help municipalities make
informed decisions about how their scarce criminal justice resources are used. Solid choices about
incarceration versus reinvestment must be based on data collection and analysis of what contributes to
SUCCESSFUL ALTERNATIVES TO 62
criminal justice costs—what comprises the prison population, length of stays, recidivism, and biggest
expenditures. Individual states can begin to identify the highest threats to public safety and ensure
adequate incarceration space for those individuals posing the greatest public threat; the contributing
factors will differ by jurisdiction depending on local populations and sentencing policies. By prioritizing
incarceration space, individuals that are not a public safety threat can be diverted from incarceration into
other programs. The cost of incarceration is so high, that almost any alternative will be less expensive.
Saving money and maintaining public safety should drive the decisions regarding who is and who is not
incarcerated. By diverting the money from prosecuting, sentencing, and incarcerating, justice
reinvestment allows more cost-effective criminal justice policy decisions and expenditures.
Instead of increasing expenditures in incarceration, government officials are questioning whether
incarceration is the most beneficial, cost-effective use of resources, locally and on a state-wide level
(LaVigne, 2011).
Statistical Analysis
Using statistical analysis, Tables 9 through 11 show the calculations for the current cost of
incarceration and the potential savings for the U.S. overall. The graphs demonstrate the percent of
incarceration expense currently being used to house low-level offenders of non-violent crimes who
would be eligible for potential alternative options to incarceration. Figures 12 through 14 present a
graphic representation of the potential savings of costs for incarceration and the number of individuals,
given an alternative option to imprisonment.
SUCCESSFUL ALTERNATIVES TO 63
Table 9
Incarceration Data
Percent of Low-
Level Offenders
Total Potentially Not
Incarcerated
Total Remaining
Incarcerated
No. Incarcerated 2,300,000 0.66 1,518,000 0.33 759,000.00
Potential Cost Savings of
Not Incarcerated
Incarceration Cost
Cost to Incarcerate $49,000,000,000.00 0.66 $32,340,000,000.00 0.33 $16,170,000,000.00
Cost for Justice
Reinvestment $5,000.00 1,500,000.00 $7,500,000,000.00
$24,840,000,000.00
2,300,000.00 66 1,518,000.00 33 759,000.00
48,000,000,000.00 66 32,340,000,000.00 33 16,170,000,000.00
5,000.00 1,500,000.00 7,500,000,000.00
Table 10
Statistical Analysis
Point 2,300,000 Rank Percent Point 66 Rank Percent Point 151800 Rank Percent
1 49,000,000,000.00 1 100.00% 2 1,500,000.00 1 100.00% 1 32,340,000,000.00 1 100.00%
2 5,000.00 2 0.00% 1 66.00 2 0.00% 2 7,500,000,000.00 2 0.00%
SUCCESSFUL ALTERNATIVES TO 64
FIGURE 13
Total Number Incarcerated
1,518,000
759,000.00
Total Incarcerated 2,300,000
Total potentially not 
incarcerated 
Total remaining 
incarcerated
FIGURE 14
Total Cost of Incarceration
g
32,340M 
16,170M 
Total Cost of Incarceration 
$49,000,000,000
Revised potential cost to incarcerate: $16,170M
Potential cost savings: $32,340M
SUCCESSFUL ALTERNATIVES TO 65
TABLE 11
Statistical Analysis
Bin Frequency Cumulative % Bin Frequency Cumulative %
66 0 0.00% 1500000 1 50.00%
66 0 0.00% More 1 100.00%
1500000 1 50.00% 66 0 100.00%
1518000 0 50.00% 66 0 100.00%
7500000000 0 50.00% 1518000 0 100.00%
32340000000 0 50.00% 7500000000 0 100.00%
More 1 100.00% 32340000000 0 100.00%
y
FIGURE 15
Graphical Analysis
0.00%
50.00%
100.00%
150.00%
0
0.5
1
1.5
1500000
More
66
66
1518000
750000…
323400…
Frequency
Bin
Histogram
Frequency
Cumulative %
SUCCESSFUL ALTERNATIVES TO 66
Long-Term Economic and Public Safety Impacts of Incarceration
Developing a national prisoner reentry (justice reinvestment) program recognizes that public
safety is threatened by mass incarceration because it diminishes life-long opportunities by adding a
criminal record, further penalizing individuals with no work skills or resources. Justice reinvestment
would focus on increasing employment for released prisoners at the same time prison populations are
being reduced. Increasing employment promotes long-term negative consequences of criminal
punishment and promotes greater economic improvement for poor communities (Western, 2008).
Research findings indicate that, in addition to direct costs on the economic system, incarcerated
individuals impose additional financial hardships on the overall U.S. economic system, as they are less
likely to pay child support, taxes, and victim restitution.
Impacts of incarceration on children.
State prisoners with children under age 18 is at 55%, and 63% of federal prisoners are parents of
children under age 18. In addition to the day-to-day void created by an unavailable parent, children may
face increased social obstacles. Parental incarceration creates additional challenges for children and
families such as material hardship and financial instability, unstable family structure and relationships,
school performance and behavior problems, and in some cases, isolation, stigma, and shame (Annie E.
Casey Foundation, 2011).
With the average high school graduation level of incarcerated individuals at less than 60%, low-
level offenders are even less likely to attain an education greater than high school. Research shows that
individuals with parents with no college experience are less likely to go to college, particularly a 4-year
college or university, than their peers. The National Education Longitudinal Study shows that 85% of
students whose parents had college degrees enrolled in post-secondary education the year after
graduating from high school, as opposed to 47% of students whose parents did not attend college (Engle,
SUCCESSFUL ALTERNATIVES TO 67
2011).
Recommendations for Future Research
Quantifying the potential financial savings of justice reinvestment alternatives to incarceration is
a simple exercise in arithmetic. Quantifying the cost in terms of social return on investment by
investigating the secondary benefits is more difficult, as terms such as “quality of life” are difficult to
standardize and quantify. One recommendation for additional study might be to follow and observe a
group of BOT participants who enroll in the BOT program and remain enrolled in the program through
graduation compared to a group of participants who either chose not to enroll in the BOT program and
were incarcerated or failed the BOT program and were subsequently incarcerated. Identifying the life
challenges and the lives of these individuals holistically, in terms of their communities, families, and
potential future opportunities would be a viable option for justifying and promoting future justice
reinvestment programs.
Additional research could also be conducted showing the overall economic payback to the U.S.
tax system for individuals that work legally, pay income taxes, and do not file for public assistance for
food, housing, and medical needs. This research would further demonstrate the ratio of lifetime
contribution into the state and federal tax system, versus direct cost to incarcerate and additional public
assistance needed for individuals who are continuously incarcerated over their lifetime and the economic
toll those individuals and their families take on the U.S. economic system.
In reviewing the international statistics, the rate of recidivism in Australia is significantly lower
than comparable countries and drastically lower than the U.S. Additional research could be conducted to
determine the differences in treatment and opportunities for offenders in Australia and the U.S. to
identify the factors leading to successful transition out of the prison system into society in Australia.
This research adequately demonstrated the decreased costs to the government of incarceration
SUCCESSFUL ALTERNATIVES TO 68
(total cost per individual for justice reinvestment versus total cost of incarceration) and quantified the
additional benefits that program components from programs such as Back on Track offer in assisting
individuals to maintain successful crime-free lives. By investigating the correlation between
education/literacy and the general prison population, a clear link between education level and potential
to commit low-level crime was established. Showing the comparison of the U.S. data and justice
practices with other countries, demonstrates that the high incarceration rate in the U.S. is not typical of
any other country and the crime rate in the U.S. does not correspond to its high incarceration rates. This
data shows that approaches used in other countries, such as coordinating efforts with offender services
such as health and housing and community organizations, coupled with reducing prison admissions and
lengths of incarceration by offering reinvestment in justice, is more financial beneficial and increases
public safety.
FINALBOTDRAFT28
FINALBOTDRAFT28
FINALBOTDRAFT28
FINALBOTDRAFT28
FINALBOTDRAFT28
FINALBOTDRAFT28
FINALBOTDRAFT28

More Related Content

Similar to FINALBOTDRAFT28

Final thesis!!
Final thesis!!Final thesis!!
Final thesis!!
Greg Keogh
 
Review each team members selected case study for the Criminal Jus.docx
Review each team members selected case study for the Criminal Jus.docxReview each team members selected case study for the Criminal Jus.docx
Review each team members selected case study for the Criminal Jus.docx
audeleypearl
 
Running Head REENTRY AND REHABILITATION 1REENTRY AND REHABILIT.docx
Running Head REENTRY AND REHABILITATION 1REENTRY AND REHABILIT.docxRunning Head REENTRY AND REHABILITATION 1REENTRY AND REHABILIT.docx
Running Head REENTRY AND REHABILITATION 1REENTRY AND REHABILIT.docx
jeanettehully
 
Running Head REENTRY AND REHABILITATION 1REENTRY AND REHABILIT.docx
Running Head REENTRY AND REHABILITATION 1REENTRY AND REHABILIT.docxRunning Head REENTRY AND REHABILITATION 1REENTRY AND REHABILIT.docx
Running Head REENTRY AND REHABILITATION 1REENTRY AND REHABILIT.docx
todd581
 
Deterrence%20 briefing%20
Deterrence%20 briefing%20Deterrence%20 briefing%20
Deterrence%20 briefing%20
sevans-idaho
 
A model for engaging youth in evidence informed policy and program development
A model for engaging youth in evidence   informed policy and program developmentA model for engaging youth in evidence   informed policy and program development
A model for engaging youth in evidence informed policy and program development
Dr Lendy Spires
 
A model for engaging youth in evidence informed policy and program development
A model for engaging youth in evidence   informed policy and program developmentA model for engaging youth in evidence   informed policy and program development
A model for engaging youth in evidence informed policy and program development
Dr Lendy Spires
 
NCIP Strategic Plan 2014-2019
NCIP Strategic Plan 2014-2019NCIP Strategic Plan 2014-2019
NCIP Strategic Plan 2014-2019
Todd Harris Fries
 
Review of best practices for ICJI program areas and funding streams Justice A...
Review of best practices for ICJI program areas and funding streams Justice A...Review of best practices for ICJI program areas and funding streams Justice A...
Review of best practices for ICJI program areas and funding streams Justice A...
Sarah LeeAnn Smith
 
Review Paper Presentation
Review Paper PresentationReview Paper Presentation
Review Paper Presentation
zoe72402
 
MCJ 6530, Critical Analysis of Criminal Justice Public.docx
  MCJ 6530, Critical Analysis of Criminal Justice Public.docx  MCJ 6530, Critical Analysis of Criminal Justice Public.docx
MCJ 6530, Critical Analysis of Criminal Justice Public.docx
joney4
 

Similar to FINALBOTDRAFT28 (16)

Why restorative justice_will_not_reduce
Why restorative justice_will_not_reduceWhy restorative justice_will_not_reduce
Why restorative justice_will_not_reduce
 
Safe protocol
Safe protocol Safe protocol
Safe protocol
 
Final thesis!!
Final thesis!!Final thesis!!
Final thesis!!
 
Review each team members selected case study for the Criminal Jus.docx
Review each team members selected case study for the Criminal Jus.docxReview each team members selected case study for the Criminal Jus.docx
Review each team members selected case study for the Criminal Jus.docx
 
Running Head REENTRY AND REHABILITATION 1REENTRY AND REHABILIT.docx
Running Head REENTRY AND REHABILITATION 1REENTRY AND REHABILIT.docxRunning Head REENTRY AND REHABILITATION 1REENTRY AND REHABILIT.docx
Running Head REENTRY AND REHABILITATION 1REENTRY AND REHABILIT.docx
 
Running Head REENTRY AND REHABILITATION 1REENTRY AND REHABILIT.docx
Running Head REENTRY AND REHABILITATION 1REENTRY AND REHABILIT.docxRunning Head REENTRY AND REHABILITATION 1REENTRY AND REHABILIT.docx
Running Head REENTRY AND REHABILITATION 1REENTRY AND REHABILIT.docx
 
Deterrence%20 briefing%20
Deterrence%20 briefing%20Deterrence%20 briefing%20
Deterrence%20 briefing%20
 
Taylor,F.Capstone
Taylor,F.CapstoneTaylor,F.Capstone
Taylor,F.Capstone
 
A model for engaging youth in evidence informed policy and program development
A model for engaging youth in evidence   informed policy and program developmentA model for engaging youth in evidence   informed policy and program development
A model for engaging youth in evidence informed policy and program development
 
A model for engaging youth in evidence informed policy and program development
A model for engaging youth in evidence   informed policy and program developmentA model for engaging youth in evidence   informed policy and program development
A model for engaging youth in evidence informed policy and program development
 
J.Holton_DiP_FINAL
J.Holton_DiP_FINALJ.Holton_DiP_FINAL
J.Holton_DiP_FINAL
 
NCIP Strategic Plan 2014-2019
NCIP Strategic Plan 2014-2019NCIP Strategic Plan 2014-2019
NCIP Strategic Plan 2014-2019
 
Review of best practices for ICJI program areas and funding streams Justice A...
Review of best practices for ICJI program areas and funding streams Justice A...Review of best practices for ICJI program areas and funding streams Justice A...
Review of best practices for ICJI program areas and funding streams Justice A...
 
Review Paper Presentation
Review Paper PresentationReview Paper Presentation
Review Paper Presentation
 
MCJ 6530, Critical Analysis of Criminal Justice Public.docx
  MCJ 6530, Critical Analysis of Criminal Justice Public.docx  MCJ 6530, Critical Analysis of Criminal Justice Public.docx
MCJ 6530, Critical Analysis of Criminal Justice Public.docx
 

FINALBOTDRAFT28

  • 1. Running Head: SUCCESSFUL ALTERNATIVES TO 1 Abstract This research was conducted to demonstrate the decreased costs to the government to alternatives to incarceration (total cost per individual for justice reinvestment versus total cost of incarceration) and to quantify the additional benefits that program components from programs such as Back on Track offer in assisting individuals to maintain successful crime-free lives. By investigating the correlation between education/literacy and the general prison population, a clear link between education level and potential to commit low-level crime was established. The research involved comparisons of the U.S. data and justice practices with other countries to allow the recognition that the high incarceration rate in the U.S. is not typical of any other country and the crime rate in the U.S. does not correspond to its high incarceration rates. This data shows that approaches used in other countries, such as coordinating efforts with offender services such as health and housing and community organizations, coupled with reducing prison admissions and lengths of incarceration by offering reinvestment in justice, is more financially beneficial and increases public safety. As spending and the expenditures of incarceration are increasingly impacting U.S. state spending, including education, decision makers must examine justice reinvestment as a solution to managing offenders instead of incarceration, and reducing penalties using a broad range of approaches, including, but not limited to, higher educational attainment, workforce development training, life skills training, and parenting support. Promoting usable skills allows offenders to obtain legal employment and establish the foundation for leading a crime-free life.
  • 2. SUCCESSFUL ALTERNATIVES TO 2 Successful Alternatives to Incarceration for Low-level Offenders Jennifer M. York Columbia Southern University DBA9406D Student ID 118075
  • 3. SUCCESSFUL ALTERNATIVES TO 3 Approval We, the undersigned, certify we have read this dissertation and approve it as adequate in scope and quality for the degree of Doctor of Business Administration. Recipient of Degree: Jennifer M. York Title of Dissertation: Successful Alternatives to Incarceration for First-Time Offenders ________________________________________ ________________________________ Chair of Committee, Dr. Corinne Patrick, DPA Date ________________________________________ ________________________________ Member, Dr. Robert Goldwasser Date ________________________________________ ________________________________ Member, Dr. Monica Sainz, DSM Date
  • 4. SUCCESSFUL ALTERNATIVES TO 4 Dedication This body of work is dedicated to my dad, Bill Mays, who never stopped believing in me.
  • 5. SUCCESSFUL ALTERNATIVES TO 5 Acknowledgements I want to thank the many individuals who contributed to the successful completion of this work.
  • 6. SUCCESSFUL ALTERNATIVES TO 6 Table of Contents Introduction............................................................................................................................................... 9  Statement of Problem............................................................................................................................ 9  Purpose Statement............................................................................................................................... 10  Breaking the Cycle of Crime. ....................................................................................................... 11  BOT Program Eligibility............................................................................................................... 11  BOT Program Components........................................................................................................... 12  Significance of the Study.................................................................................................................... 13  Literature Review ................................................................................................................................... 14  Workforce Development..................................................................................................................... 14  Parenting Support................................................................................................................................ 14  Life Skills Training............................................................................................................................. 15  Education ............................................................................................................................................ 16  Methodology of Research....................................................................................................................... 17  Description of Decision Criteria......................................................................................................... 17  Research Methodology: Quantitative Approach........................................................................... 17  Quantitative Data Analysis. .......................................................................................................... 18  Incarceration ....................................................................................................................................... 19  Definition...................................................................................................................................... 19  Educational and Socioeconomic Characteristics of the Incarcerated Population......................... 22  Changes in the Criminal Justice System and the Effect on Incarceration Rates. ......................... 28  Juvenile Crime. ............................................................................................................................. 35  Recidivism .......................................................................................................................................... 36  Definition...................................................................................................................................... 36  San Francisco Recidivism Rates................................................................................................... 37  California Recidivism Rates. ........................................................................................................ 37  U.S. Recidivism Rates. ................................................................................................................. 40  International Recidivism Rates..................................................................................................... 42  Comparison of U.S. Recidivism Rates to International Recidivism Rates................................... 42  Linking Crime/Incarceration and Education................................................................................. 44  Linking Recidivism and Education............................................................................................... 46  Additional Consequences for Incarcerated Individuals Re-entering the Public Community....... 47  Sample U.S. Educational Programs and Early Results................................................................. 54  Findings.................................................................................................................................................... 58  Research Purpose................................................................................................................................ 58  Incarceration and Recidivism. ...................................................................................................... 59  Linking Crime/Incarceration and Education................................................................................. 59  Linking Recidivism and Education............................................................................................... 59  Conclusions and Recommendations...................................................................................................... 61  Statistical Analysis.............................................................................................................................. 62 
  • 7. SUCCESSFUL ALTERNATIVES TO 7 Long-Term Economic and Public Safety Impacts of Incarceration.................................................... 66  Impacts of incarceration on children............................................................................................. 66  Recommendations for Future Research.............................................................................................. 67  References................................................................................................................................................ 69 
  • 8. SUCCESSFUL ALTERNATIVES TO 8 List of Tables 1 Total U.S. Jail Population 2001, 2008, 2009 .............................................................................................. 20 2 Total U.S. Prison Population 2001, 2008, 2009.......................................................................................... 21 3 Total Male Prisoners Under the Jurisdiction of State or Federal Authorities ............................................. 25 4 Total Female Prisoners Under the Jurisdiction of State or Federal Authorities.......................................... 26 5 U.S. Incarceration Rates: 1980 through 2009............................................................................................. 29 6 Entire World – Prison Population Totals.................................................................................................... 33 7 Recidivism Rates Within 1- and 2-Year Follow-up Periods for Felons Paroled to California Supervision ............................................................................................................................ 39 8 Comparison of Recidivism Rates................................................................................................................ 43 9 Incarceration Data....................................................................................................................................... 63 10 Statistical Analysis...................................................................................................................................... 63 11 Statistical Analysis...................................................................................................................................... 65  List of Figures 1 Total U.S. Jail Population 2001, 2008, 2009 .............................................................................................. 20  2 U.S. Prison Population 2001, 2008, 2009................................................................................................... 21  3 Institutional Population by Racial/Ethnic Group and Gender..................................................................... 24  4 Total Male Prisoners Under State or Federal Jurisdiction 2001, 2008, 2009 ............................................. 25  5 Total Female Prisoners Under State or Federal Jurisdiction 2001, 2008, 2009.......................................... 26  6 General and Prison Population Education Data.......................................................................................... 27  7 Number of Incarcerated per 100,000 .......................................................................................................... 29  8 The Cycle of Prison Release....................................................................................................................... 41  9 Prison Count 1987-2007 ............................................................................................................................. 52  10 Prison Costs 1987-2007 .............................................................................................................................. 52  11 State Spending on Corrections.................................................................................................................... 53  12 State Spending on Higher Education .......................................................................................................... 53  13 Total Number Incarcerated ......................................................................................................................... 64  14 Total Cost of Incarceration ......................................................................................................................... 64  15 Graphical Analysis...................................................................................................................................... 65 
  • 9. SUCCESSFUL ALTERNATIVES TO 9 Introduction The Back on Track (BOT) program is designed to break the cycle of crime. Releasing prisoners at the end of their sentences with no skills, no plan, nowhere to turn, and no other changes to the circumstances that initially led them to prison creates a revolving door in and out of the criminal justice system. The BOT program uses the tools of the existing criminal justice system, combined with direct services and advocacy, to improve the economic opportunity for some of the Bay Area and City of San Francisco’s most underserved residents. The BOT program demonstrates the economic and social effectiveness of providing workforce development tools for young adults to avoid felony conviction. Program participants (defendants) plead guilty to a crime and their sentencing is deferred for 12 to 18 months, during which time the defendants appear before a judge every 2 weeks to monitor compliance and progress. When a participant has successfully completed the program, the San Francisco District Attorney’s (SFDA) Office motions the court to dismiss the case under California Penal Code 1000.5 (http://law.onecle.com/california/penal/1000.5.html), the Public Defender then requests the records be sealed under California Penal Code Section 851.90 (http://www.leginfo.ca.gov/cgi- bin/displaycode?section=pen&group=00001-01000&file=833-851.90), and the participants retain a clean record. If a participant is charged with a new crime or fails the program, that individual is immediately terminated from the program and set to be sentenced. The BOT program costs approximately $5,000 per participant, compared with $10,000 to adjudicate a case and almost $50,000 per year to incarcerate a low-level offender in a California prison or jail (Rivers & Anderson, 2009). Statement of Problem The problem is the lack of benefit resulting from the current justice system practice for the last 30 years, which has focused on incarcerating low-level offenders without identifying the long-term
  • 10. SUCCESSFUL ALTERNATIVES TO 10 effects of those incarcerated. Incarcerating low-level offenders has not resulted in deterring low-level offenses. Low-level offenders are often individuals without adequate education or workforce development skills, who then commit crimes as a means of producing income. When these individuals are released from incarceration, they continue to commit crimes and are re-incarcerated because they have no additional education or workforce training than they had at the time of their first commission of a crime. After 30 years, it is time to review the current practices in the U.S. and in other countries, which offer a different approach to the “tough on crime” stance. This study is important, as U.S. states and the federal government are running out of funding for the current trend of putting individuals through the criminal justice system, building and staffing more prisons, and then repeating the cycle. The importance of the study is to acknowledge that the current approach is ineffective and begin to identify alternative options to incarceration, including increasing funding in the areas of education and workforce development. Purpose Statement The purpose of the research is to demonstrate the decreased costs to the government of incarceration (total cost per individual versus total cost of incarceration), and quantify the additional benefits the program components offer in assisting individuals to maintain successful crime-free lives— investigating the correlation between education/literacy and the general prison population and identifying some non-financial additional successes of similar programs throughout the U.S. for individuals prior to incarceration and for individuals who are incarcerated—i.e., secondary successes derived from gaining literacy and the opportunities realized from workforce development education, which sustains a significant decrease in recidivism. This data will be developed using existing research for prison education programs within and outside the U.S. to demonstrate the correlation between the decreasing return on investment of continuing to fund the prison system at the expense of funding
  • 11. SUCCESSFUL ALTERNATIVES TO 11 education. The BOT program promotes an intelligent approach to crime, using interventions that benefit the community, victims, and offenders. Breaking the Cycle of Crime. The BOT program uses Deferred Entry of Judgment in place of a felony conviction for narcotics sales. Most low-level offenders enter into and out of the system and are released from incarceration with no additional support or skills besides those which they possessed at the time of committing the initial crime and were sentenced. Lacking any work, education, or social integration prospects, many offenders commit additional crimes (Allen & Stern, 2007). Left with no other resources than what these individuals possessed prior to incarceration, they return to criminal activities. Within 3 years after release, 7 out of 10 California prisoners will return to prison, following additional offenses (Rivers & Anderson, 2009). Communities are recognizing that investing in rebuilding the communities to which the prisoners return by providing better education, health care, and public space resources may be a solution to expanding and funding the prison system (Allen & Stern, 2007). The BOT program demonstrates a snapshot into the broader picture of spending on prosecuting and sentencing low-level offenses, incarceration, recidivism, and cycle of crime, and the potential benefit of spending on education and workforce development. BOT Program Eligibility. Eligibility in the BOT Program is restricted to young adult first-time drug offenders arrested with small quantities of narcotics. If a defendant has a history of gun possession, gang involvement, or violence, they are not eligible for the program. The program grants preference to offenders who are the parents of young children. Once an individual is arrested for possession-for-sale or drug sales, the SFDA’s office reviews the case as well as the individual’s criminal record to determine eligibility. Following the determination of eligibility, the defendant is granted the option of participation in the
  • 12. SUCCESSFUL ALTERNATIVES TO 12 BOT Program. BOT Program Components. Participants are closely supervised by the court while engaged in intensive, mandatory personal responsibility programs. Initially, individuals participate in a 6-week probationary screening phase to assess their motivation and commitment. During this initial period, participants must complete an orientation and perform an intensive program involving 60 hours of community service. Individuals are then eligible to enroll in the program. During the program, participants work with Goodwill Industries’ BOT Career Advisors, and each participant develops a personal responsibility plan that outlines her or his individual, specific workforce, educational, family, and other objectives for the 12- to 18-month program. The participants’ objectives may include the following: finding and securing full-time employment, learning to read, obtaining a high school diploma, enrolling in City College, opening and maintaining a bank account, stabilizing their housing situation, attending parenting classes, and abiding by child support orders. Participants are provided significant support services to allow them access to the tools they need to reach each objective outlined in their personal responsibility plan. Program participants are offered access to the following (San Francisco District Attorney, 2011): 1. Workforce development and placement, Union-based pre-apprenticeships, Goodwill Industries’ paid Transitional Jobs Program 2. Interactive monthly life skills workshops 3. Parenting support and mental health services 4. Educational opportunities, including GED (general educational development) classes and assistance with applications and financial aid at San Francisco City College and other colleges
  • 13. SUCCESSFUL ALTERNATIVES TO 13 Significance of the Study The study is significant because it provides documentation of the population incarcerated, the cost of incarceration, and potential alternatives to incarceration. In addition, the study offers additional benefits to identifying and implementing alternatives to incarceration beyond simply comparing the cost of incarceration versus the cost to employ alternatives. Additional benefits to change the criminal justice system from incarceration to rehabilitation include less overall cost to the U.S. economic system, as individuals have the opportunity to become taxpayers and discontinue use of the public assistance service for housing, medical, and food. Additional studies may investigate not simply the amount saved by not incarcerating individuals during their life cycle, but may also quantify the amount paid back into the economic system through legitimate work throughout an individual’s life.
  • 14. SUCCESSFUL ALTERNATIVES TO 14 Literature Review The program resources are targeted at increasing the potential for success in the program and maintaining a crime-free future. The program is composed of 4 components, this research will briefly discuss the benefits of 3 of the components, workforce development, parenting, and life skills, but the main focus of the research is the educational component. Workforce Development Offering workforce development and placement, Union-based pre-apprenticeships, and the Goodwill Industries’ paid Transitional Jobs Program offers a positive workplace experience and provides opportunities for full-time employment, which have previously been difficult for the program participants. Recent research has shown that employment opportunities are associated with decreased potential for recidivism—committing a new crime resulting in a new conviction or for violating parole or probation—as well as increased time between release and reincarceration for offenders that commit additional crimes. In addition, one particular research study argues that increased time spent crime-free indicates a positive change of behavior that allows individuals to maintain the initial motivation associated with employment (Tripodi et al., 2009). Parenting Support Research shows a correlation between juvenile delinquency and adult criminality. According to a National Institute of Justice study, abused and neglected children were 11 times more likely to be arrested for criminal behavior as juveniles, 3.1 times more likely to be arrested for 1 of many forms of violent crime (juvenile or adult), and 2.7 times more likely to be arrested for violent and criminal behavior as adults (English et al., 2004). Supporting individuals to parent using models that promote healthy interaction is critical to successful parenting.
  • 15. SUCCESSFUL ALTERNATIVES TO 15 Life Skills Training Much of the underserved youth population suffers from undeveloped life skills. Through interactive life skills workshops, BOT participants are given specific tools to succeed in the workplace. Research shows that early interventions with youth are extremely important in preventing criminal behavior in young adults. Because aggressive behavior is learned early in a child’s life, education in impulse control, anger management, and conflict resolution are important for offering tools for managing life situations and preventing socially unacceptable behavior. Interventions that promote good social relationships between young people and adults have also resulted in effectively building resilience and reducing criminal behavior in youth. The underserved youth do not always have an opportunity to observe functional social role models or receive mentoring in order to acquire the range of interpersonal and social skills needed for proper social development, i.e., skills used in daily interactions, which can be violence prevention skills, as they prevent violence by maintaining social interactions. Basic life skills training includes behaviors such as developing empathy for others, reflecting on the consequences of actions, and conflict resolution. To produce a successful outcome to a conflict, many individuals must be trained in the skills needed to resolve conflicts peacefully (La Vigne et al., 2006). While additional research is necessary, research also suggests that cognitive-behavioral programs may be more effective at reducing recidivism, however, the current research supports life skills programs combined with probation as an indicator to help reduce recidivism and decrease violations to a greater degree than probation only. Programs that teach life skills for criminal populations tend to encompass a broad range of areas, including workforce development, personal care, time management, budgeting, anger management, and relationship building (Farkas, 2000; Finn, 2000; Orosz, 1996). Because the content of life skills programs is different from one program to the next, the statistical data on the success of life skills programs is deficient. However, among the limited existing individual
  • 16. SUCCESSFUL ALTERNATIVES TO 16 program evaluations of life skills programs, the results are positive. One study found prisoners that were taught problem solving, assertiveness, and interpersonal and practical living skills became more assertive, had higher self-esteem, were more empathetic, and had better social skills (Marshall et al., 1989). Education Program participants are offered a range of educational opportunities, including GED classes and assistance with applications and financial aid at San Francisco City College and other colleges. Statistical data indicates that more than 60% of all prison inmates are functionally illiterate; penal institution records show that inmates have a 16% chance of returning to prison if they receive literacy help, as opposed to 70% who receive no help. Currently, more than 70% of inmates in U.S. prisons cannot read above a fourth grade level (Write Express, 2011). Research has shown that internationally, the quality and amount of education a youth receives and their academic success is strongly linked to whether they choose to commit crimes (Dawes & Donald, 1999).
  • 17. SUCCESSFUL ALTERNATIVES TO 17 Methodology of Research Description of Decision Criteria Incarceration can have a profound impact on the emotional and physical health of individuals as well as friends, families, and society as a whole. Establishing that a rigorous program encompassing workforce development, life skills, parenting education, and education is cost-effective for reducing the overall numbers of incarcerated individuals, as well as contributing to the potential to maintain a crime- free future will be demonstrated using the quantitative research methodology approach. Research Methodology: Quantitative Approach. The quantitative research design will be used to quantify the benefits of education in preventing and reducing crime. This approach uses theoretical assumptions and methods of inquiry. These assumptions will steer the methodology and direction of the data collection and analysis, and expand the existing research to demonstrate approaches in specific areas of prevention prior to incarceration or reentry programs for incarcerated individuals. The method itself involves the collection, analysis, and combination of the quantitative data, which allows for a significant understanding of the research problems. The research dilemma of the existence of a possible alternative to incarceration can be solved using statistical analysis in the form of numbers, and reinforced by statistical data showing success and failure rates of existing programs throughout and outside the U.S. The pre-existing and existing data is collected, analyzed, and combined to develop a more complete representation of the problem than when separate studies are conducted prior to incarceration or during incarceration—specifically, breaking the cycle of crime prior to incarceration by providing previously non-existent education opportunities and breaking the cycle of crime during/after incarceration by providing previously non-existent education opportunities. Using a quantitative
  • 18. SUCCESSFUL ALTERNATIVES TO 18 approach for individuals prior to entering the prison system and for individuals within the prison system, will offer additional insight into breaking the cycle of crime before imprisonment becomes a lifestyle, as well as after it has become a life pattern. This research seeks to demonstrate that regardless of an individual’s history or incarceration status, an education or adequate training have the potential to end the cycle of crime regardless of the phase of that lifestyle the individual is experiencing. This design corroborates that the data is less influenced by any one, individual personal bias toward one specific program and/or interpretation of the researcher inherent in using the qualitative research process only for one existing program. Quantitative Data Analysis. Instruments. 1. Statistical data analysis from the City of SFDA’s office from the program’s initial startup in 2005 until the July 2011 graduation to quantify the numbers of successful participants of the current BOT program. 2. Statistical data analysis on crime and educational level in California and the U.S. using the 2010 Census and additional data, for the 5-year period of time during which the BOT program has been operational. This data is necessary to support the hypothesis that a correlation between crime and education exists. 3. Statistical data analysis on the educational level of incarcerated individuals in California and the U.S. using available publications and information, for the 5-year period of time during which this program has been operational. This data is necessary to support the hypothesis that a correlation between crime and education exists. 4. Statistical data analysis on the educational programs being offered in the California prison system for successful reentry of prisoners.
  • 19. SUCCESSFUL ALTERNATIVES TO 19 5. Statistical data analysis on educational and reentry programs being offered in states outside the California prison system for successful reentry of prisoners. 6. Statistical data analysis on educational and reentry programs being offered outside the U.S. to allow successful reentry of prisoners in other countries. Analysis. The quantitative data analysis focuses on correlating the following research data, which links the changes in the criminal justice system and effect on incarceration rates, educational and socioeconomic characteristics of the incarcerated population, juvenile crime, recidivism and education, education and incarceration, additional consequences to incarcerated individuals reentering the public community, and potential changes to the additional legal consequences to reentering individuals. The data will then be combined with data for incarcerated individuals reentering society outside the prison system in the State of California, in the U.S. outside the State of California, and nations outside the U.S. Incarceration Definition. For the purposes of this research project, incarceration includes individuals imprisoned in both jails and prisons. The number of individuals (male and female) incarcerated in U.S. jails in the years 2001, 2007, and 2008 is shown in Table 1 and Figure 1. Table 2 and Figure 2 show the number of prisoners (male and female) incarcerated in U.S. prisons in 2001, 2007, and 2008.
  • 20. SUCCESSFUL ALTERNATIVES TO 20 TABLE 1 Total U.S. Jail Population 2001, 2008, 2009 12/31/2001 12/31/2008 12/31/2009 Total US 63,140 83,497 86,653 Total Federal 2,438 2,438 2,896 Total California 2,758 2,736 2,611 FIGURE 1 Total U.S. Jail Population 2001, 2008, 2009 Source: California Prisoners and Parolees, 2009
  • 21. SUCCESSFUL ALTERNATIVES TO 21 TABLE 2 Total U.S. Prison Population 2001, 2008, 2009 12/31/2001 12/31/2008 12/31/2009 Total US 1,298,027 1,609,759 1,613,740 Total Federal 145,416 201,280 208,118 Total State 163,001 173,670 171,275 FIGURE 2 U.S. Prison Population 2001, 2008, 2009 Source: California Prisoners and Parolees, 2009
  • 22. SUCCESSFUL ALTERNATIVES TO 22 Educational and Socioeconomic Characteristics of the Incarcerated Population Today, more than 90% of the prison population is male; almost 50% is African American, and the data currently available shows that 40% have not completed high school. Currently, 18% of the general population does not have a high school diploma or equivalent compared to more than 40% of the adult correctional population. Only 13% of the adult correctional population has any postsecondary education, while almost one-half of the general population has some postsecondary education. Incarcerated individuals are more likely than non-incarcerated individuals to have a GED than the general population. Caucasian prisoners have a higher education level than African American and Hispanic prisoners, while African Americans have a higher education level than Hispanics. A higher education attainment may increase the ability to return to work, and thus may reduce the likelihood of incarceration because the opportunity costs of illegal behavior, the psychological effects of criminal activity, and the preferences involved in the decision-making process prior to committing a crime, are different depending on educational level (Ewert & Wildhagen, 2011). In the general population, 25% of young African American men did not complete high school, compared to 14% of young white men. This is an 11 percentage point difference that can be compared to 58% of young African American men in prison who did not complete high school and 41% of young white men in prison who did not, which is a 17% difference. The percentage of females in the general population and the prison population is similar to the males; however, the educational attainment percentage for the at-risk women was more similar to prisoners’ educational attainment than was the distribution for the general household population outside prison. Female prisoners had lower levels of educational attainment than women who were economically disadvantaged in the general population (Ewert & Wildhagen, 2011). Additional statistics show a 68% national graduation rate—almost one-third of public high
  • 23. SUCCESSFUL ALTERNATIVES TO 23 school graduates do not graduate. These dropout/graduation rates show an extensive racial gap for graduates, specifically:  Students from minority groups that have been historically disadvantaged minority groups (African American, Native American, and Hispanic) have a 50% chance of not finishing high school with a diploma)  The graduation rate for Asians and Caucasians is 77 and 75%, respectively  The graduation rate for females is 8% higher than for males  The gap for students that attend schools in racially segregated, high poverty, and urban school districts is 15 to 18% higher  The gaps in graduation rates are stratified in specific regions throughout the U.S. (Harlow, 2003)  Figure 3 shows the institution population gender as of December 31, 2009.  Tables 3 and 4 and Figures 4 and 5 show the U.S. prison population broken out by gender (California Prisoners and Parolees, 2009) Learning disabilities. As shown in the 2003 National Assessment of Adult Literary Prison Survey, a higher percentage of prison inmates than adults living in households in the general population were male, African American, and Hispanic, and a higher percentage had been diagnosed with a learning disability (17% versus 6%) (Greenberg et al., 2007) (Figure 6). As the rates of incarceration have increased, a significantly disproportionate of population subgroups has been incarcerated, prompting researchers to focus their research on the characteristics of prisoners.
  • 24. SUCCESSFUL ALTERNATIVES TO 24 FIGURE 3 Institutional Population by Racial/Ethnic Group and Gender Source: California Prisoners and Parolees, 2009
  • 25. SUCCESSFUL ALTERNATIVES TO 25 TABLE 3 Total Male Prisoners Under the Jurisdiction of State or Federal Authorities 12/31/2001 12/31/2008 12/31/2009 Total US 1,391,261 1,609,759 1,500,278 Total Federal 135,171 188,007 194,493 Total California 163,001 173,670 171,275 FIGURE 4 Total Male Prisoners Under State or Federal Jurisdiction 2001, 2008, 2009 Source: California Prisoners and Parolees, 2009
  • 26. SUCCESSFUL ALTERNATIVES TO 26 TABLE 4 Total Female Prisoners Under the Jurisdiction of State or Federal Authorities 12/31/2001 12/31/2008 12/31/2009 Total US 93,234 114,649 113,642 Total Federal 10,245 13,273 13,625 Total California 11,161 11,620 10,989 FIGURE 5 Total Female Prisoners Under State or Federal Jurisdiction 2001, 2008, 2009 Source: California Prisoners and Parolees, 2009
  • 27. SUCCESSFUL ALTERNATIVES TO 27
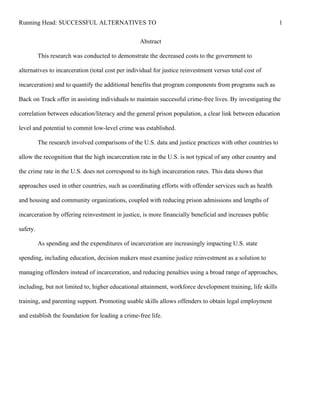
 FIGURE 6 General and Prison Population Education Data Learning Disability-General Population 6 Caucasian High School Dropouts-General Population 18 African American High School Dropouts-General Population 25 Learning Disability-Prison Population 17 Caucasian High School Dropouts-Prison Population 31 African American High School Dropout-Prison Population 58 Source: California Prisoners and Parolees, 2009
  • 28. SUCCESSFUL ALTERNATIVES TO 28 In the 1980s, the U.S. criminal justice policy changed, increasing the proportion of individuals to serve prison time for more punitive crimes, such as low-level drug offenses. The increased sentencing guidelines correlated with the rapid increase in the size of the prison population during the 1980s, particularly for young, low-skilled male minorities. Changes in the Criminal Justice System and the Effect on Incarceration Rates. In 1980, the U.S. prison and jail system accommodated 500,000 individuals. In the 10 years between 1990 and 2000, the state and federal prison population doubled. By 2008, the number of incarcerated individuals had reached 2.3 million (Pew Charitable Trust, 2008) (Table 5 and Figure 7). Total state spending on corrections is currently approximately $52 billion, the majority of which is spent on prisons. State spending on prisons is 4 times higher than it was 20 years ago (Pew Center on the States, 2011). Currently, the impact of 25 years of tougher sentencing guidelines is being scrutinized, with additional research being conducted to examine the inequality of the prison population, using lifetime projected risk for imprisonment statistics of African American and Caucasian men, specifically incarceration, education level, and race as determining variables. A combination of survey, census, and administrative data shows that for men born between 1965 and 1969, 3% of Caucasians and 20% of African Americans had served time in prison by the time they reached their early 30s. This study data demonstrates that the risks of incarceration are highly influence by educational level. Of the African American men born during this period, 30% of African American men with no education and close to 60% of high school dropouts were sentenced to prison by 1999 (Petit & Western, 2004).
  • 29. SUCCESSFUL ALTERNATIVES TO 29 TABLE 5 U.S. Incarceration Rates: 1980 through 2009 Year Number Per 100,000 Year Number Per 100,000 1980 139 1995 411 1981 154 1996 427 1982 171 1997 444 1983 179 1998 461 1984 188 1999 476 1985 202 2000 478 1986 217 2001 470 1987 231 2002 476 1988 247 2003 482 1989 276 2004 486 1990 297 2005 491 1991 313 2006 501 1992 332 2007 506 1993 359 2008 504 1994 389 2009 502 FIGURE 7 Number of Incarcerated per 100,000 Source: Pew Charitable Trust, 2008
  • 30. SUCCESSFUL ALTERNATIVES TO 30 California incarceration rates. Of the 50 largest jail jurisdictions in the U.S., 9 are located in California (Minton, 2010). In a 2007 report to the governor of California, the Little Hoover Commission found that, “Despite the rhetoric, 30 years of “tough on crime” politics have not made the state safer. Quite the opposite: today thousands of hardened, violent offenders are released without regard to the danger they present to an unsuspecting public…California’s parole system remains a billion dollar failure” (Gilroy et al., 2010). The strict supervision requirements in the State of California are such that almost all individuals released from prison are put on mandatory parole for 3 years. California currently has the second highest number of released offenders returning to prison, at a rate of 40% (Pew Center on the States, 2011). U.S. incarceration rates. Currently, 1 out of every 100 U.S. adults resides in a U.S. jail or prison. Of these, 1 of every 30 incarcerated individuals is aged 20 to 34, and from this age group, 1 in 9 are African American men. The number of incarcerated individuals in the U.S. increased in 2007; however, there was no demonstrable decrease in overall crime or recidivism. Today, it is becoming apparent that it is not an increase in the general population or an increase in crime that has caused the increase in the incarcerated individuals. The increase in the population of individuals incarcerated is the direct result of the policy choices aimed at cleaning up or getting tough on crime. Changes in public policy have resulted in stiffer penalties for criminal behavior and have increased the period of incarceration. These figures do not account for the larger number of individuals on probation or parole. These individuals are convicted offenders that are not incarcerated, or on parole, which means they are under community supervision subsequent to a period of incarceration; when these individuals are combined with the individuals incarcerated, the total is more than 6.9 million adults under correctional supervision in 2003. This comprises 3.2% of the U.S. adult population.
  • 31. SUCCESSFUL ALTERNATIVES TO 31 The U.S. and the individual U.S. states are experiencing an increasingly debilitating fiscal crisis for incarcerating non-violent, low-risk offenders. The cost of the court system, housing, medical services, and rehabilitation programs have now resulted in some states examining their approach and strategy for reducing recidivism and involving communities for support and supervision to allow the lowest-risk offenders a second chance (Pew Charitable Trust, 2008). Exhibits 4 and 5 show the U.S. prison population in 2001, 2007, and 2007, with the percentage of federal and state prison populations. International incarceration rates. Russia, Belarus, and Bermuda have the second highest rates of incarceration following the U.S., with approximately 532 prisoners per 100,000 people. In comparison, Western European countries have lower rates, France at 91, Germany at 96, and England and Wales at 142 per 100,000 people, respectively. The non-Western European nations have rates of 29 in India, 118 in China, and 190 in Cuba. Overall, more than three-fifths of the world’s countries have incarceration rates that are below 150 per 100,000 people. Currently, more than 10.1 million people are held in penal institutions worldwide, generally as sentence prisoners or pre-trial detainees/remand prisoners. The U.S. houses almost one-half of this total (2,290,000), Russia (810,000), and China (1,650,000 sentenced prisoners). In addition, detention centers in China house more than 650,000—including these brings the overall Chinese total to more than 2.3 million and the total worldwide to more than 10.75 million. These figures comprise the latest information available as of May 2001; however, there are 7 countries that do not report their incarceration numbers (Walmsley, 2011). Comparison of U.S. incarceration rates to international incarceration rates. While the U.S. currently has the highest incarceration rate in the world, with 726 per every
  • 32. SUCCESSFUL ALTERNATIVES TO 32 100,000 people, a comparison of victimization rates shows the U.S. has rates similar to other countries, and in some areas, U.S. citizens are at less risk of victimization than citizens in other countries. In other words, the U.S. does not have significantly higher rates of victimization or crime, just higher rates of incarceration than other nations. The U.S. murder rate is 4 times higher than most western European nations, and while murder did increase through the 1970s and 1960s, that increased rate cannot account for the increase in incarceration in the last 30 years (Table 6). In the 16 years beginning 1980, crime increased only 12%, while incarceration increased 88% due to sentencing and drug policy changes. These policy changes resulted in increased incarcerations as well as increased incarceration periods of time. In the U.S., 41% of prisoners have sentences exceeding 10 years, while only 12% of prisoners in England and Wales are sentenced for more than 10 years or more. In addition, 27% of U.S. drug offenders serve sentences in excess of 10 years, while in England and Wales, only 6% of prisoners are sentenced to 10 years or more (Defending Justice, 2011). Recent research in Australia indicates the following general statistics about Australia and its recidivism rate. Approximately 2 in every 3 prisoners will be re-imprisoned. Within 3 months of being released, approximately 1 of 4 prisoners will be reconvicted. Within 2 years of release, between 35 and 41% of prisoners will again be imprisoned. The Australian recidivism rates, regardless of the measurement instrument, appear consistent over time (Australian Bureau of Statistics, 2007).
  • 33. SUCCESSFUL ALTERNATIVES TO 33 TABLE 6 Entire World – Prison Population Totals Rank- ing Country Prison Popula- tion Rank -ing Country Prison Popula- tion Rank- ing Country Prison Popula- tion 1 U.S. of America 2,292,133 74 Panama 12,293 146 Kosovo/Kosova c.1,450 2 China 1,650,000 75 Puerto Rico (USA) 12,130 147 Montenegro 1,438 3 Russian Federation 806,100 76 Serbia 12,000 148 Oman 1,403 4 Brazil 496,251 77 Honduras 11,846 149 Belize 1,396 5 India 384,753 78 Ecuador 11,800 150 Bahamas 1,322 6 Thailand 224,292 79 Malawi 11,672 151 Central African Republic 1,320 7 Mexico 222,330 80 Costa Rica 11,635 152 Slovenia 1,311 8 Iran 220,000 81 Greece 11,364 153 Reunion (France) 1,307 9 South Africa 159,265 82 Yemen 11,313 154 Cape Verde (Cabo Verde) c.1,300 10 Ukraine 154,027 83 United Arab Emirates 11,193 155 Fiji 1,150 11 Turkey 124,074 84 Cote d'Ivoire 11,143 156 Maldives 1,125 12 Indonesia 117,863 85 Guatemala 11,140 157 Bahrain 1,100 13 Vietnam 108,557 86 Turkmenistan 10,953 158 Bosnia and Herzegovina: Republika Srpska 1,046 14 Philippines 104,710 87 Nepal 10,923 159 Congo (Brazzaville) c.1,000 15 Ethiopia c.85,450 88 Syria 10,599 160 Macau (China) 935 16 United Kingdom: England & Wales 84,635 89 Belgium 10,561 161 Suriname 915 17 Colombia 84,444 90 Kyrgyzstan 10,163 162 Martinique (France) 914 18 Poland 83,476 91 Slovakia 10,031 163 Barbados 910 19 Pakistan 75,586 92 Hong Kong (China) 9,988 164 Cyprus (Republic of) 883 20 Japan 74,476 93 Burundi 9,844 165 Guadeloupe (France) 784 21 Spain 73,459 94 Tajikistan 9,317 166 Gambia 780 22 Bangladesh 69,650 95 Lithuania 9,139 167 Netherlands Antilles (Netherlands) 713 23 Germany 69,385 96 Bulgaria 9,071 168 Luxembourg 706 24 Italy 67,615 97 Uruguay 8,783 169 French Guiana/Guyane (France) c.680 25 France 66,975 98 New Zealand 8,755 170 Djibouti c.600 26 Taiwan 64,420 99 Bolivia 8,700 171 Virgin Islands (USA) 587 27 Egypt 64,378 100 Austria 8,694 172 Malta 583 28 Rwanda c.62,000 101 Jordan c.8,500 173 Guam (USA) 559 29 Morocco 61,405 102 United Kingdom: Scotland 7,957 174 Qatar 551 30 Argentina 60,611 103 Senegal 7,550 175 St. Lucia 551 31 Myanmar (formerly Burma) 60,053 104 Mongolia 7,265 176 Grenada 440 32 Algeria 58,000 105 Sweden 7,106 177 Seychelles 432 33 Kazakhstan 55,552 106 Latvia 7,055 178 St. Vincent and the Grenadines 413 34 Chile 52,581 107 Niger c.7,000 179 French Polynesia (France) 404 35 Nigeria 50,000 108 Benin 6,908 180 Brunei Darussalam 379 36 Kenya 49,757 109 Nicaragua 6,803 181 New Caledonia (France) 326 37 Peru 48,045 110 Moldova (Republic of) 6,324 182 Sao Tome e Principe 305 38 Republic of (South) Korea 45,681 111 Switzerland 6,181 183 Samoa (formerly Western Samoa) 300
  • 34. SUCCESSFUL ALTERNATIVES TO 34 TABLE 6 Entire World – Prison Population Totals Rank- ing Country Prison Popula- tion Rank -ing Country Prison Popula- tion Rank- ing Country Prison Popula- tion 39 Saudi Arabia 44,600 112 Paraguay 6,146 184 Antigua and Barbuda 295 40 Venezuela 43,461 113 Haiti 5,331 185 Dominica 289 41 Uzbekistan c.42,000 114 Burkina Faso 5,238 186 Bermuda (United Kingdom) 278 42 Canada 39,132 115 Botswana 5,216 187 Aruba (Netherlands) 277 43 Malaysia 38,387 116 Croatia 5,165 188 Solomon Islands 265 44 Tanzania 37,811 117 Lebanon 5,122 189 St. Kitts and Nevis 260 45 Belarus 36,533 118 Armenia 5,100 190 Timor-Leste (formerly East Timor) 223 46 Iraq 31,645 119 Mali 5,041 191 Mayotte (France) 211 47 Tunisia 31,000 120 Jamaica 4,709 192 Cayman Islands (United Kingdom) 198 48 Uganda 30,312 121 Albania 4,482 193 Greenland (Denmark) 194 49 Democratic Republic of Congo (formerly Zaire) c.30,000 122 Ireland, Republic of 4,433 194 Jersey (United Kingdom) 192 50 Australia 29,700 123 Papua New Guinea 4,268 195 Iceland 189 51 Romania 29,644 124 Namibia 4,251 196 Vanuatu 187 52 Sri Lanka 26,798 125 Kuwait 4,179 197 Tonga 159 53 El Salvador 24,283 126 Togo 4,116 198 American Samoa (USA) 132 54 Georgia 23,995 127 Denmark 4,091 199 Comoros c.130 55 Cameroon 23,368 128 Laos 4,020 200 Northern Mariana Islands (USA) 124 56 Czech Republic 23,238 129 Norway 3,602 201 Virgin Islands (United Kingdom) 117 57 Israel 22,725 130 Trinidad and Tobago 3,591 202 Kiribati 102 58 Dominican Republic 21,050 131 Chad 3,416 203 Micronesia, Federated States of 100 59 Azerbaijan 20,470 132 Estonia 3,405 204 Isle of Man (United Kingdom) 97 60 Sudan 19,144 133 Finland 3,189 205 Palau 79 61 Madagascar 18,647 134 Republic of Guinea 2,780 206 Guernsey (United Kingdom) 69 62 Afghanistan 18,283 135 Gabon c.2,750 207 Andorra 61 63 Hungary 16,537 136 Swaziland 2,628 208 Anguilla (United Kingdom) 58 64 Angola 16,183 137 Lesotho 2,498 209 Gibraltar (United Kingdom) 50 65 Mozambique 16,000 138 Mauritius 2,354 210 Marshall Islands 43 66 Netherlands 15,604 139 Macedonia (former Yugoslav Republic of) 2,329 211 Cook Islands (New Zealand) 27 67 Zambia 15,544 140 Sierra Leone 2,237 212 Monaco 23 68 Zimbabwe c.15,000 141 Guyana 2,122 213 Nauru 20 69 Cambodia 14,043 142 Mauritania 1,700 214 Faeroe Islands (Denmark) 11 70 Ghana 13,573 143 United Kingdom: Northern Ireland 1,692 215 Tuvalu 8 71 Libya 13,242 144 Bosnia and Herzegovina: Federation 1,671 216 Liechtenstein 7 72 Singapore 12,978 145 Liberia 1,524 217 San Marino 2 73 Portugal 12,344
  • 35. SUCCESSFUL ALTERNATIVES TO 35 Juvenile Crime. Education and juvenile crime. International evidence indicates that young people, particularly first-time offenders, tend to get involved in a range of crimes rather than specializing in a certain type of crime. Research also shows that young people that are involved in petty acts of delinquency (minor crimes) at a very young age will likely continue committing crimes. The evidence also indicates that preventing youth violence at an early age is critical, as it is increasingly difficult to intervene once a criminal activity pattern has started. As a child gets older, the role of peers in discouraging or encouraging crime becomes more important. International evidence indicates that young people who receive a higher amount and quality of education and have greater academic success show a strong correlation about whether or not they choose to commit crimes (Palmary & Moat, 2002). Additional research shows that access to education, community, and social involvement, and consistent, supportive parenting increase a young person’s resilience to crime. While local governments are challenged to provide alternatives for at-risk youth, alternatives besides prison-based and law enforcement options are being developed. A high quality education increases a child’s resilience to criminality; thus, ensuring all youth access to high quality, consistent education is the responsibility of the community as well as law enforcement (Palmary & Moat, 2002). School dropout rates and juvenile crime. While the correlation between criminal activity and low levels of education is clear, the correlation between the high school dropout rate and criminal activity is profound. Graduating high school by age 18 is associated with a 9% decrease in property crime, a 17% reduction in violent crime, and a 10% decrease in crimes that are related to drugs. Statistics show that dropouts have double the criminal activity as high school graduates. While high school dropouts comprise only 23% of the general
  • 36. SUCCESSFUL ALTERNATIVES TO 36 population, this same population is responsible for 37% of juvenile crime. High school graduates comprise 77% of the general population and are responsible for 63% of crime (Belfield & Levin, 2009). Economic cost of school dropouts and crime. One significant component of the fiscal and social costs of low education attainment is the higher rate of criminal activity, for example, high school dropouts make up approximately two-thirds of all prison inmates (Harlow, 2003). Examining the significant losses resulting from juvenile crime, it is valuable to consider whether educational reforms would be effective. While it is not easy to definitively determine the link between education and juvenile crime, the review by Farrington and Welsh (2006) highlighted low attainment and cognitive scores as key determinants of juvenile crime. One key to offering a higher quality education and improving high school graduation rates is to establish a social bond between student and school, which may result in reducing crime. Education is psychologically linked to such variables as time preference and social control. Students that develop a social bond with school show an increased commitment to their education, a perception of the value of education, and higher acceptance of the authority of school. Physically attending school also affects the ability and opportunity to commit crime, as these juveniles are physically located at school during the time when they could be outside school and involved in criminal activities. Recidivism Definition. Understanding recidivism is important in the context of this research because, for the majority of low-level offenders who have no options for producing income outside crime, incarceration is the beginning of the cycle of recidivism the moment they enter the prison system. Recidivism derives from the Latin word recidivus, which means falling back. In terms of the criminal justice system, recidivism
  • 37. SUCCESSFUL ALTERNATIVES TO 37 involves committing a crime in spite of being previously punished for committing a crime. For parolees and probationers, recidivism also extends to a technical violation of supervision, i.e., failing a drug test, or not reporting to a parole or probation officer (Pew Center on the States, 2011). San Francisco Recidivism Rates. The California Department of Corrections (CDCR) cites that of the more than 2,500 felons paroled in San Francisco in 2003, 59% of felons were again incarcerated within 3 years of their release from prison (California Reentry Program, 2011) (Table 7). This may be due in part to San Francisco receiving more re-released inmates than those that were released to begin with (CDCR, 2009). California Recidivism Rates. The California Department of Corrections and Rehabilitation studied inmates released from state prisons between the years of 2005 and 2006 for 3 years. This study found that in San Francisco, 78.3% of offenders were returned to prison within 3 years of their release (CDCR, 2009). During calendar year 2009, 85,360 of the arrivals in California state prisons were parole returns, including 66,185 felon parole violators returned to custody (including those pending revocation hearings and psychiatric returns) for violating a condition of parole; 18,594 felon parole violators returned with a new term; 581 were returning civil narcotic addict outpatients; and 122 were returned from other jurisdictions (California Prisoners and Parolees, 2009). Currently, California has a prison population of approximately 168,000, with 112,500 parolees released from prison and living outside prison. In 2007, 92,000 parolees returned to prison as the result of the commission of additional post-release crimes. While these California state parolees are intended to be the beneficiaries of specific reentry assistance programs, oftentimes they cannot access these programs immediately upon their release, leaving these individuals with no additional options or resources than they had when they were first
  • 38. SUCCESSFUL ALTERNATIVES TO 38 incarcerated. This lag in reentry services results in individuals with no additional survival skills or means of survival than they possessed prior to incarceration. Lack of immediate support and inadequate dissemination of information result in some parolees unable to ever access the assistance required to remain outside incarceration. Although the CDCR offers several reentry programs, the programs reach only a small percentage of parolees and are not comprehensive enough to meet the needs of the individuals they are intended to serve. Case managers are unavailable to assist on an individual basis with reentry needs—this combined with the lack of personal case management, a lag time for services to be offered, and the lack of availability to access information—results in the typical incarcerated individual attempting to reenter life outside prison confronted with significant life challenges without the appropriate tools (California Reentry Program, 2011). As shown in Figure 8, the recidivism rate is high during the within 1- and 2-year follow-up periods for felons paroled to California supervision within the California Department of Corrections and Rehabilitation first paroled to parole in 2006 by principal commitment offense (California Prisoners and Parolees, 2009).
  • 39. SUCCESSFUL ALTERNATIVES TO 39 TABLE 7 Recidivism Rates Within 1- and 2-Year Follow-up Periods for Felons Paroled to California Supervision Source: California Prisoners and Parolees, 2009
  • 40. SUCCESSFUL ALTERNATIVES TO 40 U.S. Recidivism Rates. In 2004, the Reentry Policy Council, Council of State Governments estimated that, on a national level, of the more than 7.5 million people released from incarceration, more than 50% would be rearrested within 3 years of their release (Office of Justice Programs and Reentry Council, 2011). Figure 8 shows a table listing state prison releases and recidivism rates for each state in the U.S. and the proportion of released offenders returning to incarceration for committing either a technical violation or a new crime, in addition to individuals who did not return within 3 years.
  • 41. SUCCESSFUL ALTERNATIVES TO 41 FIGURE 8 The Cycle of Prison Release
  • 42. SUCCESSFUL ALTERNATIVES TO 42 International Recidivism Rates. Tracking international recidivism rates is difficult, as the definition of recidivism does not account for parole violations, rearrests, or reconvictions. Not all reoffenders are arrested, not all guilty are caught and tried, and not all arrests involve an outcome of guilty and sentencing. Additionally, different countries or regions measure data during different time periods, for varying demographics, which makes precise side-by-side comparisons difficult. Comparison of U.S. Recidivism Rates to International Recidivism Rates. Table 8 shows a snapshot of recidivism using data from the City of San Francisco, the State of California, U.S., Canada, Australia, and United Kingdom (CDCR, 2011; New World Encyclopedia, 2011; U.S. Bureau of Justice, 2011; and Whitehead, 2010).
  • 43. SUCCESSFUL ALTERNATIVES TO 43 TABLE 8 Comparison of Recidivism Rates Location and Study Year Total Number Tracked Number of States Rearrested Within 3 Years Percent Reconvicted During the 3-year Time Frame Percent Returned to Prison San Francisco, California1 2011 78.30% California1 2005-2006 108,000 67.50% U.S.2 1983 108,580 11 62.50% 47 1994 272,111 15 67.50% 47 California 2005-2006 108,000 67.50% Canada2 Rearrested Within 2 Years 1994-1995 46.00% 1996-1997 44.00% Australia3 Rearrested Within 2 Years Males Females 1990-1991 35-38% 35% 38% UK4 Rearrested Within 10 Years January-March 2000 74% Sources: 1 CDCR, 2011 2 U.S. Bureau of Justice, 2011 3 New World Encyclopedia, 2011 4 Whitehead, 2010
  • 44. SUCCESSFUL ALTERNATIVES TO 44 Linking Crime/Incarceration and Education. Linking Education and incarceration in San Francisco and the State of California. The number of students enrolled in California’s public high school system comprises 13% of the nation’s total public high school enrollment. Given the size of the state’s dropout population, California would benefit tremendously from improving its high school graduation rates. Based on the state’s reported number of dropouts in 2007-2008, we can infer that approximately 98,420 new dropouts enter California’s labor market each year. Permanently reducing the dropout rate by one-half for each new graduating class of high school students would yield more than $1.4 billion in direct gross economic benefits to the state through direct tax revenue. This $1.4 billion does not account for the money saved by California by not incarcerating individuals. Completely eliminating the dropout problem would save the state $2.8 billion annually, or approximately 14% of its present budget deficit, a significant economic opportunity for California (Stuit & Springer, 2010). Linking education and incarceration in the U.S. The differences in schooling explain at least part of the 23% gap between Caucasian and African American incarceration rates. It is not difficult to conclude that many African Americans who live in impoverished areas do not receive the same quality of education that they would if they lived in school districts with better schools. Given the 23% gap, it appears it would be possible to reduce crime rates by improving the quality and level of education of potential offenders. The following reasons may explain why education has a positive effect on crime—schooling increases the opportunity costs of illegal behavior because it increases the returns gained from legitimate work; education may affect the preferences for behavior to commit crimes because the punishment usually entails incarceration; and education may decrease some of the psychological rewards of the individual acts of crime, which could lead to significant reductions in incarcerations correlating to an increase in educational level (Lochner &
  • 45. SUCCESSFUL ALTERNATIVES TO 45 Moretti, 2002). Obtaining a high school diploma or equivalent may decrease an individual’s perception that they need to commit a crime (Alliance for Excellent Education, 2006). Following are the reasons Lochner and Moretti (2002) indicated for their theories that an increase in an individual’s educational attainment could cause a decrease in his subsequent probability of engaging in a crime. 1. Schooling increases potential income rates, which also increases the opportunity costs of crime. 2. Educated individuals tend to suffer greater punishment resulting from criminal activity. 3. Schooling has the potential to change the individual rates of time preference or risk aversion, which means schooling may increase an individual’s patience or risk aversion, i.e., more patient risk-averse individuals would be more influenced by the potential for future punishments. 4. Schooling may affect individual desires to commit crime by directly impacting the psychic costs of breaking the law. 5. The act of committing a crime may be influenced by the commission of crimes in the past. Literacy rates. In 2003, approximately 1.4 million adults were incarcerated in state or federal prisons. This represents 1.5 million more than were incarcerated in prisons 10 years earlier, which comprises a 55% increase. Only 43% of prison inmates entered prison with a high school diploma or a GED/high school equivalency certificate (Greenberg et al., 2011); 68% of state prison inmates did not receive a high school diploma; and approximately 26% of state prison inmates completed their GED while serving time in a correctional facility (Harlow, 2003).
  • 46. SUCCESSFUL ALTERNATIVES TO 46 There has been a rapid increase in the growth of the incarcerated population since the early 1980s. In 2002, the total incarcerated population exceeded 2 million people for the first time. Males of minority status, particularly young African American males, have been disproportionately affected by tougher anticrime measures. Today, almost 10% of young African American males between the ages of 18 and 24 is now incarcerated, with estimates that more than 33% of all African American male high school dropouts from the ages of 20 to 35 were in prison on an average day in the late 1990s—which is a higher proportion than those individuals in paid employment (Pettit & Western, 2000). It is undeniable that the negative causal relationship between education and crime is high and the educational attainment levels of prisoners are greatly decreased from those of the non-incarcerated public (Lochner & Moretti, 2004). In addition, 56% of the incarcerated high school completion category comes through completion of a GED, in other words, certification of a graduation equivalent but not an actual high school education. Linking Recidivism and Education. The average inmate has not attended school beyond the tenth grade and is typically from an educationally and culturally deprived environment. Statistics show that attendance is increasing, however, the academic achievement has stayed the same, just below the seventh grade level. This lack of performance appears to be partially due to at least 50% of inmates having a specific learning disability, typically associated with auditory or visual perception. Of the total prison population, 70% of inmates have never had any formal trade, skill, or profession training or preparation. The percentage of inmates with no work experience history prior to incarceration was also 70% (Bell, 2011). The correlation between criminal activity and low levels of education shows that the high school dropout is 5 to 8 times more likely to be incarcerated than an individual that has graduated from college. For incarcerated individuals that choose to attend school while incarcerated, a study conducted in 3
  • 47. SUCCESSFUL ALTERNATIVES TO 47 states indicated that attending school while in prison was associated with only a 29% chance of being incarcerated again. Regardless of whether or not inmates found a job following release from prison, the rates for recidivism remained the same for those who sought and obtained additional education while behind bars. An education, in and of itself, has high value, even if it does not directly result in employment. California has a 96% recidivism rate, in other words, all except 4 of every 100 inmates released returns to prison or jail within 3 years. This is one of the highest rates in the U.S. and has resulted in increased overcrowding in the justice system and facilities (Darche et al., 2009). Additional Consequences for Incarcerated Individuals Re-entering the Public Community. Two-thirds of all offenders will reoffend and return to prison/jail within 3 years (Langan & Levin, 2002). During the time period in which the incarceration rates in the U.S. have reached unparalleled levels, there has been a dramatic increase in the state, municipal, and federal legal barriers, increasing the challenges faced by individuals as they complete their sentences, move into the public community, and seek housing and employment. One of the strongest indicators of repeat offenses is the lack of a stable employment and living situation (Periman, 2011). Low levels of education and very little prior work experience make these individuals difficult to employ. A critical success factor for released offenders is their ability to obtain legitimate employment as soon as possible after release (Redcross et al., 2009). At this time, legislation in certain states has been enacted to make drug offenders ineligible for drivers’ licenses, certain federal health care benefits, federal educational aid, and residency in public housing. This inability of convicted individuals to work in specific fields, and obtain certain benefits or even a driver’s license is considered a collateral disability. These collateral disabilities greatly determine the future of released incarcerated individuals. As a result, the Uniform Collateral Consequences Act has been developed to assist states in altering the due process issues associated with hidden collateral
  • 48. SUCCESSFUL ALTERNATIVES TO 48 consequences, which could result in recidivism by limiting or eliminating the barriers to safe housing, education, and productive employment. The Uniform Collateral Consequences Act is the product of the National Conference of Commissioners on Uniform State Laws (NCCUSL). The NCCUSL was established in 1892, as a confederation of state representatives specifically to improve state law and promote uniformity of legislation in areas of national importance. The NCCUSL was developed as part of an 1889 resolution by the American Bar Association, which recommended individual states appoint commissioners to meet with representatives from other states to develop uniform state laws. By 1912, each state was sending commissioners to an annual meeting (Periman, 2011). U.S. Federal Interagency Reentry Council working to change reentry consequences. The U.S. Federal Interagency Reentry Council was formed in 2011 by U.S. Attorney General Eric Holden. The mission and goals of the U.S. Federal Interagency Reentry Council are to work with federal partners to examine barriers to successful reentry. The U.S. Attorney General is encouraging each individual U.S. state’s Attorney General to review the collateral consequences of incarceration in their states and eliminate the laws that impose burdens on former offenders. Again, the policies and penalties vary from state to state and individual states are recognizing the need to end the revolving door of incarceration in the U.S. prison and jail system. Successful reentry is the best solution to productively integrating ex-offenders back into the community, which involves assisting reentering individuals to become productive in their communities (Office of Justice Programs and Reentry Council, 2011). However, since 1994, when the Violent Crime Control and Law Enforcement Act eliminated the use of Pell Grants for prisoners, the college enrollment of prisoners has decreased dramatically, and reintroduction of free higher education in the prison system has fallen to individuals and individual educational institutions. Since 1994, approximately 350 programs throughout the U.S. were shut down due to lack of funding. Although prison education has rebounded since it declined following the 1994
  • 49. SUCCESSFUL ALTERNATIVES TO 49 decision by the U.S. Congress to set limits on educational assistance, the majority of the prison population enrolled in postsecondary programs is vocational, as opposed to solely academic studies (Inside Higher Ed, 2007). The Urban Institute Justice Policy Center recognized the importance of employment education, including the following potential steps: enrolling eligible exiting prisoners in work release programs prior to release; providing prerelease employment readiness training; providing appropriate workforce development agency referrals; providing prerelease education services; offering referrals to education institutions; and conducting prerelease education and employment skills and needs assessments (La Vigne & Halberstadt, 2010). Linking the educational component of the BOT Reentry Program to break the cycle of crime. The education component of the BOT program is critical to its success, as research consistently shows literacy levels among the U.S. prison population are generally lower than among the general population (Alteneder, 2007). In addition to U.S. Census Bureau statistics showing that prisoners are more likely to have GEDs than high school diplomas and have an overall lower level of educational attainment than the general population, research also indicates that prisoners have lower levels of education attainment than economically disadvantaged household populations (Ewert & Wildhagen, 2011). (The U.S. Census Bureau counts incarcerated individuals as residing in their “usual residence” and at the time of the Census taking, if that individual is incarcerated, their place of residence is as a resident of the institution in which they are housed [Census Advisory Committee, 2004]). Within the prison system, receiving a higher quality education is increasingly the focus, a reflection of the significance of the correlation between education level and incarceration. Focusing the attention on prison education programs is significant because attaining a higher level of education may predict an array of outcomes for individuals, including employment, health, income, and political
  • 50. SUCCESSFUL ALTERNATIVES TO 50 participation. A higher education level is also associated with a decrease in the potential to apply for public assistance. Unequal outcome in education not only affects the socioeconomic outcomes of the U.S. in direct costs of incarceration, it prevents the potential for individuals to contribute back into the economic system in a beneficial way to the socioeconomic status of society. In addition, since the strongest predictor of whether a given individual will attend college is determined by whether that individual’s parents attended college, an incarcerated person who has received a college education, regardless of the eventual outcome of release, has children that are more likely to pursue their own educations (Education Justice Project, 2011). Linking the educational component of the California Prison System Reentry Program to break the cycle of crime. In 2003, the California Reentry Program was started with one San Quentin prisoner interested in continuing his education after release and while on parole from San Quentin. This individual’s request resulted in a reevaluation of the lack of systematic delivery of information regarding opportunities and services in local communities to prisoners prior to release from incarceration. Currently, the program counts 25 volunteers and serves 150 to 200 prisoners per month (http://www.newworldencyclopedia.org/entry/Recidivism). Linking the educational component and the prison reentry programs outside the State of California prison system to break the cycle of crime. The widespread acceptance and normalcy of imprisoning young, poorly educated African American men by the punitive criminal justice polices of the 1980s resulted in few economic opportunities in impoverished urban neighborhoods. The impact of returning more than 700,000 prisoners to inner-city areas with concentrated poverty, high unemployment, lack of social services, and disintegration of quality of life can be significantly shifted, depending on the quality of the population
  • 51. SUCCESSFUL ALTERNATIVES TO 51 returning to the community. Typically, former prisoners are unequipped to lead productive, crime-free lives. This mass incarceration does nothing to improve public safety in the long term, as improving economic opportunity is critical to reducing crime. However, spending on prisons has increased from $19,000,000 in 1982 (in 2007 dollars) to $70,000,000 in 2005. In 2008, the U.S. Sentencing Commission began seriously considering alternatives to prison for certain offenders. These alternatives included employment training for minor parole violators. This shift in thinking from incarceration to education marks a significant course correction for lawmakers who now recognize that mandatory sentences imprisoning first-time offenders disproportionately impacts minorities (Fears, 2008).
  • 52. SUCCESSFUL ALTERNATIVES TO 52 FIGURE 9 Prison Count 1987-2007 FIGURE 10 Prison Costs 1987-2007
  • 53. SUCCESSFUL ALTERNATIVES TO 53 FIGURE 11 State Spending on Corrections FIGURE 12 State Spending on Higher Education
  • 54. SUCCESSFUL ALTERNATIVES TO 54 Sample U.S. Educational Programs and Early Results. Following are additional institutions and brief descriptions of education programs for reentry and education programs outside California. Texas: An innovative program in the State of Texas, which has one of the highest incarceration rates in the world, offenders may be put on probation and sentenced to read through the rehabilitation program Changing Lives Through Literature (CLTL). The CLTL program involves reading specific books and attending a reading group, along with the other specific probation requirements. This program currently shows only a 6% recidivism rate of individuals having their probation revoked and being sentenced. The average cost to incarcerate an individual in Texas is $30,000 per year, the cost to enroll an individual in the CLTL program is $500 (Barker, 2010). Bard Prison Initiative (New York): The Bard Prison Initiative is the largest program of its type in the U.S., with 250 enrolled incarcerated men and women. From its start in 1999, Bard has granted 157 degrees to participants and enrolled a total of nearly 500 students. The graduates of the Bard program have shown consistent success following their release from prison, choosing a broad range of professions and working toward additional academic and professional degrees. Citing the statistic that the U.S. has the longest, most punitive sentencing structures in the world, 750,000 inmates are released each year and nationwide, out of every 100 prisoners, almost 68 are rearrested within 3 years of release, more than half return to prison. Research indicates that the rate of recidivism falls to less than 22% if prisons offer significant educational opportunity to incarcerated men and women. Fewer than 2% of formally incarcerated Bard students have returned to prison and the estimated cost per person, per year of the BPI program is a small percent of the cost of continuing incarceration (Bard Prison Initiative, 2011).
  • 55. SUCCESSFUL ALTERNATIVES TO 55 Cornell Prison Education Program (New York). This prison education program was established to provide college courses to inmates at a medium- and maximum-security prison in New York. The program involves Cornell faculty and students in educating the country’s increasing incarcerated population. The Cornell Prison Education Program is committed to supporting incarcerated persons’ preparation for successful reentry and academic ambitions (Cornell Prison Education Program, 2011). In the New Bedford Court program, 10 consecutive CLTL educational seminars were evaluated from the first seminar offered in April 1991 through January 1, 1996. This analysis focused on the number of crimes committed by those who completed the program compared to the number of crimes committed by those who did not complete the program. The results indicated an overall 68% decrease in criminal activity between individuals who completed the program and those that did not complete the program (Ste. Pierre, 1996). Other institutions with similar programs include the Bedford Hills College Program in New York, which has graduated 100 students; Ball State, Indiana; The Alabama Prison Arts & Education Project; Georgetown Prison Outreach; Inside-Out Prison Exchange Program at Temple University, Pennsylvania, Indiana; Wesleyan Center for Prison Education; Vassar; Patten University; Columbia; Cornell; Wesleyan; Education Justice Project in Illinois; Lansing Correctional Facility Program, Kansas; and the Prison Studies Project in Massachusetts. The goal of the Prison University Program is to move public policy toward the priority of making increased educational opportunities a priority for individuals with criminal records (Vitale, 2011).
  • 56. SUCCESSFUL ALTERNATIVES TO 56 Linking the educational component and prison reentry programs outside the U.S. prison system to break the cycle of crime. New Zealand: New Zealand allows offenders, victims, and community representatives to come to terms with the crime and create an action plan for the offender to make amends to the victim and community. In New Zealand, this results in less than 10% of offenders being referred back to the court for not complying with the action plan. In 2002, this innovative system was recognized for “reducing recidivism rates while retaining public confidence” and won an International Community Justice Award. Cuba: The Cuban government emphasizes rehabilitation and return to the community more than societal isolation or punishment. In Cuba, prisoners earn a comparable income to that of a free person in the same job, and prisoners are permitted to wear street clothes. In addition, some prisoners are allowed to work in a conditional release program midway through their sentence (sentences less than 5 years), and they work in factories or on farms without divulging their status. In this way, prisoners can visit their families in their homes with no supervision, 2 times a month for up to 3 days per visit. The recidivism for this type of program in Cuba is about 15%. If the Cuban approach were used in the U.S., individuals could be electronically monitored for $10,000 each per year outside prison (compared to the higher yearly cost to house a prisoner) i.e., Missouri has 14,700 nonviolent offenders incarcerated at a cost of more than $16,400 each per year. Nearly 60% of nonviolent offenders are back in prison after 5 years (Vitale, 2011). The average cost across the U.S. to incarcerate an individual for 1 year is $28,817. Some states are much higher, for example the average cost to incarcerate in California is $44,563 per person per year (Skolnick, 2011).
  • 57. SUCCESSFUL ALTERNATIVES TO 57 Great Britain: On July 31, 2006, Great Britain introduced the Offenders’ Learning and Skills Service (OLASS), having completed a 1-year trial in 3 development regions. The OLASS program seeks to integrate the Learning and Skills Council and the National Probation Service to address the educational needs of offenders. The program focuses on improving the educational level and the employability of young offenders. The term employability encompasses not just employment but additional work characteristics such as working as a team member, using good communication skills, being self motivated, and having tolerance for others (The Prince’s Trust, 2007). The Prince’s Trust report estimates that, based on the efforts of other countries, one can estimate that encouraging social development of children and families can decrease crime and for every $1.00 spent, results in returns of $7.16. To effect a change and decrease crime by 10%, $228.00 additional tax dollars per family would need to be spent on incarceration compared to just a $32.00 dollar increase to help at-risk children complete school (http://www.newworldencyclopedia.org/entry/Recidivism).
  • 58. SUCCESSFUL ALTERNATIVES TO 58 Findings Research Purpose The purpose of the research was to demonstrate the decreased costs to the government of alternatives to incarceration (total cost per individual versus total cost of incarceration), and quantify the additional benefits the program components offer in assisting individuals to maintain successful crime- free lives—investigating the correlation between education/literacy and the general prison population and identifying some non-financial additional successes of similar programs throughout the U.S. for individuals prior to incarceration and for individuals who are incarcerated—i.e., secondary successes derived from gaining literacy and the opportunities realized from workforce development education, which sustains a significant decrease in recidivism. This data was developed using the following existing research for prison education programs within and outside the U.S. to demonstrate the correlation between the decreasing return on investment of continuing to fund the prison system at the expense of funding education. The BOT program uses an intelligent approach to crime, using interventions that benefit the community, victims, and offenders. 1. Statistical data analysis from the City of SFDA’s office from the BOT program’s initial startup in 2005 until the recent graduation in July 2011 to quantify the numbers of successful participants of the current BOT program. 2. Statistical data analysis on crime and educational level in California and the U.S. using the 2010 Census and additional data, for the 5-year period of time during which the BOT program has been operational. This data is necessary to support the hypothesis that a correlation between crime and education exists. 3. Statistical data analysis on the educational level of incarcerated individuals in California and the U.S. using available publications and information, for the 5-year period of time during
  • 59. SUCCESSFUL ALTERNATIVES TO 59 which this program has been operational. This data is necessary to support the hypothesis that a correlation between crime and education exists. 4. Statistical data analysis on the educational programs being offered in the California prison system for successful reentry of prisoners. 5. Statistical data analysis on educational and reentry programs being offered in states outside the California prison system for successful reentry of prisoners. 6. Statistical data analysis on educational and reentry programs being offered outside the U.S. to allow successful reentry of prisoners in other countries. Incarceration and Recidivism. For the purposes of this research project, incarceration includes individuals imprisoned in both jails and prisons. In terms of the criminal justice system, recidivism involves committing a crime in spite of being previously punished for committing a crime. For parolees and probationers, recidivism also extends to a technical violation of supervision, i.e., failing a drug test, or not reporting to a parole or probation officer (Pew Center on the States, 2011). Linking Crime/Incarceration and Education. It is undeniable that the negative causal relationship between education and crime is high and the educational attainment levels of prisoners are greatly decreased from those of the non-incarcerated public (Lochner & Moretti, 2004). In addition, 56% of the incarcerated high school completion category comes through completion of a GED, in other words, certification of a graduation equivalent, but not an actual high school education. Linking Recidivism and Education. The average inmate has not attended school beyond the tenth grade and is typically from an educationally and culturally deprived environment. The correlation between criminal activity and low
  • 60. SUCCESSFUL ALTERNATIVES TO 60 levels of education shows that the high school dropout is 5 to 8 times more likely to be incarcerated than an individual that has graduated from college.
  • 61. SUCCESSFUL ALTERNATIVES TO 61 Conclusions and Recommendations The tougher legislation enacted in the 1980s, adopted to protect public safety, has succeeded in increasing incarceration of low-level offenders but not necessarily increasing public safety. These legislative measures, which involve increased prosecution, longer prison sentences, and stiffer punishment for parole and probation violations have resulted in a prison population that has tripled in the last 30 years. Because the data from the last 30 years indicates that the strict legal initiatives resulted in tripling the incarceration rate, we can then infer that approximately two-thirds of the individuals in incarceration during the time frame in 2011 were low-level offenders, prosecuted and sentenced due to tougher sentencing guidelines. In other words, 30 years ago, given the same circumstances, 1.5 million currently incarcerated individuals would not or may not have been imprisoned. The amplified spending and expenditures of incarceration are increasingly impacting U.S. state spending, including education. Additional research is being conducted to examine using justice reinvestment instead of incarceration, and reduction in penalties using a broad range of approaches. The current incarceration growth does not correlate to an increase in crime, or even an increase in the overall population. If the “tough on crime” initiatives resulted in tripling the incarceration rate, we can infer that approximately two-thirds of the individuals incarcerated (1.5 million) during the 2008 time frame were low-level offenders, prosecuted and sentenced due to tougher sentencing guidelines and imprisoned as additional punishment for parole or probation violations. Continued reliance on incarceration is resulting in decreased benefits in crime prevention and no increase in public safety. Reinvestment in justice for low-level offenders is a process designed to help municipalities make informed decisions about how their scarce criminal justice resources are used. Solid choices about incarceration versus reinvestment must be based on data collection and analysis of what contributes to
  • 62. SUCCESSFUL ALTERNATIVES TO 62 criminal justice costs—what comprises the prison population, length of stays, recidivism, and biggest expenditures. Individual states can begin to identify the highest threats to public safety and ensure adequate incarceration space for those individuals posing the greatest public threat; the contributing factors will differ by jurisdiction depending on local populations and sentencing policies. By prioritizing incarceration space, individuals that are not a public safety threat can be diverted from incarceration into other programs. The cost of incarceration is so high, that almost any alternative will be less expensive. Saving money and maintaining public safety should drive the decisions regarding who is and who is not incarcerated. By diverting the money from prosecuting, sentencing, and incarcerating, justice reinvestment allows more cost-effective criminal justice policy decisions and expenditures. Instead of increasing expenditures in incarceration, government officials are questioning whether incarceration is the most beneficial, cost-effective use of resources, locally and on a state-wide level (LaVigne, 2011). Statistical Analysis Using statistical analysis, Tables 9 through 11 show the calculations for the current cost of incarceration and the potential savings for the U.S. overall. The graphs demonstrate the percent of incarceration expense currently being used to house low-level offenders of non-violent crimes who would be eligible for potential alternative options to incarceration. Figures 12 through 14 present a graphic representation of the potential savings of costs for incarceration and the number of individuals, given an alternative option to imprisonment.
  • 63. SUCCESSFUL ALTERNATIVES TO 63 Table 9 Incarceration Data Percent of Low- Level Offenders Total Potentially Not Incarcerated Total Remaining Incarcerated No. Incarcerated 2,300,000 0.66 1,518,000 0.33 759,000.00 Potential Cost Savings of Not Incarcerated Incarceration Cost Cost to Incarcerate $49,000,000,000.00 0.66 $32,340,000,000.00 0.33 $16,170,000,000.00 Cost for Justice Reinvestment $5,000.00 1,500,000.00 $7,500,000,000.00 $24,840,000,000.00 2,300,000.00 66 1,518,000.00 33 759,000.00 48,000,000,000.00 66 32,340,000,000.00 33 16,170,000,000.00 5,000.00 1,500,000.00 7,500,000,000.00 Table 10 Statistical Analysis Point 2,300,000 Rank Percent Point 66 Rank Percent Point 151800 Rank Percent 1 49,000,000,000.00 1 100.00% 2 1,500,000.00 1 100.00% 1 32,340,000,000.00 1 100.00% 2 5,000.00 2 0.00% 1 66.00 2 0.00% 2 7,500,000,000.00 2 0.00%
  • 64. SUCCESSFUL ALTERNATIVES TO 64 FIGURE 13 Total Number Incarcerated 1,518,000 759,000.00 Total Incarcerated 2,300,000 Total potentially not  incarcerated  Total remaining  incarcerated FIGURE 14 Total Cost of Incarceration g 32,340M  16,170M  Total Cost of Incarceration  $49,000,000,000 Revised potential cost to incarcerate: $16,170M Potential cost savings: $32,340M
  • 65. SUCCESSFUL ALTERNATIVES TO 65 TABLE 11 Statistical Analysis Bin Frequency Cumulative % Bin Frequency Cumulative % 66 0 0.00% 1500000 1 50.00% 66 0 0.00% More 1 100.00% 1500000 1 50.00% 66 0 100.00% 1518000 0 50.00% 66 0 100.00% 7500000000 0 50.00% 1518000 0 100.00% 32340000000 0 50.00% 7500000000 0 100.00% More 1 100.00% 32340000000 0 100.00% y FIGURE 15 Graphical Analysis 0.00% 50.00% 100.00% 150.00% 0 0.5 1 1.5 1500000 More 66 66 1518000 750000… 323400… Frequency Bin Histogram Frequency Cumulative %
  • 66. SUCCESSFUL ALTERNATIVES TO 66 Long-Term Economic and Public Safety Impacts of Incarceration Developing a national prisoner reentry (justice reinvestment) program recognizes that public safety is threatened by mass incarceration because it diminishes life-long opportunities by adding a criminal record, further penalizing individuals with no work skills or resources. Justice reinvestment would focus on increasing employment for released prisoners at the same time prison populations are being reduced. Increasing employment promotes long-term negative consequences of criminal punishment and promotes greater economic improvement for poor communities (Western, 2008). Research findings indicate that, in addition to direct costs on the economic system, incarcerated individuals impose additional financial hardships on the overall U.S. economic system, as they are less likely to pay child support, taxes, and victim restitution. Impacts of incarceration on children. State prisoners with children under age 18 is at 55%, and 63% of federal prisoners are parents of children under age 18. In addition to the day-to-day void created by an unavailable parent, children may face increased social obstacles. Parental incarceration creates additional challenges for children and families such as material hardship and financial instability, unstable family structure and relationships, school performance and behavior problems, and in some cases, isolation, stigma, and shame (Annie E. Casey Foundation, 2011). With the average high school graduation level of incarcerated individuals at less than 60%, low- level offenders are even less likely to attain an education greater than high school. Research shows that individuals with parents with no college experience are less likely to go to college, particularly a 4-year college or university, than their peers. The National Education Longitudinal Study shows that 85% of students whose parents had college degrees enrolled in post-secondary education the year after graduating from high school, as opposed to 47% of students whose parents did not attend college (Engle,
  • 67. SUCCESSFUL ALTERNATIVES TO 67 2011). Recommendations for Future Research Quantifying the potential financial savings of justice reinvestment alternatives to incarceration is a simple exercise in arithmetic. Quantifying the cost in terms of social return on investment by investigating the secondary benefits is more difficult, as terms such as “quality of life” are difficult to standardize and quantify. One recommendation for additional study might be to follow and observe a group of BOT participants who enroll in the BOT program and remain enrolled in the program through graduation compared to a group of participants who either chose not to enroll in the BOT program and were incarcerated or failed the BOT program and were subsequently incarcerated. Identifying the life challenges and the lives of these individuals holistically, in terms of their communities, families, and potential future opportunities would be a viable option for justifying and promoting future justice reinvestment programs. Additional research could also be conducted showing the overall economic payback to the U.S. tax system for individuals that work legally, pay income taxes, and do not file for public assistance for food, housing, and medical needs. This research would further demonstrate the ratio of lifetime contribution into the state and federal tax system, versus direct cost to incarcerate and additional public assistance needed for individuals who are continuously incarcerated over their lifetime and the economic toll those individuals and their families take on the U.S. economic system. In reviewing the international statistics, the rate of recidivism in Australia is significantly lower than comparable countries and drastically lower than the U.S. Additional research could be conducted to determine the differences in treatment and opportunities for offenders in Australia and the U.S. to identify the factors leading to successful transition out of the prison system into society in Australia. This research adequately demonstrated the decreased costs to the government of incarceration
  • 68. SUCCESSFUL ALTERNATIVES TO 68 (total cost per individual for justice reinvestment versus total cost of incarceration) and quantified the additional benefits that program components from programs such as Back on Track offer in assisting individuals to maintain successful crime-free lives. By investigating the correlation between education/literacy and the general prison population, a clear link between education level and potential to commit low-level crime was established. Showing the comparison of the U.S. data and justice practices with other countries, demonstrates that the high incarceration rate in the U.S. is not typical of any other country and the crime rate in the U.S. does not correspond to its high incarceration rates. This data shows that approaches used in other countries, such as coordinating efforts with offender services such as health and housing and community organizations, coupled with reducing prison admissions and lengths of incarceration by offering reinvestment in justice, is more financial beneficial and increases public safety.