SlideShare a Scribd company logo
1 of 11
Download to read offline
Stock Repurchases in the United States
Executive Summary
Please note all data is based on Calendar Quarters, NOT Fiscal Quarters. Fiscal quarters provided upon request.
* Our metric is reflective of stock repurchases as part of an authorized repurchase plan. We attempt to exclude
share repurchases for employee incentive plans, or other purposes that are not related to returning value to
shareholders.
** Observations only include firms that have assets greater than or equal to $100 million
1
• Calcbench analyzed 25 quarterly periods from Q1 2012 through Q1
2018
• 22,040 firm quarter observations collected** (e.g. AAPL is in the
dataset 19 times, in 6 quarters AAPL did not buy back shares)
• 1481 observations were firm quarters with share repurchases
greater than $500 Million
• Total dollars spent on share repurchases for the 25 periods is $3.12
Trillion
• The average share repurchase per firm quarter is $141.5 million
• 701 quarterly share repurchases greater than or equal to $1B
• Only 3.2% of all repurchasing programs
• BUT 48.7% of all repurchasing dollars
What can our data tell you about share repurchases and associated
trends?*
Get Behind The Data
Get Behind The Data
2
Dollars Spent on Share Repurchases By Quarter
($ Billion)
202
1,004
-
200
400
600
800
1,000
1,200
-
40
80
120
160
200
2012_Q1
2012_Q2
2012_Q3
2012_Q4
2013_Q1
2013_Q2
2013_Q3
2013_Q4
2014_Q1
2014_Q2
2014_Q3
2014_Q4
2015_Q1
2015_Q2
2015_Q3
2015_Q4
2016_Q1
2016_Q2
2016_Q3
2016_Q4
2017_Q1
2017_Q2
2017_Q3
2017_Q4
2018_Q1
FirmCount
DollarsSpent($B)
Dollars Spent on Share Repurchases ($ Billion) Firm Count
Please note all data is based on Calendar Quarters, NOT Fiscal Quarters. Fiscal quarters provided upon request.
**Our metric is reflective of stock repurchases as part of an authorized repurchase plan. We attempt to exclude share
repurchases for employee incentive plans, or other purposes that are not related to returning value to shareholders.
3
Frequency of Firms in Share Repurchase Brackets (2012_Q1 - 2018_Q1)
1,948
8,895
6,346
2,138
1,232
780 690
11
-
1,000
2,000
3,000
4,000
5,000
6,000
7,000
8,000
9,000
10,000
Frequency
Share Repurchase brackets
Note: these values have accumulated over the 25 quarterly periods from 2012 Q1 through 2018 Q1.
Please note all data is based on Calendar Quarters, NOT Fiscal Quarters. Fiscal quarters provided upon request.
**Our metric is reflective of stock repurchases as part of an authorized repurchase plan. We attempt to exclude share
repurchases for employee incentive plans, or other purposes that are not related to returning value to shareholders.
Get Behind The Data
4
Median Dollars Spent on Share Repurchases vs. Mean
Dollars Spent on Share Repurchases ($ Million)
Notes on graph:
*Median Repurchase Value calculated by taking Median Value of Total Share Repurchases in each calendar quarter.
*Mean Repurchase Value calculated by taking Average Value of Total Share Repurchases in each calendar quarter.
$11
$201
$-
$50
$100
$150
$200
2012_Q1
2012_Q2
2012_Q3
2012_Q4
2013_Q1
2013_Q2
2013_Q3
2013_Q4
2014_Q1
2014_Q2
2014_Q3
2014_Q4
2015_Q1
2015_Q2
2015_Q3
2015_Q4
2016_Q1
2016_Q2
2016_Q3
2016_Q4
2017_Q1
2017_Q2
2017_Q3
2017_Q4
2018_Q1
Median Share Repurchases Mean Share Repurchases
Please note all data is based on Calendar Quarters, NOT Fiscal Quarters. Fiscal quarters provided upon request.
**Our metric is reflective of stock repurchases as part of an authorized repurchase plan. We attempt to exclude share
repurchases for employee incentive plans, or other purposes that are not related to returning value to shareholders.
Get Behind The Data
5
The table below represents the biggest buyers of their own stock over the last 25 quarters.
Firm Level Share Repurchases
*Avg. Daily Repurchase based on 63 day quarters
39.9%
0.0%
5.0%
10.0%
15.0%
20.0%
25.0%
30.0%
35.0%
40.0%
45.0%
2012
Q1
2012
Q2
2012
Q3
2012
Q4
2013
Q1
2013
Q2
2013
Q3
2013
Q4
2014
Q1
2014
Q2
2014
Q3
2014
Q4
2015
Q1
2015
Q2
2015
Q3
2015
Q4
2016
Q1
2016
Q2
2016
Q3
2016
Q4
2017
Q1
2017
Q2
2017
Q3
2017
Q4
2018
Q1
PERCENTOFTOTALREPURCHASES
Firm Level Buybacks:
Top 10 Repurchasers as Percent of Total
Company DollarsRepurchased (Billions) Avg. DailyRepurchase (Millions)
AppleInc 194.59$ 123.55$
Microsoft Corp 61.43$ 39.00$
MotorolaSolutions, Inc. 58.99$ 37.46$
Exxon Mobil Corp 56.55$ 35.91$
OracleCorp 53.48$ 33.95$
International BusinessMachinesCorp 52.66$ 33.43$
WellsFargo & Company/MN 48.44$ 30.75$
American International Group Inc 47.22$ 29.98$
Jpmorgan Chase& Co 47.07$ 29.89$
Walt Disney Co/ 38.40$ 24.38$
Cisco Systems, Inc. 38.17$ 24.23$
Federal HomeLoan Bank ofAtlanta 36.82$ 23.38$
BoeingCo 34.79$ 22.09$
Goldman SachsGroup Inc 34.07$ 21.63$
Citigroup Inc 33.79$ 21.45$
Please note all data is based on Calendar Quarters, NOT Fiscal Quarters. Fiscal quarters provided upon request.
**Our metric is reflective of stock repurchases as part of an authorized repurchase plan. We attempt to exclude share
repurchases for employee incentive plans, or other purposes that are not related to returning value to shareholders.
Get Behind The Data
6
Share Repurchase Yields
A share repurchase yield is the total dollars bought back divided by the market
capitalization of the firm.
Smallest in the top
10 (Still big though)
Biggest
Repurchases
-
2.00
4.00
6.00
8.00
10.00
12.00
0% 5% 10% 15% 20% 25% 30%
Ranks(from1-10)
Repurchase Yields for top 10 firms
Top 10 Firms by Quarter (2017_Q3, 2017_Q4, 2018_Q1)
2017_Q3 2017_Q4 2018_Q1
Please note all data is based on Calendar Quarters, NOT Fiscal Quarters. Fiscal quarters provided upon request.
**Our metric is reflective of stock repurchases as part of an authorized repurchase plan. We attempt to exclude share
repurchases for employee incentive plans, or other purposes that are not related to returning value to shareholders.
Smallest Repurchase Yields in
the top 10 (still large though)
Largest Repurchase Yields
Get Behind The Data
7
Share Repurchase Yields For Top 10 Firms
19%
0% 5% 10% 15% 20% 25%
Entercom Communications Corp
M I Homes Inc
Terex Corp
Citi Trends Inc
Marinemax Inc
Winmark Corp
Dominos Pizza Inc
Autonation, Inc.
Hewlett Packard Enterprise Co
Owens Realty Mortgage, Inc.
BuyBack Yields for Top 10 Firms (2017_Q3)
24%
0% 5% 10% 15% 20% 25% 30%
Voya Financial, Inc.
Ncr Corp
Owens Realty Mortgage, Inc.
Herbalife Nutrition Ltd.
Sealed Air Corp/DE
Greenbrier Companies Inc
Goodyear Tire & Rubber Co /OH/
Greenhill & Co Inc
ProPhase Labs, Inc.
Mbia Inc
BuyBack Yield for Top 10 Firms (2017_Q4)
12%
0% 2% 4% 6% 8% 10% 12% 14%
Ellington Residential Mortgage REIT
Taylor Morrison Home Corp
Phillips 66
Juniper Networks Inc
Kroger Co
Piedmont Office Realty Trust, Inc.
Amgen Inc
Netscout Systems Inc
Dunkin' Brands Group, Inc.
Greenhill & Co Inc
BuyBack Yield for Top 10 Firms (2018_Q1)
Get Behind The Data
Please note all data is based on Calendar Quarters, NOT Fiscal Quarters. Fiscal quarters provided upon request.
**Our metric is reflective of stock repurchases as part of an authorized repurchase plan. We attempt to exclude share
repurchases for employee incentive plans, or other purposes that are not related to returning value to shareholders.
8
Percentage of Share Repurchases by Top 5 Firms
13%
2%
4%
3%
3%
75%
Percentage of Top 5 Share Repurchasing Firms
(2017_Q3) Apple Inc
Charter Communications,
Inc. /MO/
Citigroup Inc
Jpmorgan Chase & Co
Walgreens Boots Alliance,
Inc.
The Rest
4% 4%
3%
4%
4%
82%
Percentage of Top 5 Share Repurchasing Firms
(2017_Q4)
Apple Inc
Bank Of America Corp /DE/
Cisco Systems, Inc.
Citigroup Inc
Jpmorgan Chase & Co
The Rest
5%
12%
3%
3%
6%
70%
Percentage of Top 5 Share Repurchasing Firms
(2018_Q1)
Amgen Inc
Apple Inc
Cisco Systems, Inc.
Microsoft Corp
Motorola Solutions, Inc.
The Rest
Please note all data is based on Calendar Quarters, NOT Fiscal Quarters. Fiscal quarters provided upon request.
**Our metric is reflective of stock repurchases as part of an authorized repurchase plan. We attempt to exclude share
repurchases for employee incentive plans, or other purposes that are not related to returning value to shareholders.
Get Behind The Data
9
Looking at Related Metrics
Share Repurchases can potentially serve as alternative ways for companies to
increase value for stockholders, as dividends do.
Some analysts opposed to the increase of share repurchases argue that companies
should contribute more excess cash to CapEx and R&D Expenses.
$202
$82
$-
$50
$100
$150
$200
Total Share Repurchases vs. Payments of Dividends
($ Billion)
Total Share Repurchases Total Payments of Dividends
$202
$102
$48
$-
$50
$100
$150
$200
Total Share Repurchases vs. CapEx and R&D Expenses
($ Billion)
Total Share Repurchases Total CapEx Total Research and Development
Please note all data is based on Calendar Quarters, NOT Fiscal Quarters. Fiscal quarters provided upon request.
**Our metric is reflective of stock repurchases as part of an authorized repurchase plan. We attempt to exclude share
repurchases for employee incentive plans, or other purposes that are not related to returning value to shareholders.
Get Behind The Data
About the Authors
CALCBENCH PREMIUM SUITE
10
Pranav Ghai
CEO & CO-FOUNDER
Pranav is an analytics professional whose
career has been based in financial services,
with time spent at Morgan Stanley and ITG.
He is also a new addition to the board of
directors at XBRL-US. Pranav graduated
with a BS from Bates College and an MS in
Applied Mathematics from the Courant
Institute at New York University.
Jeff Kahle
INTERN
Jeff is a student at Bates College, scheduled
to graduate in 2019, who matriculated from
Choate Rosemary Hall in Wallingford, CT. He
works as the Business Manager of the Bates
Student, and he is active in the Investment
Club, where he serves as the Director of
Equity Research. Jeff also likes to spend time
as a DJ on WRBC Bates College Radio.
Get Behind The Data
Try Calcbench Today!
ABOUT THIS REPORT: This report was created using data analyzed via
Calcbench’s Premium Suite, an online interactive platform that helps finance
leaders access and analyze financial data thoroughly and efficiently.
Our accessible and intuitive platform can aid in better understanding
competitor financials, identifying potential risk areas, analyzing trends across
industry sectors, or conducting more effective due diligence.
Sign up for a 2 week free trial at
www.calcbench.com/trial
or contact us at us@calcbench.com or via www.calcbench.com
CALCBENCH PREMIUM SUITE
11
Get Behind The Data

More Related Content

What's hot

Mgmt+640+essay modupe
Mgmt+640+essay modupeMgmt+640+essay modupe
Mgmt+640+essay modupeModupe Sarratt
 
Study to investigate the best working capital management strategy to ensure h...
Study to investigate the best working capital management strategy to ensure h...Study to investigate the best working capital management strategy to ensure h...
Study to investigate the best working capital management strategy to ensure h...Charm Rammandala
 
Chapter 05(a) financial analysis-ratio and other analysis
Chapter 05(a) financial analysis-ratio and other analysisChapter 05(a) financial analysis-ratio and other analysis
Chapter 05(a) financial analysis-ratio and other analysisAl Sabbir
 
Analysis and interpretation of ratios
Analysis and interpretation of ratiosAnalysis and interpretation of ratios
Analysis and interpretation of ratiosBabasab Patil
 
Analytics that Work - Tools for Creating Value and Focusing Performance
Analytics that Work - Tools for Creating Value and Focusing PerformanceAnalytics that Work - Tools for Creating Value and Focusing Performance
Analytics that Work - Tools for Creating Value and Focusing PerformanceNational Pork Board
 
Motivations behind the mergers & acquisitions by larger corporations
Motivations behind the mergers & acquisitions by larger corporationsMotivations behind the mergers & acquisitions by larger corporations
Motivations behind the mergers & acquisitions by larger corporationsCharm Rammandala
 
Ratio analysis
Ratio analysisRatio analysis
Ratio analysisSumit Sahu
 
Managerial Accounting Assignment 4 1 Adler, Inc. is considering ...
Managerial Accounting Assignment 4 1 Adler, Inc. is considering ...Managerial Accounting Assignment 4 1 Adler, Inc. is considering ...
Managerial Accounting Assignment 4 1 Adler, Inc. is considering ...butest
 
ratio analysis cipla ltd
ratio analysis cipla ltdratio analysis cipla ltd
ratio analysis cipla ltdste1fire
 
Measuring And Controlling Assets employed
Measuring And Controlling Assets employedMeasuring And Controlling Assets employed
Measuring And Controlling Assets employedanshagrawal2121
 
Small Cap Growth Product Sheet Quarter 1, 2015
Small Cap Growth Product Sheet Quarter 1, 2015Small Cap Growth Product Sheet Quarter 1, 2015
Small Cap Growth Product Sheet Quarter 1, 2015Knelman Asset Management
 
Financial Impact of MRO Inventory Optimization
Financial Impact of MRO Inventory OptimizationFinancial Impact of MRO Inventory Optimization
Financial Impact of MRO Inventory Optimizationrjenner
 
Chapter 02 strategy analysis
Chapter 02 strategy analysisChapter 02 strategy analysis
Chapter 02 strategy analysisAl Sabbir
 
RATIO ANALYSIS
RATIO ANALYSISRATIO ANALYSIS
RATIO ANALYSISNikhil Priya
 

What's hot (19)

Mgmt+640+essay modupe
Mgmt+640+essay modupeMgmt+640+essay modupe
Mgmt+640+essay modupe
 
Study to investigate the best working capital management strategy to ensure h...
Study to investigate the best working capital management strategy to ensure h...Study to investigate the best working capital management strategy to ensure h...
Study to investigate the best working capital management strategy to ensure h...
 
Chapter 05(a) financial analysis-ratio and other analysis
Chapter 05(a) financial analysis-ratio and other analysisChapter 05(a) financial analysis-ratio and other analysis
Chapter 05(a) financial analysis-ratio and other analysis
 
Analysis and interpretation of ratios
Analysis and interpretation of ratiosAnalysis and interpretation of ratios
Analysis and interpretation of ratios
 
Analytics that Work - Tools for Creating Value and Focusing Performance
Analytics that Work - Tools for Creating Value and Focusing PerformanceAnalytics that Work - Tools for Creating Value and Focusing Performance
Analytics that Work - Tools for Creating Value and Focusing Performance
 
2 ratio analysis
2 ratio analysis2 ratio analysis
2 ratio analysis
 
Motivations behind the mergers & acquisitions by larger corporations
Motivations behind the mergers & acquisitions by larger corporationsMotivations behind the mergers & acquisitions by larger corporations
Motivations behind the mergers & acquisitions by larger corporations
 
Ratio analysis
Ratio analysisRatio analysis
Ratio analysis
 
Managerial Accounting Assignment 4 1 Adler, Inc. is considering ...
Managerial Accounting Assignment 4 1 Adler, Inc. is considering ...Managerial Accounting Assignment 4 1 Adler, Inc. is considering ...
Managerial Accounting Assignment 4 1 Adler, Inc. is considering ...
 
ratio analysis cipla ltd
ratio analysis cipla ltdratio analysis cipla ltd
ratio analysis cipla ltd
 
Measuring And Controlling Assets employed
Measuring And Controlling Assets employedMeasuring And Controlling Assets employed
Measuring And Controlling Assets employed
 
Infosys - Ratio analysis
Infosys - Ratio analysisInfosys - Ratio analysis
Infosys - Ratio analysis
 
Financial ratios
Financial ratiosFinancial ratios
Financial ratios
 
Small Cap Growth Product Sheet Quarter 1, 2015
Small Cap Growth Product Sheet Quarter 1, 2015Small Cap Growth Product Sheet Quarter 1, 2015
Small Cap Growth Product Sheet Quarter 1, 2015
 
Financial Impact of MRO Inventory Optimization
Financial Impact of MRO Inventory OptimizationFinancial Impact of MRO Inventory Optimization
Financial Impact of MRO Inventory Optimization
 
Chapter 02 strategy analysis
Chapter 02 strategy analysisChapter 02 strategy analysis
Chapter 02 strategy analysis
 
Ratios
RatiosRatios
Ratios
 
Accounting Ratios
Accounting RatiosAccounting Ratios
Accounting Ratios
 
RATIO ANALYSIS
RATIO ANALYSISRATIO ANALYSIS
RATIO ANALYSIS
 

Similar to Stock Repurchases in the United States

Share Buybacks
Share Buybacks Share Buybacks
Share Buybacks Pranav Ghai
 
Promacs ppt Tamplate 2022[53] - Read-Only.pptx
Promacs ppt Tamplate 2022[53]  -  Read-Only.pptxPromacs ppt Tamplate 2022[53]  -  Read-Only.pptx
Promacs ppt Tamplate 2022[53] - Read-Only.pptxMohamed Saad
 
Financial analisys Easton capitulo ROE.pptx
Financial analisys Easton capitulo ROE.pptxFinancial analisys Easton capitulo ROE.pptx
Financial analisys Easton capitulo ROE.pptxJUANCARLOSRUBIOSEVIL
 
Strategic Management Ch02
Strategic Management Ch02Strategic Management Ch02
Strategic Management Ch02Chuong Nguyen
 
6 ratio analysis
6   ratio analysis6   ratio analysis
6 ratio analysisJohn McSherry
 
20180620 sauc oppenheimer consumer conference widescreen final
20180620 sauc oppenheimer consumer conference widescreen final20180620 sauc oppenheimer consumer conference widescreen final
20180620 sauc oppenheimer consumer conference widescreen finaldrhincorporated
 
Acc 225 week 9 capstone discussion question
Acc 225 week 9 capstone discussion questionAcc 225 week 9 capstone discussion question
Acc 225 week 9 capstone discussion questionLoremIpsumdsd
 
The Age of Alignment Part III: Moving From Theory to Practice
The Age of Alignment Part III: Moving From Theory to PracticeThe Age of Alignment Part III: Moving From Theory to Practice
The Age of Alignment Part III: Moving From Theory to PracticePearl Meyer
 
Market Perspective - May 2018
Market Perspective - May 2018Market Perspective - May 2018
Market Perspective - May 2018Mark Biegel
 
Manitowoc q1 2018 earnings call presentation 5 8-2018-vf
Manitowoc q1 2018 earnings call presentation  5 8-2018-vfManitowoc q1 2018 earnings call presentation  5 8-2018-vf
Manitowoc q1 2018 earnings call presentation 5 8-2018-vfManitowocCompany
 
3 q18 earnings deck final_ready_for_release
3 q18 earnings deck final_ready_for_release3 q18 earnings deck final_ready_for_release
3 q18 earnings deck final_ready_for_releaseadpinvestors
 
L 9 chapter 9 long-term financial planning and corporate growth
L 9  chapter 9 long-term financial planning and corporate growthL 9  chapter 9 long-term financial planning and corporate growth
L 9 chapter 9 long-term financial planning and corporate growthUniversity of Jaen Spain
 
01 fs analysis
01 fs analysis01 fs analysis
01 fs analysisLeeLee72402
 
Financial Accounting
Financial AccountingFinancial Accounting
Financial AccountingNavin Bafna
 
Clorox investor-presentation-(fy19 q1)
Clorox investor-presentation-(fy19 q1)Clorox investor-presentation-(fy19 q1)
Clorox investor-presentation-(fy19 q1)cloroxir2016
 
Solvency And Asset Recommendations 2011
Solvency And Asset Recommendations 2011Solvency And Asset Recommendations 2011
Solvency And Asset Recommendations 2011mrittmayer
 
John DeereOther Financial Information 2008 1st
 John DeereOther Financial Information 2008 1st John DeereOther Financial Information 2008 1st
John DeereOther Financial Information 2008 1stfinance11
 

Similar to Stock Repurchases in the United States (20)

Share Buybacks
Share Buybacks Share Buybacks
Share Buybacks
 
Promacs ppt Tamplate 2022[53] - Read-Only.pptx
Promacs ppt Tamplate 2022[53]  -  Read-Only.pptxPromacs ppt Tamplate 2022[53]  -  Read-Only.pptx
Promacs ppt Tamplate 2022[53] - Read-Only.pptx
 
Financial analisys Easton capitulo ROE.pptx
Financial analisys Easton capitulo ROE.pptxFinancial analisys Easton capitulo ROE.pptx
Financial analisys Easton capitulo ROE.pptx
 
Strategic Management Ch02
Strategic Management Ch02Strategic Management Ch02
Strategic Management Ch02
 
6 ratio analysis
6   ratio analysis6   ratio analysis
6 ratio analysis
 
C3
C3C3
C3
 
20180620 sauc oppenheimer consumer conference widescreen final
20180620 sauc oppenheimer consumer conference widescreen final20180620 sauc oppenheimer consumer conference widescreen final
20180620 sauc oppenheimer consumer conference widescreen final
 
Acc 225 week 9 capstone discussion question
Acc 225 week 9 capstone discussion questionAcc 225 week 9 capstone discussion question
Acc 225 week 9 capstone discussion question
 
The Age of Alignment Part III: Moving From Theory to Practice
The Age of Alignment Part III: Moving From Theory to PracticeThe Age of Alignment Part III: Moving From Theory to Practice
The Age of Alignment Part III: Moving From Theory to Practice
 
Market Perspective - May 2018
Market Perspective - May 2018Market Perspective - May 2018
Market Perspective - May 2018
 
Manitowoc q1 2018 earnings call presentation 5 8-2018-vf
Manitowoc q1 2018 earnings call presentation  5 8-2018-vfManitowoc q1 2018 earnings call presentation  5 8-2018-vf
Manitowoc q1 2018 earnings call presentation 5 8-2018-vf
 
3 q18 earnings deck final_ready_for_release
3 q18 earnings deck final_ready_for_release3 q18 earnings deck final_ready_for_release
3 q18 earnings deck final_ready_for_release
 
Nolen bootcamp
Nolen bootcampNolen bootcamp
Nolen bootcamp
 
L 9 chapter 9 long-term financial planning and corporate growth
L 9  chapter 9 long-term financial planning and corporate growthL 9  chapter 9 long-term financial planning and corporate growth
L 9 chapter 9 long-term financial planning and corporate growth
 
01 fs analysis
01 fs analysis01 fs analysis
01 fs analysis
 
Financial Accounting
Financial AccountingFinancial Accounting
Financial Accounting
 
Clorox investor-presentation-(fy19 q1)
Clorox investor-presentation-(fy19 q1)Clorox investor-presentation-(fy19 q1)
Clorox investor-presentation-(fy19 q1)
 
Solvency And Asset Recommendations 2011
Solvency And Asset Recommendations 2011Solvency And Asset Recommendations 2011
Solvency And Asset Recommendations 2011
 
John DeereOther Financial Information 2008 1st
 John DeereOther Financial Information 2008 1st John DeereOther Financial Information 2008 1st
John DeereOther Financial Information 2008 1st
 
Chap003.ppt
Chap003.pptChap003.ppt
Chap003.ppt
 

Recently uploaded

Independent Lucknow Call Girls 8923113531WhatsApp Lucknow Call Girls make you...
Independent Lucknow Call Girls 8923113531WhatsApp Lucknow Call Girls make you...Independent Lucknow Call Girls 8923113531WhatsApp Lucknow Call Girls make you...
Independent Lucknow Call Girls 8923113531WhatsApp Lucknow Call Girls make you...makika9823
 
call girls in Nand Nagri (DELHI) 🔝 >༒9953330565🔝 genuine Escort Service 🔝✔️✔️
call girls in  Nand Nagri (DELHI) 🔝 >༒9953330565🔝 genuine Escort Service 🔝✔️✔️call girls in  Nand Nagri (DELHI) 🔝 >༒9953330565🔝 genuine Escort Service 🔝✔️✔️
call girls in Nand Nagri (DELHI) 🔝 >༒9953330565🔝 genuine Escort Service 🔝✔️✔️9953056974 Low Rate Call Girls In Saket, Delhi NCR
 
The Economic History of the U.S. Lecture 17.pdf
The Economic History of the U.S. Lecture 17.pdfThe Economic History of the U.S. Lecture 17.pdf
The Economic History of the U.S. Lecture 17.pdfGale Pooley
 
Call US 📞 9892124323 ✅ Kurla Call Girls In Kurla ( Mumbai ) secure service
Call US 📞 9892124323 ✅ Kurla Call Girls In Kurla ( Mumbai ) secure serviceCall US 📞 9892124323 ✅ Kurla Call Girls In Kurla ( Mumbai ) secure service
Call US 📞 9892124323 ✅ Kurla Call Girls In Kurla ( Mumbai ) secure servicePooja Nehwal
 
20240417-Calibre-April-2024-Investor-Presentation.pdf
20240417-Calibre-April-2024-Investor-Presentation.pdf20240417-Calibre-April-2024-Investor-Presentation.pdf
20240417-Calibre-April-2024-Investor-Presentation.pdfAdnet Communications
 
Monthly Market Risk Update: April 2024 [SlideShare]
Monthly Market Risk Update: April 2024 [SlideShare]Monthly Market Risk Update: April 2024 [SlideShare]
Monthly Market Risk Update: April 2024 [SlideShare]Commonwealth
 
VVIP Pune Call Girls Katraj (7001035870) Pune Escorts Nearby with Complete Sa...
VVIP Pune Call Girls Katraj (7001035870) Pune Escorts Nearby with Complete Sa...VVIP Pune Call Girls Katraj (7001035870) Pune Escorts Nearby with Complete Sa...
VVIP Pune Call Girls Katraj (7001035870) Pune Escorts Nearby with Complete Sa...Call Girls in Nagpur High Profile
 
20240429 Calibre April 2024 Investor Presentation.pdf
20240429 Calibre April 2024 Investor Presentation.pdf20240429 Calibre April 2024 Investor Presentation.pdf
20240429 Calibre April 2024 Investor Presentation.pdfAdnet Communications
 
Malad Call Girl in Services 9892124323 | ₹,4500 With Room Free Delivery
Malad Call Girl in Services  9892124323 | ₹,4500 With Room Free DeliveryMalad Call Girl in Services  9892124323 | ₹,4500 With Room Free Delivery
Malad Call Girl in Services 9892124323 | ₹,4500 With Room Free DeliveryPooja Nehwal
 
Instant Issue Debit Cards - School Designs
Instant Issue Debit Cards - School DesignsInstant Issue Debit Cards - School Designs
Instant Issue Debit Cards - School Designsegoetzinger
 
VIP Call Girls Thane Sia 8617697112 Independent Escort Service Thane
VIP Call Girls Thane Sia 8617697112 Independent Escort Service ThaneVIP Call Girls Thane Sia 8617697112 Independent Escort Service Thane
VIP Call Girls Thane Sia 8617697112 Independent Escort Service ThaneCall girls in Ahmedabad High profile
 
Quarter 4- Module 3 Principles of Marketing
Quarter 4- Module 3 Principles of MarketingQuarter 4- Module 3 Principles of Marketing
Quarter 4- Module 3 Principles of MarketingMaristelaRamos12
 
VIP Call Girls LB Nagar ( Hyderabad ) Phone 8250192130 | ₹5k To 25k With Room...
VIP Call Girls LB Nagar ( Hyderabad ) Phone 8250192130 | ₹5k To 25k With Room...VIP Call Girls LB Nagar ( Hyderabad ) Phone 8250192130 | ₹5k To 25k With Room...
VIP Call Girls LB Nagar ( Hyderabad ) Phone 8250192130 | ₹5k To 25k With Room...Suhani Kapoor
 
Call Girls In Yusuf Sarai Women Seeking Men 9654467111
Call Girls In Yusuf Sarai Women Seeking Men 9654467111Call Girls In Yusuf Sarai Women Seeking Men 9654467111
Call Girls In Yusuf Sarai Women Seeking Men 9654467111Sapana Sha
 
OAT_RI_Ep19 WeighingTheRisks_Apr24_TheYellowMetal.pptx
OAT_RI_Ep19 WeighingTheRisks_Apr24_TheYellowMetal.pptxOAT_RI_Ep19 WeighingTheRisks_Apr24_TheYellowMetal.pptx
OAT_RI_Ep19 WeighingTheRisks_Apr24_TheYellowMetal.pptxhiddenlevers
 
Best VIP Call Girls Noida Sector 18 Call Me: 8448380779
Best VIP Call Girls Noida Sector 18 Call Me: 8448380779Best VIP Call Girls Noida Sector 18 Call Me: 8448380779
Best VIP Call Girls Noida Sector 18 Call Me: 8448380779Delhi Call girls
 
Russian Call Girls In Gtb Nagar (Delhi) 9711199012 💋✔💕😘 Naughty Call Girls Se...
Russian Call Girls In Gtb Nagar (Delhi) 9711199012 💋✔💕😘 Naughty Call Girls Se...Russian Call Girls In Gtb Nagar (Delhi) 9711199012 💋✔💕😘 Naughty Call Girls Se...
Russian Call Girls In Gtb Nagar (Delhi) 9711199012 💋✔💕😘 Naughty Call Girls Se...shivangimorya083
 
High Class Call Girls Nagpur Grishma Call 7001035870 Meet With Nagpur Escorts
High Class Call Girls Nagpur Grishma Call 7001035870 Meet With Nagpur EscortsHigh Class Call Girls Nagpur Grishma Call 7001035870 Meet With Nagpur Escorts
High Class Call Girls Nagpur Grishma Call 7001035870 Meet With Nagpur Escortsranjana rawat
 
05_Annelore Lenoir_Docbyte_MeetupDora&Cybersecurity.pptx
05_Annelore Lenoir_Docbyte_MeetupDora&Cybersecurity.pptx05_Annelore Lenoir_Docbyte_MeetupDora&Cybersecurity.pptx
05_Annelore Lenoir_Docbyte_MeetupDora&Cybersecurity.pptxFinTech Belgium
 

Recently uploaded (20)

Independent Lucknow Call Girls 8923113531WhatsApp Lucknow Call Girls make you...
Independent Lucknow Call Girls 8923113531WhatsApp Lucknow Call Girls make you...Independent Lucknow Call Girls 8923113531WhatsApp Lucknow Call Girls make you...
Independent Lucknow Call Girls 8923113531WhatsApp Lucknow Call Girls make you...
 
call girls in Nand Nagri (DELHI) 🔝 >༒9953330565🔝 genuine Escort Service 🔝✔️✔️
call girls in  Nand Nagri (DELHI) 🔝 >༒9953330565🔝 genuine Escort Service 🔝✔️✔️call girls in  Nand Nagri (DELHI) 🔝 >༒9953330565🔝 genuine Escort Service 🔝✔️✔️
call girls in Nand Nagri (DELHI) 🔝 >༒9953330565🔝 genuine Escort Service 🔝✔️✔️
 
The Economic History of the U.S. Lecture 17.pdf
The Economic History of the U.S. Lecture 17.pdfThe Economic History of the U.S. Lecture 17.pdf
The Economic History of the U.S. Lecture 17.pdf
 
Call US 📞 9892124323 ✅ Kurla Call Girls In Kurla ( Mumbai ) secure service
Call US 📞 9892124323 ✅ Kurla Call Girls In Kurla ( Mumbai ) secure serviceCall US 📞 9892124323 ✅ Kurla Call Girls In Kurla ( Mumbai ) secure service
Call US 📞 9892124323 ✅ Kurla Call Girls In Kurla ( Mumbai ) secure service
 
20240417-Calibre-April-2024-Investor-Presentation.pdf
20240417-Calibre-April-2024-Investor-Presentation.pdf20240417-Calibre-April-2024-Investor-Presentation.pdf
20240417-Calibre-April-2024-Investor-Presentation.pdf
 
Monthly Market Risk Update: April 2024 [SlideShare]
Monthly Market Risk Update: April 2024 [SlideShare]Monthly Market Risk Update: April 2024 [SlideShare]
Monthly Market Risk Update: April 2024 [SlideShare]
 
VVIP Pune Call Girls Katraj (7001035870) Pune Escorts Nearby with Complete Sa...
VVIP Pune Call Girls Katraj (7001035870) Pune Escorts Nearby with Complete Sa...VVIP Pune Call Girls Katraj (7001035870) Pune Escorts Nearby with Complete Sa...
VVIP Pune Call Girls Katraj (7001035870) Pune Escorts Nearby with Complete Sa...
 
20240429 Calibre April 2024 Investor Presentation.pdf
20240429 Calibre April 2024 Investor Presentation.pdf20240429 Calibre April 2024 Investor Presentation.pdf
20240429 Calibre April 2024 Investor Presentation.pdf
 
Malad Call Girl in Services 9892124323 | ₹,4500 With Room Free Delivery
Malad Call Girl in Services  9892124323 | ₹,4500 With Room Free DeliveryMalad Call Girl in Services  9892124323 | ₹,4500 With Room Free Delivery
Malad Call Girl in Services 9892124323 | ₹,4500 With Room Free Delivery
 
Instant Issue Debit Cards - School Designs
Instant Issue Debit Cards - School DesignsInstant Issue Debit Cards - School Designs
Instant Issue Debit Cards - School Designs
 
VIP Call Girls Thane Sia 8617697112 Independent Escort Service Thane
VIP Call Girls Thane Sia 8617697112 Independent Escort Service ThaneVIP Call Girls Thane Sia 8617697112 Independent Escort Service Thane
VIP Call Girls Thane Sia 8617697112 Independent Escort Service Thane
 
Veritas Interim Report 1 January–31 March 2024
Veritas Interim Report 1 January–31 March 2024Veritas Interim Report 1 January–31 March 2024
Veritas Interim Report 1 January–31 March 2024
 
Quarter 4- Module 3 Principles of Marketing
Quarter 4- Module 3 Principles of MarketingQuarter 4- Module 3 Principles of Marketing
Quarter 4- Module 3 Principles of Marketing
 
VIP Call Girls LB Nagar ( Hyderabad ) Phone 8250192130 | ₹5k To 25k With Room...
VIP Call Girls LB Nagar ( Hyderabad ) Phone 8250192130 | ₹5k To 25k With Room...VIP Call Girls LB Nagar ( Hyderabad ) Phone 8250192130 | ₹5k To 25k With Room...
VIP Call Girls LB Nagar ( Hyderabad ) Phone 8250192130 | ₹5k To 25k With Room...
 
Call Girls In Yusuf Sarai Women Seeking Men 9654467111
Call Girls In Yusuf Sarai Women Seeking Men 9654467111Call Girls In Yusuf Sarai Women Seeking Men 9654467111
Call Girls In Yusuf Sarai Women Seeking Men 9654467111
 
OAT_RI_Ep19 WeighingTheRisks_Apr24_TheYellowMetal.pptx
OAT_RI_Ep19 WeighingTheRisks_Apr24_TheYellowMetal.pptxOAT_RI_Ep19 WeighingTheRisks_Apr24_TheYellowMetal.pptx
OAT_RI_Ep19 WeighingTheRisks_Apr24_TheYellowMetal.pptx
 
Best VIP Call Girls Noida Sector 18 Call Me: 8448380779
Best VIP Call Girls Noida Sector 18 Call Me: 8448380779Best VIP Call Girls Noida Sector 18 Call Me: 8448380779
Best VIP Call Girls Noida Sector 18 Call Me: 8448380779
 
Russian Call Girls In Gtb Nagar (Delhi) 9711199012 💋✔💕😘 Naughty Call Girls Se...
Russian Call Girls In Gtb Nagar (Delhi) 9711199012 💋✔💕😘 Naughty Call Girls Se...Russian Call Girls In Gtb Nagar (Delhi) 9711199012 💋✔💕😘 Naughty Call Girls Se...
Russian Call Girls In Gtb Nagar (Delhi) 9711199012 💋✔💕😘 Naughty Call Girls Se...
 
High Class Call Girls Nagpur Grishma Call 7001035870 Meet With Nagpur Escorts
High Class Call Girls Nagpur Grishma Call 7001035870 Meet With Nagpur EscortsHigh Class Call Girls Nagpur Grishma Call 7001035870 Meet With Nagpur Escorts
High Class Call Girls Nagpur Grishma Call 7001035870 Meet With Nagpur Escorts
 
05_Annelore Lenoir_Docbyte_MeetupDora&Cybersecurity.pptx
05_Annelore Lenoir_Docbyte_MeetupDora&Cybersecurity.pptx05_Annelore Lenoir_Docbyte_MeetupDora&Cybersecurity.pptx
05_Annelore Lenoir_Docbyte_MeetupDora&Cybersecurity.pptx
 

Stock Repurchases in the United States

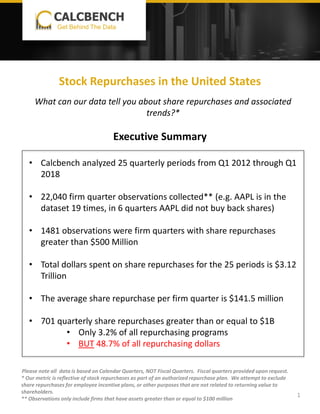
  • 1. Stock Repurchases in the United States Executive Summary Please note all data is based on Calendar Quarters, NOT Fiscal Quarters. Fiscal quarters provided upon request. * Our metric is reflective of stock repurchases as part of an authorized repurchase plan. We attempt to exclude share repurchases for employee incentive plans, or other purposes that are not related to returning value to shareholders. ** Observations only include firms that have assets greater than or equal to $100 million 1 • Calcbench analyzed 25 quarterly periods from Q1 2012 through Q1 2018 • 22,040 firm quarter observations collected** (e.g. AAPL is in the dataset 19 times, in 6 quarters AAPL did not buy back shares) • 1481 observations were firm quarters with share repurchases greater than $500 Million • Total dollars spent on share repurchases for the 25 periods is $3.12 Trillion • The average share repurchase per firm quarter is $141.5 million • 701 quarterly share repurchases greater than or equal to $1B • Only 3.2% of all repurchasing programs • BUT 48.7% of all repurchasing dollars What can our data tell you about share repurchases and associated trends?* Get Behind The Data
  • 2. Get Behind The Data 2 Dollars Spent on Share Repurchases By Quarter ($ Billion) 202 1,004 - 200 400 600 800 1,000 1,200 - 40 80 120 160 200 2012_Q1 2012_Q2 2012_Q3 2012_Q4 2013_Q1 2013_Q2 2013_Q3 2013_Q4 2014_Q1 2014_Q2 2014_Q3 2014_Q4 2015_Q1 2015_Q2 2015_Q3 2015_Q4 2016_Q1 2016_Q2 2016_Q3 2016_Q4 2017_Q1 2017_Q2 2017_Q3 2017_Q4 2018_Q1 FirmCount DollarsSpent($B) Dollars Spent on Share Repurchases ($ Billion) Firm Count Please note all data is based on Calendar Quarters, NOT Fiscal Quarters. Fiscal quarters provided upon request. **Our metric is reflective of stock repurchases as part of an authorized repurchase plan. We attempt to exclude share repurchases for employee incentive plans, or other purposes that are not related to returning value to shareholders.
  • 3. 3 Frequency of Firms in Share Repurchase Brackets (2012_Q1 - 2018_Q1) 1,948 8,895 6,346 2,138 1,232 780 690 11 - 1,000 2,000 3,000 4,000 5,000 6,000 7,000 8,000 9,000 10,000 Frequency Share Repurchase brackets Note: these values have accumulated over the 25 quarterly periods from 2012 Q1 through 2018 Q1. Please note all data is based on Calendar Quarters, NOT Fiscal Quarters. Fiscal quarters provided upon request. **Our metric is reflective of stock repurchases as part of an authorized repurchase plan. We attempt to exclude share repurchases for employee incentive plans, or other purposes that are not related to returning value to shareholders. Get Behind The Data
  • 4. 4 Median Dollars Spent on Share Repurchases vs. Mean Dollars Spent on Share Repurchases ($ Million) Notes on graph: *Median Repurchase Value calculated by taking Median Value of Total Share Repurchases in each calendar quarter. *Mean Repurchase Value calculated by taking Average Value of Total Share Repurchases in each calendar quarter. $11 $201 $- $50 $100 $150 $200 2012_Q1 2012_Q2 2012_Q3 2012_Q4 2013_Q1 2013_Q2 2013_Q3 2013_Q4 2014_Q1 2014_Q2 2014_Q3 2014_Q4 2015_Q1 2015_Q2 2015_Q3 2015_Q4 2016_Q1 2016_Q2 2016_Q3 2016_Q4 2017_Q1 2017_Q2 2017_Q3 2017_Q4 2018_Q1 Median Share Repurchases Mean Share Repurchases Please note all data is based on Calendar Quarters, NOT Fiscal Quarters. Fiscal quarters provided upon request. **Our metric is reflective of stock repurchases as part of an authorized repurchase plan. We attempt to exclude share repurchases for employee incentive plans, or other purposes that are not related to returning value to shareholders. Get Behind The Data
  • 5. 5 The table below represents the biggest buyers of their own stock over the last 25 quarters. Firm Level Share Repurchases *Avg. Daily Repurchase based on 63 day quarters 39.9% 0.0% 5.0% 10.0% 15.0% 20.0% 25.0% 30.0% 35.0% 40.0% 45.0% 2012 Q1 2012 Q2 2012 Q3 2012 Q4 2013 Q1 2013 Q2 2013 Q3 2013 Q4 2014 Q1 2014 Q2 2014 Q3 2014 Q4 2015 Q1 2015 Q2 2015 Q3 2015 Q4 2016 Q1 2016 Q2 2016 Q3 2016 Q4 2017 Q1 2017 Q2 2017 Q3 2017 Q4 2018 Q1 PERCENTOFTOTALREPURCHASES Firm Level Buybacks: Top 10 Repurchasers as Percent of Total Company DollarsRepurchased (Billions) Avg. DailyRepurchase (Millions) AppleInc 194.59$ 123.55$ Microsoft Corp 61.43$ 39.00$ MotorolaSolutions, Inc. 58.99$ 37.46$ Exxon Mobil Corp 56.55$ 35.91$ OracleCorp 53.48$ 33.95$ International BusinessMachinesCorp 52.66$ 33.43$ WellsFargo & Company/MN 48.44$ 30.75$ American International Group Inc 47.22$ 29.98$ Jpmorgan Chase& Co 47.07$ 29.89$ Walt Disney Co/ 38.40$ 24.38$ Cisco Systems, Inc. 38.17$ 24.23$ Federal HomeLoan Bank ofAtlanta 36.82$ 23.38$ BoeingCo 34.79$ 22.09$ Goldman SachsGroup Inc 34.07$ 21.63$ Citigroup Inc 33.79$ 21.45$ Please note all data is based on Calendar Quarters, NOT Fiscal Quarters. Fiscal quarters provided upon request. **Our metric is reflective of stock repurchases as part of an authorized repurchase plan. We attempt to exclude share repurchases for employee incentive plans, or other purposes that are not related to returning value to shareholders. Get Behind The Data
  • 6. 6 Share Repurchase Yields A share repurchase yield is the total dollars bought back divided by the market capitalization of the firm. Smallest in the top 10 (Still big though) Biggest Repurchases - 2.00 4.00 6.00 8.00 10.00 12.00 0% 5% 10% 15% 20% 25% 30% Ranks(from1-10) Repurchase Yields for top 10 firms Top 10 Firms by Quarter (2017_Q3, 2017_Q4, 2018_Q1) 2017_Q3 2017_Q4 2018_Q1 Please note all data is based on Calendar Quarters, NOT Fiscal Quarters. Fiscal quarters provided upon request. **Our metric is reflective of stock repurchases as part of an authorized repurchase plan. We attempt to exclude share repurchases for employee incentive plans, or other purposes that are not related to returning value to shareholders. Smallest Repurchase Yields in the top 10 (still large though) Largest Repurchase Yields Get Behind The Data
  • 7. 7 Share Repurchase Yields For Top 10 Firms 19% 0% 5% 10% 15% 20% 25% Entercom Communications Corp M I Homes Inc Terex Corp Citi Trends Inc Marinemax Inc Winmark Corp Dominos Pizza Inc Autonation, Inc. Hewlett Packard Enterprise Co Owens Realty Mortgage, Inc. BuyBack Yields for Top 10 Firms (2017_Q3) 24% 0% 5% 10% 15% 20% 25% 30% Voya Financial, Inc. Ncr Corp Owens Realty Mortgage, Inc. Herbalife Nutrition Ltd. Sealed Air Corp/DE Greenbrier Companies Inc Goodyear Tire & Rubber Co /OH/ Greenhill & Co Inc ProPhase Labs, Inc. Mbia Inc BuyBack Yield for Top 10 Firms (2017_Q4) 12% 0% 2% 4% 6% 8% 10% 12% 14% Ellington Residential Mortgage REIT Taylor Morrison Home Corp Phillips 66 Juniper Networks Inc Kroger Co Piedmont Office Realty Trust, Inc. Amgen Inc Netscout Systems Inc Dunkin' Brands Group, Inc. Greenhill & Co Inc BuyBack Yield for Top 10 Firms (2018_Q1) Get Behind The Data Please note all data is based on Calendar Quarters, NOT Fiscal Quarters. Fiscal quarters provided upon request. **Our metric is reflective of stock repurchases as part of an authorized repurchase plan. We attempt to exclude share repurchases for employee incentive plans, or other purposes that are not related to returning value to shareholders.
  • 8. 8 Percentage of Share Repurchases by Top 5 Firms 13% 2% 4% 3% 3% 75% Percentage of Top 5 Share Repurchasing Firms (2017_Q3) Apple Inc Charter Communications, Inc. /MO/ Citigroup Inc Jpmorgan Chase & Co Walgreens Boots Alliance, Inc. The Rest 4% 4% 3% 4% 4% 82% Percentage of Top 5 Share Repurchasing Firms (2017_Q4) Apple Inc Bank Of America Corp /DE/ Cisco Systems, Inc. Citigroup Inc Jpmorgan Chase & Co The Rest 5% 12% 3% 3% 6% 70% Percentage of Top 5 Share Repurchasing Firms (2018_Q1) Amgen Inc Apple Inc Cisco Systems, Inc. Microsoft Corp Motorola Solutions, Inc. The Rest Please note all data is based on Calendar Quarters, NOT Fiscal Quarters. Fiscal quarters provided upon request. **Our metric is reflective of stock repurchases as part of an authorized repurchase plan. We attempt to exclude share repurchases for employee incentive plans, or other purposes that are not related to returning value to shareholders. Get Behind The Data
  • 9. 9 Looking at Related Metrics Share Repurchases can potentially serve as alternative ways for companies to increase value for stockholders, as dividends do. Some analysts opposed to the increase of share repurchases argue that companies should contribute more excess cash to CapEx and R&D Expenses. $202 $82 $- $50 $100 $150 $200 Total Share Repurchases vs. Payments of Dividends ($ Billion) Total Share Repurchases Total Payments of Dividends $202 $102 $48 $- $50 $100 $150 $200 Total Share Repurchases vs. CapEx and R&D Expenses ($ Billion) Total Share Repurchases Total CapEx Total Research and Development Please note all data is based on Calendar Quarters, NOT Fiscal Quarters. Fiscal quarters provided upon request. **Our metric is reflective of stock repurchases as part of an authorized repurchase plan. We attempt to exclude share repurchases for employee incentive plans, or other purposes that are not related to returning value to shareholders. Get Behind The Data
  • 10. About the Authors CALCBENCH PREMIUM SUITE 10 Pranav Ghai CEO & CO-FOUNDER Pranav is an analytics professional whose career has been based in financial services, with time spent at Morgan Stanley and ITG. He is also a new addition to the board of directors at XBRL-US. Pranav graduated with a BS from Bates College and an MS in Applied Mathematics from the Courant Institute at New York University. Jeff Kahle INTERN Jeff is a student at Bates College, scheduled to graduate in 2019, who matriculated from Choate Rosemary Hall in Wallingford, CT. He works as the Business Manager of the Bates Student, and he is active in the Investment Club, where he serves as the Director of Equity Research. Jeff also likes to spend time as a DJ on WRBC Bates College Radio. Get Behind The Data
  • 11. Try Calcbench Today! ABOUT THIS REPORT: This report was created using data analyzed via Calcbench’s Premium Suite, an online interactive platform that helps finance leaders access and analyze financial data thoroughly and efficiently. Our accessible and intuitive platform can aid in better understanding competitor financials, identifying potential risk areas, analyzing trends across industry sectors, or conducting more effective due diligence. Sign up for a 2 week free trial at www.calcbench.com/trial or contact us at us@calcbench.com or via www.calcbench.com CALCBENCH PREMIUM SUITE 11 Get Behind The Data