Using a Linear Programming Model to optimize fishing operations
•Download as DOCX, PDF•
0 likes•135 views

Story of the development of the 1st LP model in planning the deployment of a fishing fleet

Recommended
Recommended
More Related Content
Similar to Using a Linear Programming Model to optimize fishing operations
Similar to Using a Linear Programming Model to optimize fishing operations (20)
Recently uploaded
Recently uploaded (20)
Using a Linear Programming Model to optimize fishing operations
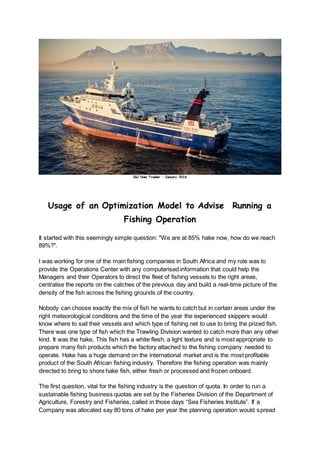
- 1. I&J New Trawler – January 2016 Usage of an Optimization Model to Advise Running a Fishing Operation It started with this seemingly simple question: "We are at 85% hake now, how do we reach 89%?". I was working for one of the main fishing companies in South Africa and my role was to provide the Operations Center with any computerised information that could help the Managers and their Operators to direct the fleet of fishing vessels to the right areas, centralise the reports on the catches of the previous day and build a real-time picture of the density of the fish across the fishing grounds of the country. Nobody can choose exactly the mix of fish he wants to catch but in certain areas under the right meteorological conditions and the time of the year the experienced skippers would know where to sail their vessels and which type of fishing net to use to bring the prized fish. There was one type of fish which the Trawling Division wanted to catch more than any other kind. It was the hake, This fish has a white flesh, a light texture and is most appropriate to prepare many fish products which the factory attached to the fishing company needed to operate. Hake has a huge demand on the international market and is the most profitable product of the South African fishing industry. Therefore the fishing operation was mainly directed to bring to shore hake fish, either fresh or processed and frozen onboard. The first question, vital for the fishing industry is the question of quota. In order to run a sustainable fishing business quotas are set by the Fisheries Division of the Department of Agriculture, Forestry and Fisheries, called in those days “Sea Fisheries Institute”. If a Company was allocated say 80 tons of hake per year the planning operation would spread
- 2. this amount over the 12 months of the year although on some months the size of the fish and its quantity would dramatically change. The market price is determined by the size and the usage of the fish and of course by the market demand. Therefore it was more profitable to supply the good sized hake which could be converted into different products such as steaks, loins, flat fillets, whole fish portions, etc. The other kinds of fish were also brought to the docks and sold but they did not determine the direction of the fishing operation. Fishing at 89% hake means in some months a high concentration of hake size 5 and 6 which are used to produce the loins taken along the upper part above the backbone. But in other months this fish could be found in much smaller quantities. For instance in October and February the medium and large hake disappears into the depths of the ocean because of the spawning season. The demand is also determined by the seasons. In December, time of summer holidays, a huge crowd of tourists would want the traditional and famous "fish and chips", therefore increasing the demand beyond the fishing capacity of the fleet during this period. Catching 89% of hake instead of 85% means more profitable business and a higher market share nationally and internationally. The question was simple, the objective seemingly clear. The answer would take me more than two years of investigations, software development and long days in close collaboration with the Engineering Manager Tim Reddell, the General Manager Rob Whitehead and the Fishing Manager Barrie Rose who helped me understand what fishing meant and turned me into the 1st theoretical fisherman of the Trawling Division. I would like to pay a tribute to Barrie Rose who encouraged and helped with his immense knowledge and his enthusiasm to the success of this innovative project. In order to understand the mechanisms of fishing and its interaction in the sea and on shore we needed data. My reporting system did collect and record the catches and the mix of each net, the date and the time of the trawl, the method, and other technical parameters. But it was a new system and most of the data was centralised at the Sea Fisheries Institute I mentioned earlier. Their role was to monitor the catches and the filling of the quotas. Since we provided them with our own data we were allowed to receive this data back, however
- 3. only our data was accessible and the data about the operations of the competition was strictly out of reach. I was given about 5 years of data and during the development of the project I collected 2 more years of data. I opted for the design of a data warehouse although this concept was hardly popular and common as it is today. The data would be filtered, cleaned, aggregated and stored into categories showing the mix of fish and the total amount. If the facts were clear, defining the dimensions and their attributes was a different kettle of fish if I may say so. Many discussions with my managers mentioned earlier helped drawing broad lines which would define these dimensions. The Operations Center became my favorite place during the day, sometimes the weekend or the night. There I would discuss with former Skippers and the Operators who knew much more than they were ready to say. After 6 months my design became clear and I could start implementing the software and the data warehouse. Since there were no much choice of the tools found in the market, I had to develop a dedicated software which would classify the catches and build a data mart, dimensions and facts tables. The analytical process would not be performed after the building of the data mart because again a lack of appropriate software. Therefore my fact tables contained mathematical functions expressing the percentage and the quantity of a catch for each type of fish or product. The date and time of the year was an obvious dimension. Among the other dimensions there were the area dimension, a square of 50x50 miles, the depth dimension, 3 levels of depth down to 3000m, the type of trawling,etc. The degree of the function corresponded to the complexity of the fluctuation of a specific type of fish. The function would also help make a short term prediction when processed with the current catch data, by using a Kalman filter method. One year later my data mart was ready to produce and be tested to meet the expectations of the Trawling Division. The 1st useful information of the system was shown during the daily remote meeting between the Fishing Manager at the Operations Center and his Skippers on board their vessels. If until now the skippers jealously kept their experience, their predictions and their performance as a private secret, we slowly started an education process which would convince them to cooperate, truly report their catches and rip the benefits of a system which gives them an accurate picture of the fishing grounds on a daily basis. This education step was not the easiest step of the entire project. However we recorded several successes.
- 4. It was time now to explore the forecasting and decision making process and advise a fishing programme for the fleet, based on the orders of fish products that the Marketing Division channelled to the Trawling Division on a regular basis. The formulation of the model was: Constraints: 1. The orders are defined by a specific quantity of fish products derived from the hake in specific sizes. But this quantity can fluctuate within a short range between a minimum and a maximum. 2. The fresh fish local market also required to be satisfied with other kinds of fish which have also a minimum and maximum quota. Productions Algorithms: 1. The cutting of the hake fillet goes according to the size and the weight of the fish which depends of the type of hake, size 5 or size 6. 2. The correct mix and quantity when determined are to be found into areas as stored in the data mart and are subject to the dimensions of the data mart. Relevant dimensions are the week of the year and the fishing capacity of the vessels and their ability. 3. We consider only variable operating costs for each fishing vessel. 4. Each order contains fixed selling prices of the fish products. 5. These products can be processed and produced either onboard large freezer vessels or in the fish factory. The objective: Maximize the profits of the operation. The other obvious objective of the Fishing Company was to satisfy the market and by having a satisfied customer ensure the continuity of an industry which started 100 years ago as a family business.
- 5. The optimisation model was developed as Linear Programming model using Lingo, a software created and marketed by Lindo Systems Inc. Other software was developed in house in C++ and Object Oriented Pascal.