Recommended

Recommended
More Related Content
Similar to Research Poster Virus Spread On a Network_STARS_
Similar to Research Poster Virus Spread On a Network_STARS_ (20)
Research Poster Virus Spread On a Network_STARS_
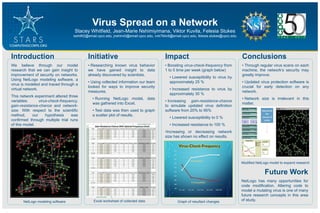
- 1. Virus Spread on a Network Stacey Whitfield, Jean-Marie Nshimiyimana, Viktor Kuvila, Felesia Stukes swhitfi2@email.cpcc.edu, jnshimi0@email.cpcc.edu, vnk794c6@email.cpcc.edu, felesia.stukes@cpcc.edu NetLogo modeling software Excel worksheet of collected data Impact • Boosting virus-check-frequency from 1 to 5 time per week (graph below) • Lowered susceptibility to virus by approximately 25 % • Increased resistance to virus by approximately 30 % • Increasing gain-resistance-chance to simulate updated virus definition software from 20% to 95% • Lowered susceptibility to 0 % • Increased resistance to 100 % •Increasing or decreasing network size has shown no effect on results. Future Work NetLogo has many opportunities for code modification. Altering code to model a mutating virus is one of many future research concepts in this area of study. Modified NetLogo model to expand research Conclusions • Through regular virus scans on each machine, the network’s security may greatly improve. • Updated virus protection software is crucial for early detection on any network. • Network size is irrelevant in this matter. Initiative • Researching known virus behavior we have gained insight to data already discovered by scientists. • Using collected information our team looked for ways to improve security measures. • Running NetLogo model, data was gathered into Excel. • Test data was then used to graph a scatter plot of results. Introduction We believe through our model research that we can gain insight to improvement of security on networks. Using NetLogo modeling software, a virus is modeled and traced through a virtual network. This network experiment altered three variables: virus-check-frequency, gain-resistance-chance and network- size. With respect to the scientific method, our hypothesis was confirmed through multiple trial runs of this model. Graph of resultant changes