1. 68 66 65 69 65
19 21 23
20
21
13 13 13 11 14
Q1: Jan - Mar 22 Q2: Apr – Jun 22 Q3: Jul – Sep 22 Q4: Oct – Dec 22 Q1: Jan - Mar 23
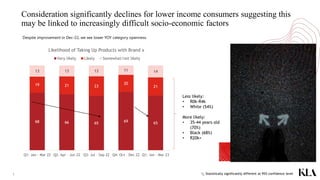
Likelihood of Taking Up Products with Brand x
Very likely Likely Somewhat/not likely
Consideration significantly declines for lower income consumers suggesting this
may be linked to increasingly difficult socio-economic factors
1 ↑↓ Statistically significantly different at 95% confidence level
Less likely:
• R0k-R4k
• White (54%)
More likely:
• 35-44 years old
(70%)
• Black (68%)
• R20k+
Despite improvement in Dec-22, we see lower YOY category openness.
2. 38.1 39.7 42.4 39.2 38.8
127.9 132.0
138.6 138.8
144.0
0.0
20.0
40.0
60.0
80.0
100.0
120.0
140.0
160.0
Mar-22 Jun-22 Sep-22 Dec-22 Mar-23
Value scores by Spend
brand Value brand Spend
The increased spend on brand x hadn’t appeared to have a negative effect
on value perceptions. However, there is a slight inverse relationship which
must be monitored
2
3. Aided Awareness
Current Customer
Purchase Intent
While brand x declined in the top and middle funnel scores, conversions were not affected.
3 ↑↓ Statistically significantly different at 95% confidence level
Aided awareness has significantly declined for males (86% to 83%) those aged 25-34
(85% to 80%) and 35-44 (85% to 81%), as well as black (86% to 84%) and coloured
(90% to 80%) consumers.
Current Customer has significantly declined for those earning between R0k and R4k
(61% to 54%).
Purchase intent has significantly increased for those aged 18-24 (19% to 20%), black
consumers (16% to 18%) and income of R4k to R20k (16% to 20%).
Jun 22
58%
27%
Conversion
Sep 22 Dec 22 Mar 23
87
56
17
58%
27%
Conversion
87
56
17
58%
27%
Conversion
87
56
17
58%
27%
Conversion
87
56
17
4. 27%
27%
27%
27%
20%
31%
27%
27%
24%
39%
22%
22%
27%
33%
35%
24%
35%
39%
41%
31%
24%
29%
22%
37%
24%
35%
31%
31%
31%
14%
20%
27%
20%
25%
20%
10% 15% 20% 25% 30% 35% 40% 45% 50%
Attribute 1
Attribute 2
Attribute 3
Attribute 4
Attribute 5
Attribute 6
Attribute 7
Brand associations
Brand 1
Brand 2
Brand 3
Brand 4
Brand 5
Brand x shows high performance scores. However, the brand needs to improve its
attribute 3 scores as this has been shown to drive overall customer preference
4
↑↓ Statistically significantly different at 95% confidence level
Source: A0. For each statement, please indicate which brand or brands you associate with that statement.
6. How to read correspondence maps
6
Correspondence maps provide a graphical representation of the correspondence between the x and y values
(brand and brand perception statements)
Brand 1
Perception
statement 1
Brand 2
Perception
statement 2
Brand 1
Brand 2
Brands that cluster around a
statement are highly associated
with the statement
Look at the angle position –
Small angles indicate association