1. Pharma Services Company Performance
vs. Benchmark Market Indices
(1)Pharma services index comprised of companies listed below; same companies also used in the
trading comps analysis on the reverse side: AmerisourceBergen Corporation (NYSE:ABC); Cardinal
Health, Inc. (NYSE:CAH); Charles River Laboratories International, Inc. (NYSE:CRL); Covance Inc.
(NYSE:CVD); Koninklijke DSM N.V. (ENXTAM:DSM); Lonza Group Ltd (SWX:LONN); McKesson
Corporation(NYSE:MCK); Quintiles Transnational Holdings Inc. (NYSE:Q)
Bourne Partners tracked the equity performance of companies
comprising the basket of pharma services companies against
the S&P 500 Healthcare Index and the general S&P 500 Index
— Since 2012, the pharma services companies are up over
120% and have outperformed the healthcare index by 25
and the general index by 61 percentage points
respectively
— Rising valuations for pharma services companies indicate
a good market cycle to explore divestment options
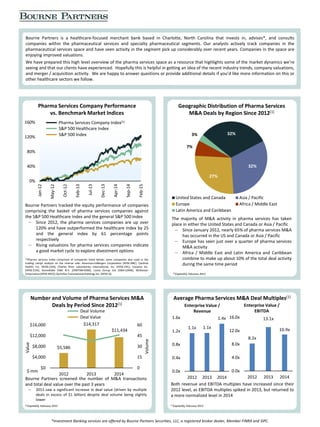
Geographic Distribution of Pharma Services
M&A Deals by Region Since 2012(1)
Bourne Partners is a healthcare-focused merchant bank based in Charlotte, North Carolina that invests in, advises*, and consults
companies within the pharmaceutical services and specialty pharmaceutical segments. Our analysts actively track companies in the
pharmaceutical services space and have seen activity in the segment pick up considerably over recent years. Companies in the space are
enjoying improved valuations.
We have prepared this high level overview of the pharma services space as a resource that highlights some of the market dynamics we’re
seeing and that our clients have experienced. Hopefully this is helpful in getting an idea of the recent industry trends, company valuations,
and merger / acquisition activity. We are happy to answer questions or provide additional details if you’d like more information on this or
other healthcare sectors we follow.
Number and Volume of Pharma Services M&A
Deals by Period Since 2012(1)
(1)CapitalIQ, February 2015
19%
9%
9%
6%
5%5%4%4%
3%
3%
33%
Bourne Partners screened the number of M&A transactions
and total deal value over the past 3 years
— 2013 saw a significant increase in deal value (driven by multiple
deals in excess of $1 billion) despite deal volume being slightly
lower
Average Pharma Services M&A Deal Multiples(1)
Enterprise Value /
Revenue
(1)CapitalIQ, February 2015
Enterprise Value /
EBITDA
Both revenue and EBITDA multiples have increased since their
2012 level, as EBITDA multiples spiked in 2013, but returned to
a more normalized level in 2014
The majority of M&A activity in pharma services has taken
place in either the United States and Canada or Asia / Pacific
— Since January 2012, nearly 65% of pharma services M&A
has occurred in the US and Canada or Asia / Pacific
— Europe has seen just over a quarter of pharma services
M&A activity
— Africa / Middle East and Latin America and Caribbean
combine to make up about 10% of the total deal activity
during the same time period
(1)CapitalIQ, February 2015
0%
40%
80%
120%
160%
Jan-12
May-12
Oct-12
Feb-13
Jul-13
Dec-13
Apr-14
Sep-14
Feb-15
Pharma Services Company Index(1)
S&P 500 Healthcare Index
S&P 500 Index 32%
32%
27%
7%
3%
United States and Canada Asia / Pacific
Europe Africa / Middle East
Latin America and Caribbean
8.2x
13.1x
10.9x
0.0x
4.0x
8.0x
12.0x
16.0x
2012 2013 2014
1.1x 1.1x
1.4x
0.0x
0.4x
0.8x
1.2x
1.6x
2012 2013 2014
$5,586
$14,317
$11,434
$0
$4,000
$8,000
$12,000
$16,000
2012 2013 2014
0
15
30
45
60
Value
Volume
Deal Volume
Deal Value
$ mm
*Investment Banking services are offered by Bourne Partners Securities, LLC, a registered broker dealer, Member FINRA and SIPC.
2. Headquartered in Charlotte, North Carolina, Bourne Partners is a
healthcare-focused merchant and investment banking firm* that
provides investment in, advisory, and consulting services to
domestic and international pharma services and specialty
pharmaceutical companies. The firm’s management team is
composed of healthcare executives and experienced investment
professionals with broad experience and expertise in healthcare
investing and business development activities. The firm also
invests opportunistically in select private equity funds and in
companies and products that align with the firm’s strategic
initiatives. For more information on market activity in the pharma
services industry or to discuss how Bourne
Partners may be able to add value to your
company, please contact:
Jason Colgate
Director & Head of Business Development
+1-704-714-8368
jcolgate@bourne-partners.com
Comparable Precedent Transactions Analysis(1)
Comparable Companies Analysis(1)
(1)CapitalIQ, February 2015
(1)CapitalIQ, February 2015
LTM CYE
Company Ticker
Share
Price
Shares
Out
Equity
Value
Net Debt
(Cash)
Enterprise
Value Revenue EBITDA EBIT EPS Sales EBITDA
CYE
EPS
CYE+1
EPS
Book
Value
AmerisourceBergenCorporation NYSE:ABC $95.80 220.1 $21,088.1 ($302.9) $20,785.2 $123,981.4 $1,406.9 $1,212.7 $3.06 $133,238.4 $1,933.0 $4.58 $5.21 8.1
Cardinal Health, Inc. NYSE:CAH 84.40 330.1 27,863.0 1,095.0 28,958.0 93,928.0 2,441.0 1,996.0 3.28 99,366.0 2,692.9 4.35 4.88 18.5
Charles River Laboratories
International, Inc. NYSE:CRL 69.60 46.9 3,265.8 641.4 3,907.2 1,257.3 280.6 183.5 1.90 1,287.9 293.6 3.36 3.56 14.3
Covance Inc. NYSE:CVD 106.20 57.0 6,049.0 (565.3) 5,483.8 2,521.0 438.9 304.4 3.26 2,630.7 461.0 4.24 4.58 29.8
Koninklijke DSM N.V. ENXTAM:DSM 52.31 173.4 9,071.2 2,777.8 11,849.0 11,579.5 1,363.0 735.8 2.76 11,012.0 1,416.6 3.21 3.16 43.7
Lonza Group Ltd SWX:LONN 115.25 52.0 5,990.2 2,025.4 8,015.6 3,664.3 714.7 425.8 3.38 3,971.6 804.5 6.74 7.68 41.3
McKesson Corporation NYSE:MCK 219.06 232.8 51,006.4 5,807.0 56,813.4 173,870.0 3,921.0 2,969.0 6.20 180,459.3 4,738.5 10.91 12.62 39.2
Quintiles Transnational Holdings Inc. NYSE:Q 59.91 123.5 7,401.8 1,415.4 8,817.2 4,105.7 657.2 569.7 1.80 4,175.3 702.5 2.66 2.98 (4.2)
Margin Analysis Enterprise Value / P / E
Company Ticker FYE
Data
as of
Gross
Profit EBITDA EBIT Revenue EBITDA
Sales
FYE+1
EBITDA
FYE+1 EBIT Sales CYE LTM CYE CYE+1
Price to
Book
AmerisourceBergenCorporation NYSE:ABC 30-Sep-14 9-Feb-15 2.5% 1.1% 1.0% 0.2x 14.8x 0.1x 9.8x 17.1x 0.2x 31.3x 20.9x 18.4x 11.9x
Cardinal Health, Inc. NYSE:CAH 30-Jun-14 9-Feb-15 5.7% 2.6% 2.1% 0.3x 11.9x 0.3x 9.8x 14.5x 0.3x 25.7x 19.4x 17.3x 4.6x
Charles River Laboratories
International, Inc. NYSE:CRL 28-Dec-13 9-Feb-15 36.0% 22.3% 14.6% 3.1x 13.9x 2.9x 12.2x 21.3x 3.0x 36.6x 20.7x 19.5x 4.9x
Covance Inc. NYSE:CVD 31-Dec-13 9-Feb-15 30.8% 17.4% 12.1% 2.2x 12.5x 2.0x 11.1x 18.0x 2.1x 32.5x 25.1x 23.2x 3.6x
Koninklijke DSM N.V. ENXTAM:DSM 31-Dec-13 9-Feb-15 26.2% 11.8% 6.4% 1.0x 8.7x 1.1x 8.7x 16.1x 1.1x 19.0x 16.3x 16.6x 1.2x
Lonza Group Ltd SWX:LONN 31-Dec-13 9-Feb-15 29.5% 19.5% 11.6% 2.2x 11.2x 2.0x 9.4x 18.8x 2.0x 34.1x 17.1x 15.0x 2.8x
McKesson Corporation NYSE:MCK 31-Mar-14 9-Feb-15 6.5% 2.3% 1.7% 0.3x 14.5x 0.3x 11.5x 19.1x 0.3x 35.3x 20.1x 17.4x 5.6x
Quintiles Transnational Holdings Inc. NYSE:Q 30-Jun-14 9-Feb-15 35.4% 16.0% 13.9% 2.1x 13.4x 2.0x 11.6x 15.5x 2.1x 33.2x 22.5x 20.1x N/M
N/M - Not Meaningful Median 27.8% 13.9% 9.0% 1.6x 13.0x 1.6x 10.5x 17.6x 1.5x 32.9x 20.4x 17.9x 4.6x
Mean 21.6% 11.6% 7.9% 1.4x 12.6x 1.3x 10.5x 17.6x 1.4x 31.0x 20.3x 18.4x 4.9x
Max 36.0% 22.3% 14.6% 3.1x 14.8x 2.9x 12.2x 21.3x 3.0x 36.6x 25.1x 23.2x 11.9x
Min 2.5% 1.1% 1.0% 0.2x 8.7x 0.1x 8.7x 14.5x 0.2x 19.0x 16.3x 15.0x 1.2x
Market Trends & Industry Developments
19%
9%
9%
6%
5%5%4%4%
3%
3%
33%
Below are some recent trends and market intelligence
g
— The global pharmaceutical CMO and CRO markets are
expected to grow at 13.6% CAGR through 2017, while
the value of the global CRO market alone is expected
to reach $43 billion by the end of that time period(1)
— Distributors are expected to benefit from the
projected growth in demand for prescription
pharmaceuticals due to US healthcare reform
— Advances in technology have led to efficiencies within
clinical trials sub-sections as well as supply chain
management for industry firms
— Recent industry consolidation has allowed niche
pharma services to thrive, filling gaps left by the
consolidation of larger firms
(1)Transparency Market Research, PharmaTimes Digital: Contract research/mfrg market “set to
grow 13.6% a year”, October 2013
*Investment Banking services are offered by Bourne Partners Securities, LLC, a registered broker dealer, Member FINRA and SIPC.
Announced
Date
Target
Company
Buyer
Company
Geographic
Location
Enterprise
Value
LTM
Revenue
LTM
EBITDA
EV /
LTM Revenue
EV /
LTM EBITDA
Nov-14 JCL Bioassay Corporation CMIC HOLDINGS Co., Ltd. Japan $ 22.0 $ 19.3 $ 3.4 1.5x 10.1x
Nov-14 Covance Inc. Laboratory Corp. of America Holdings United States 5,677.4 2,509.7 416.5 2.2x 12.8x
Sep-14 Shasun Pharmaceuticals Ltd Strides Arcolab Ltd. India 306.5 213.0 26.3 1.6x 14.0x
May-14 Laurus Labs Private Limited Warburg Pincus LLC India 290.2 204.4 N/A 1.4x N/A
Mar-14 Cedarburg Pharmaceuticals, Inc. Albany Molecular Research Inc. United States 41.0 16.2 5.5 2.5x 7.5x
Nov-13 Patheon Inc. JLL Partners; Koninklijke DSM N.V. United States 1,860.9 1,023.1 128.0 1.7x 13.1x
Oct-13 Celesio AG Dragonfly GmbH & Co. KGaA Germany 7,389.2 29,215.6 441.8 0.3x 16.7x
Sep-13 Molecular Profiles Ltd. Columbia Laboratories Inc. United Kingdom 25.4 9.0 N/A 2.8x N/A
Sep-13 Haupt Pharma AG Aenova Group GmbH Germany 342.4 371.4 N/A 0.9x N/A
Jan-13 BioClinica, Inc. JLL Partners; JLL Partners VI, L.P. United States 108.2 79.0 10.3 1.4x 10.5x
Oct-12 Metrics, Inc. Mayne Pharma Group Limited United States 120.0 51.6 16.1 2.3x 7.5x
Jul-12 ShangPharma Corporation TPG Capital China 142.2 121.9 17.3 1.1x 8.3x
N/A - Not Available Median $216.2 $163.2 $17.3 1.6x 10.5x
N/M - Not Meaningful Mean 1,360.4 2,819.5 118.4 1.7x 11.2x
Max 7,389.2 29,215.6 441.8 2.8x 16.7x
Min 22.0 9.0 3.4 0.3x 7.5x