Chromosomal Gene Inactivation In The Green Sulfur Bacterium Chlorobium tepidu...
Warfarin poster
1. PCR Detection of SNP Markers for Warfarin Sensitivity Using Oral FluidsPCR Detection of SNP Markers for Warfarin Sensitivity Using Oral Fluidsy g
Kari L Organtini Jesús M González and R Sam Niedbala (san204@lehigh edu)Kari L. Organtini, Jesús M. González and R. Sam Niedbala (san204@lehigh.edu)
Department of ChemistryDepartment of Chemistry
Lehigh UniversityLehigh University
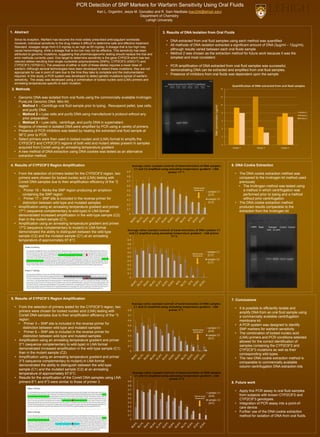
1 Abstract 3 Results of DNA Isolation from Oral Fluids1. Abstract 3. Results of DNA Isolation from Oral Fluids
Si it i ti W f i h b th t id l ib d ti l t ld idSince its inception, Warfarin has become the most widely prescribed anticoagulant worldwide. • DNA extracted from oral fluid samples using each method was quantifiedp , y p g
However individual sensitivity to the drug makes it difficult to determine safe and effective treatment
• DNA extracted from oral fluid samples using each method was quantified
However, individual sensitivity to the drug makes it difficult to determine safe and effective treatment.
• All methods of DNA isolation extracted a significant amount of DNA (3µg/ml – 12µg/ml)
Standard dosages range from 0.5 mg/day to as high as 60 mg/day. A dosage that is too high may
All methods of DNA isolation extracted a significant amount of DNA (3µg/ml 12µg/ml),
f
Standard dosages range from 0.5 mg/day to as high as 60 mg/day. A dosage that is too high may
cause hemorrhaging while a dosage that is too low may not be effective This sensitivity has been although results varied between each oral fluids samplecause hemorrhaging, while a dosage that is too low may not be effective. This sensitivity has been although results varied between each oral fluids sample
M th d 2 h th t ti th d f f t k b it thattributed to genomic mutations suggesting that pharmacogenomic testing should replace the trial and • Method 2 was chosen as the extraction method for future work because it was theattributed to genomic mutations, suggesting that pharmacogenomic testing should replace the trial and
th d tl d O t t t d t i iti it i th CYP2C9 hi h h t simplest and most consistenterror methods currently used. One target to determine sensitivity is the gene CYP2C9 which has two simplest and most consistent.y g y g
relevant alleles resulting from single nucleotide polymorphisms (SNPs) CYP2C9*2 (430C>T) and
p
relevant alleles resulting from single nucleotide polymorphisms (SNPs), CYP2C9 2 (430C>T) and
CYP2C9*3 (1075A>C). The presence of either or both of these alleles requires a lower dose of • PCR amplification of DNA extracted from oral fluid samples was successfulCYP2C9 3 (1075A C). The presence of either or both of these alleles requires a lower dose of
warfarin Although several technologies have been developed to detect these mutations they are not
• PCR amplification of DNA extracted from oral fluid samples was successful,
warfarin. Although several technologies have been developed to detect these mutations, they are not demonstrating DNA can be extracted and amplified from oral fluid samples
appropriate for use in point of care due to the time they take to complete and the instrumentation
demonstrating DNA can be extracted and amplified from oral fluid samples.
P f i hibi f l fl id d d h l
appropriate for use in point of care due to the time they take to complete and the instrumentation
i d I thi t d PCR t d l d t d t t ti t ti t i l f f i
• Presence of inhibitors from oral fluids was dependent upon the sample
required. In this study, a PCR system was developed to detect genetic mutations typical of warfarin
Presence of inhibitors from oral fluids was dependent upon the sample
q y, y p g yp
sensitivity The assay was developed using a combination of locked nucleic acid (LNA) primers andsensitivity. The assay was developed using a combination of locked nucleic acid (LNA) primers and
annealing temperatures specific to each mutation.annealing temperatures specific to each mutation.
Quantification of DNA extracted from oral fluid samples
14
Quantification of DNA extracted from oral fluid samples
2 Methods 142. Methods
12• Genomic DNA was isolated from oral fluids using the commercially available InvitrogenGenomic DNA was isolated from oral fluids using the commercially available Invitrogen
PureLink Genomic DNA Mini Kit.
10
PureLink Genomic DNA Mini Kit.
M th d 1 C t if l fl id l i t l i R d ll t l ll 10
ml)
o Method 1 – Centrifuge oral fluid sample prior to lysing. Resuspend pellet, lyse cells,
/m
g p p y g p p , y ,
and p rif DNA
ug/
and purify DNA
8 Method 1
(u
p y
o Method 2 Lyse cells and purify DNA using manufacturer’s protocol without any Method 2
on
o Method 2 – Lyse cells and purify DNA using manufacturer s protocol without any Method 2
Method 3
tio
prior preparation
6
Method 3
rat
prior preparation.
6
ntr
o Method 3 – Lyse cells centrifuge and purify DNA in supernatant
cen
o Method 3 Lyse cells, centrifuge, and purify DNA in supernatant.
onc
• Regions of interest in isolated DNA were amplified by PCR using a variety of primers.
4
co
Regions of interest in isolated DNA were amplified by PCR using a variety of primers.
P f PCR i hibit t t d b h ti th t t d l fl id l t
Ac
• Presence of PCR inhibitors was tested by heating the extracted oral fluid sample at
DNA
y g p
56°C prior to PCR 2
D
56°C prior to PCR. 2
p
• Select primers were then used in locked nucleic acid (LNA) format to amplify the• Select primers were then used in locked nucleic acid (LNA) format to amplify the
CYP2C9*2 and CYP2C9*3 regions of both wild and mutant alleles present in samples 0
CYP2C9 2 and CYP2C9 3 regions of both wild and mutant alleles present in samples
Sample 1 Sample 2 Sample 3acquired from Coriell using an annealing temperature gradient Sample 1 Sample 2 Sample 3acquired from Coriell using an annealing temperature gradient.
A h d f DNA i i DNA ki d l i• A new method of DNA extraction using DNA cookies was tested as an alternativeA new method of DNA extraction using DNA cookies was tested as an alternative
t ti th dextraction method.
4 R l f CYP2C9*2 R i A lifi i 6 DNA C ki E i4. Results of CYP2C9*2 Region Amplification Average ratios (sample/control) of band intensities of DNA samples 6. DNA Cookie Extraction4. Results of CYP2C9 2 Region Amplification Average ratios (sample/control) of band intensities of DNA samples
C1 d C2 lifi d i li t t di t LNA
6. DNA Cookie Extraction
C1 and C2 amplified using annealing temperature gradient : LNA
From the selection of primers tested for the CYP2C9*2 region two
0.9 primer 17*1
The DNA cookie extraction method was• From the selection of primers tested for the CYP2C9*2 region, two primer 17 1
• The DNA cookie extraction method wasp g
primers were chosen for locked nucleic acid (LNA) testing with 0.8
compared to the Invitrogen kit method usedprimers were chosen for locked nucleic acid (LNA) testing with compared to the Invitrogen kit method used
Coriell DNA samples due to their amplification efficiency of the *2 0.7 previouslyCoriell DNA samples due to their amplification efficiency of the 2 previously
region: 0.6 • The Invitrogen method was tested usingregion:
P i 16 fl k th SNP i d i li
0 6 The Invitrogen method was tested using
th d i hi h t if ti
Optimal assay
o Primer 16 – flanks the SNP region producing an amplicon 0.5
sample C1 a method in which centrifugation was
p y
temperatureo Primer 16 flanks the SNP region producing an amplicon
t i i th SNP i
0.5
sample C1 a method in which centrifugation was
f d i t l i d th dcontaining the SNP region 0.4 (C/T) performed prior to lysing and a methodg g
Primer 17 SNP site is included in the reverse primer for
0.4 ( / ) p p y g
without prior centrifugationo Primer 17 – SNP site is included in the reverse primer for 0 3 sample C2 without prior centrifugationp
distinction between wild type and mutated samples
0.3 p
(C/C)
p g
• The DNA cookie extraction methoddistinction between wild-type and mutated samples 0 2
(C/C) • The DNA cookie extraction method
• Amplification using an annealing temperature gradient and primer
0.2
produced results comparable to the• Amplification using an annealing temperature gradient and primer
0 1
produced results comparable to the
17*1 (sequence complementary to wild-type) in LNA format
0.1
extraction from the Invitrogen kit17 1 (sequence complementary to wild type) in LNA format
d t t d i d lifi ti i th ild t l (C2) 0
extraction from the Invitrogen kit
demonstrated increased amplification in the wild-type sample (C2) 0
demonstrated increased amplification in the wild type sample (C2)
th i th t t l (C1)than in the mutant sample (C1).p ( )
• Amplification using an annealing temperature gradient and primer• Amplification using an annealing temperature gradient and primerg g g
17*2 (sequence complementary to mutant) in LNA format17 2 (sequence complementary to mutant) in LNA format
Average ratios (sample/control) of band intensities of DNA samples C1
demonstrated the ability to distinguish between the wild-type
Average ratios (sample/control) of band intensities of DNA samples C1
demonstrated the ability to distinguish between the wild-type and C2 amplified using annealing temperature gradient : LNA primer
sample (C2) and the mutated sample (C1) at an annealing 1
p g g p g p
17*2sample (C2) and the mutated sample (C1) at an annealing
t t f i t l 67 6°C
17 2
temperature of approximately 67.6°C 0.9te pe atu e o app o ate y 6 6 C
0 80.8
0 70.7
0 6 sample C10.6 sample C1
(C/T)
Optimal assay
0.5
(C/T)temperature
0.5
sample C2
0.4
sample C2
(C/T)(C/T)
0.3
0 20.2
0 10.1
00
5 Results of CYP2C9*3 Region Amplification5. Results of CYP2C9*3 Region Amplification 7 Conclusions
i ( l / l) f b d i i i f l
7. Conclusions
Average ratios (sample/control) of band intensities of DNA samples
• From the selection of primers tested for the CYP2C9*3 region two
g ( p / ) p
C1 and C2 amplified using annealing temperature gradient : LNA
It i ibl t ffi i tl i l t dFrom the selection of primers tested for the CYP2C9 3 region, two
0 8
C1 and C2 amplified using annealing temperature gradient : LNA
primer 3*1
• It is possible to efficiently isolate and
primers were chosen for locked nucleic acid (LNA) testing with 0.8 primer 3*1
p y
amplify DNA from an oral fluid sample usingprimers were chosen for locked nucleic acid (LNA) testing with
C i ll DNA l d t th i lifi ti ffi i f th *3
amplify DNA from an oral fluid sample using
Coriell DNA samples due to their amplification efficiency of the *3 0.7
p y p g
a commercially available centrifugationp p y
region
a commercially available centrifugation
region: 0.6 membrane kitg
• Primer 3 SNP site is included in the reverse primer for
0.6 membrane kit.
• Primer 3 – SNP site is included in the reverse primer for
0 5 • A PCR system was designed to identify
distinction between wild-type and mutated samples
0.5
sample C1
A PCR system was designed to identify
SNP k f f i iti itdistinction between wild-type and mutated samples
0 4
sample C1
( / )
SNP markers for warfarin sensitivityOptimal assay
• Primer 6 – SNP site is included in the reverse primer for 0.4 (A/A)
SNP markers for warfarin sensitivity
Th bi ti f l k d l i id
Optimal assay
temperaturePrimer 6 SNP site is included in the reverse primer for ( / )
l C2
• The combination of locked nucleic acidtemperature
distinction between wild-type and mutated samples 0.3 sample C2
(LNA) primers and PCR conditions selecteddistinction between wild type and mutated samples
A lifi ti i li t t di t d i
(A/C) (LNA) primers and PCR conditions selected
• Amplification using an annealing temperature gradient and primer 0.2
(A/C) ( )
allowed for the correct identification ofp g g p g p
3*1 (sequence complementary to wild type) in LNA format
0.2 allowed for the correct identification of
3*1 (sequence complementary to wild-type) in LNA format 0 1 samples containing the CYP2C9*2 and( q p y yp )
demonstrated increased amplification in the wild type sample (C1)
0.1 samples containing the CYP2C9 2 and
demonstrated increased amplification in the wild-type sample (C1)
0 CYP2C9*3 mutations as well as their
than in the mutant sample (C2)
0 CYP2C9 3 mutations as well as their
di ild tthan in the mutant sample (C2). corresponding wild-types.
• Amplification using an annealing temperature gradient and primer
co espo d g d types
Th DNA ki t ti th d iAmplification using an annealing temperature gradient and primer
3*3 ( l ) i LNA f
• The new DNA cookie extraction method is
3*3 (sequence complementary to mutant) in LNA format comparable to commercially available3 3 (sequence complementary to mutant) in LNA format
d t t d th bilit t di ti i h b t th ild t
comparable to commercially available
demonstrated the ability to distinguish between the wild-type column centrifugation DNA extraction kitsy g yp
sample (C1) and the mutated sample (C2) at an annealing
column centrifugation DNA extraction kits
sample (C1) and the mutated sample (C2) at an annealingp ( ) p ( ) g
temperature of approximately 67 6°C Average ratios (sample/control) of band intensities of DNA samplestemperature of approximately 67.6 C. Average ratios (sample/control) of band intensities of DNA samples
C1 and C2 amplified using annealing temperature gradient : LNA
• Results for the amplification of the Coriell DNA samples using LNA 1
C1 and C2 amplified using annealing temperature gradient : LNA
i *• Results for the amplification of the Coriell DNA samples using LNA 1
primer 3*3
primers 6*1 and 6*3 were similar to those of primer 3 0.9
p
8 Future workprimers 6 1 and 6 3 were similar to those of primer 3.
0 8
8. Future work
0.8
0 70.7
• Apply this PCR assay to oral fluid samples
0 6 sample C1
Apply this PCR assay to oral fluid samples
f bj t ith k CYP2C9*2 d0.6 p
(A/A) from subjects with known CYP2C9*2 andOptimal assay
0 5
(A/A) from subjects with known CYP2C9 2 and
CYP2C9*3 t
Optimal assay
temperature0.5
sample C2 CYP2C9*3 genotypes.temperature
0 4
sample C2
(A/C)
g yp
• Integration of PCR assay into a point of0.4 (A/C) • Integration of PCR assay into a point-of-
0.3 care device0.3 care device.
0.2 • Further use of the DNA cookie extraction
0 1
Further use of the DNA cookie extraction
0.1 method for isolation of DNA from oral fluids.
0
method for isolation of DNA from oral fluids.
0