SlideShare a Scribd company logo
1 of 1
Hourly wages adjusted for cost-of-living
Columbus
• Workers in Columbus will find their paycheck goes further when compared to the national average. After
adjusting for cost-of-living, the average hourly wage in Columbus sits at $24.33, nearly two dollars more
than the U.S. average. The nation’s lowest average hourly cost-of-living adjusted wage can be found in
Flagstaff, Arizona at $14.31, while the highest is located in Durham-Chapel Hill, N.C.at $29.92.
Source: JLL Research, Council for Community and Economic Research
Chart of the week: April 6, 2015
$22.39
$23.30
$24.33 $24.63
$26.92
$0
$5
$10
$15
$20
$25
$30
U.S. Average Cleveland Columbus Pittsburgh Detroit
2014 Average Hourly Cost-of-living Adjusted Wage

More Related Content

Viewers also liked

Aprendizaje colaborativo-Silvia Rodriguez UAA
Aprendizaje colaborativo-Silvia Rodriguez UAAAprendizaje colaborativo-Silvia Rodriguez UAA
Aprendizaje colaborativo-Silvia Rodriguez UAAsilrofle
 
Anexo2 proposta b_resolucao4235_calendario_escolar2014
Anexo2 proposta b_resolucao4235_calendario_escolar2014Anexo2 proposta b_resolucao4235_calendario_escolar2014
Anexo2 proposta b_resolucao4235_calendario_escolar2014Vera Guedes
 
Joao Resume 2015
Joao Resume 2015Joao Resume 2015
Joao Resume 2015Joao Costa
 
Capturing hearts mind and markets
Capturing hearts mind and marketsCapturing hearts mind and markets
Capturing hearts mind and marketsJeremy Dormand
 
La internet profunda o invisible
La  internet  profunda  o invisibleLa  internet  profunda  o invisible
La internet profunda o invisiblekarlacohaila
 
Estate science E-Brochure
Estate science E-BrochureEstate science E-Brochure
Estate science E-BrochureEstate Science
 
Presentación3
Presentación3Presentación3
Presentación31075668889
 
glosario de NTICS
glosario de NTICSglosario de NTICS
glosario de NTICSgabyanilu
 
Fiesta de-halloween
Fiesta de-halloweenFiesta de-halloween
Fiesta de-halloweenJavier M.
 
Propuesta alianza tecnologica marlon lopez
Propuesta alianza tecnologica marlon lopezPropuesta alianza tecnologica marlon lopez
Propuesta alianza tecnologica marlon lopezMARLONLOPEZD
 
Studie+modulbostäder+ +evidens+20150401
Studie+modulbostäder+ +evidens+20150401Studie+modulbostäder+ +evidens+20150401
Studie+modulbostäder+ +evidens+20150401Pierre Ringborg
 
Gabriela ayala tic's
Gabriela ayala tic'sGabriela ayala tic's
Gabriela ayala tic'sGaby Ayala
 

Viewers also liked (18)

JLL Columbus Chart of the Week: April 6, 2015
JLL Columbus Chart of the Week: April 6, 2015JLL Columbus Chart of the Week: April 6, 2015
JLL Columbus Chart of the Week: April 6, 2015
 
Aprendizaje colaborativo-Silvia Rodriguez UAA
Aprendizaje colaborativo-Silvia Rodriguez UAAAprendizaje colaborativo-Silvia Rodriguez UAA
Aprendizaje colaborativo-Silvia Rodriguez UAA
 
Anexo2 proposta b_resolucao4235_calendario_escolar2014
Anexo2 proposta b_resolucao4235_calendario_escolar2014Anexo2 proposta b_resolucao4235_calendario_escolar2014
Anexo2 proposta b_resolucao4235_calendario_escolar2014
 
Joao Resume 2015
Joao Resume 2015Joao Resume 2015
Joao Resume 2015
 
Capturing hearts mind and markets
Capturing hearts mind and marketsCapturing hearts mind and markets
Capturing hearts mind and markets
 
La internet profunda o invisible
La  internet  profunda  o invisibleLa  internet  profunda  o invisible
La internet profunda o invisible
 
JLL Columbus Chart of the Week: April 6, 2015
JLL Columbus Chart of the Week: April 6, 2015JLL Columbus Chart of the Week: April 6, 2015
JLL Columbus Chart of the Week: April 6, 2015
 
Estate science E-Brochure
Estate science E-BrochureEstate science E-Brochure
Estate science E-Brochure
 
Presentación3
Presentación3Presentación3
Presentación3
 
glosario de NTICS
glosario de NTICSglosario de NTICS
glosario de NTICS
 
Diapo de mi equipo
Diapo de mi equipoDiapo de mi equipo
Diapo de mi equipo
 
Fiesta de-halloween
Fiesta de-halloweenFiesta de-halloween
Fiesta de-halloween
 
Lukas
LukasLukas
Lukas
 
Propuesta alianza tecnologica marlon lopez
Propuesta alianza tecnologica marlon lopezPropuesta alianza tecnologica marlon lopez
Propuesta alianza tecnologica marlon lopez
 
Studie+modulbostäder+ +evidens+20150401
Studie+modulbostäder+ +evidens+20150401Studie+modulbostäder+ +evidens+20150401
Studie+modulbostäder+ +evidens+20150401
 
Ficha nombre maestros_areas
Ficha nombre maestros_areasFicha nombre maestros_areas
Ficha nombre maestros_areas
 
miniproj
miniprojminiproj
miniproj
 
Gabriela ayala tic's
Gabriela ayala tic'sGabriela ayala tic's
Gabriela ayala tic's
 

More from JLL_Midwest_Great_Lakes_Research

JLL Minneapolis-St. Paul Chart of the Week: September 28, 2015
JLL Minneapolis-St. Paul Chart of the Week: September 28, 2015JLL Minneapolis-St. Paul Chart of the Week: September 28, 2015
JLL Minneapolis-St. Paul Chart of the Week: September 28, 2015JLL_Midwest_Great_Lakes_Research
 

More from JLL_Midwest_Great_Lakes_Research (20)

JLL Indianapolis Chart of the Week
JLL Indianapolis Chart of the WeekJLL Indianapolis Chart of the Week
JLL Indianapolis Chart of the Week
 
Minneapolis–St. Paul Chart of the Week October 20, 2015
Minneapolis–St. Paul Chart of the Week October 20, 2015Minneapolis–St. Paul Chart of the Week October 20, 2015
Minneapolis–St. Paul Chart of the Week October 20, 2015
 
JLL Detroit Chart of the Week: October 19, 2015
JLL Detroit Chart of the Week: October 19, 2015JLL Detroit Chart of the Week: October 19, 2015
JLL Detroit Chart of the Week: October 19, 2015
 
Office Insight Q3 2015-Grand Rapids
Office Insight Q3 2015-Grand RapidsOffice Insight Q3 2015-Grand Rapids
Office Insight Q3 2015-Grand Rapids
 
Office Insight Q3 2015 | Minneapolis-St. Paul
Office Insight Q3 2015 | Minneapolis-St. PaulOffice Insight Q3 2015 | Minneapolis-St. Paul
Office Insight Q3 2015 | Minneapolis-St. Paul
 
JLL Cleveland Office Insight - Q3 2015
JLL Cleveland Office Insight - Q3 2015JLL Cleveland Office Insight - Q3 2015
JLL Cleveland Office Insight - Q3 2015
 
JLL Pittsburgh Office Insight - Q3 2015
JLL Pittsburgh Office Insight - Q3 2015JLL Pittsburgh Office Insight - Q3 2015
JLL Pittsburgh Office Insight - Q3 2015
 
Office Insight Q3 2015-Chicago CBD
Office Insight Q3 2015-Chicago CBDOffice Insight Q3 2015-Chicago CBD
Office Insight Q3 2015-Chicago CBD
 
Indianapolis JLL Employment Update - October 2015
Indianapolis JLL Employment Update - October 2015Indianapolis JLL Employment Update - October 2015
Indianapolis JLL Employment Update - October 2015
 
Leasing Activity Sheet Q3 2015-Detroit
Leasing Activity Sheet Q3 2015-DetroitLeasing Activity Sheet Q3 2015-Detroit
Leasing Activity Sheet Q3 2015-Detroit
 
Office Insight Q3 2015-Detroit
Office Insight Q3 2015-DetroitOffice Insight Q3 2015-Detroit
Office Insight Q3 2015-Detroit
 
Minneapolis St. Paul - Employment Update October 2015
Minneapolis St. Paul - Employment Update October 2015Minneapolis St. Paul - Employment Update October 2015
Minneapolis St. Paul - Employment Update October 2015
 
Chicago JLL employment update - October 2015
Chicago JLL employment update - October 2015Chicago JLL employment update - October 2015
Chicago JLL employment update - October 2015
 
Jll Detroit Employment Update October 2015
Jll Detroit Employment Update October 2015Jll Detroit Employment Update October 2015
Jll Detroit Employment Update October 2015
 
JLL Chart of the Week - Indianapolis
JLL Chart of the Week - IndianapolisJLL Chart of the Week - Indianapolis
JLL Chart of the Week - Indianapolis
 
JLL Office Insight Q3 2015 - Indianapolis
JLL Office Insight Q3 2015 - IndianapolisJLL Office Insight Q3 2015 - Indianapolis
JLL Office Insight Q3 2015 - Indianapolis
 
JLL Minneapolis-St. Paul Chart of the Week: September 28, 2015
JLL Minneapolis-St. Paul Chart of the Week: September 28, 2015JLL Minneapolis-St. Paul Chart of the Week: September 28, 2015
JLL Minneapolis-St. Paul Chart of the Week: September 28, 2015
 
Chart of the Week - Indianapolis
Chart of the Week - IndianapolisChart of the Week - Indianapolis
Chart of the Week - Indianapolis
 
JLL Detroit Chart of the Week: September 14, 2015
JLL Detroit Chart of the Week: September 14, 2015JLL Detroit Chart of the Week: September 14, 2015
JLL Detroit Chart of the Week: September 14, 2015
 
JLL Chicago Chart of the Week - September 14, 2015
JLL Chicago Chart of the Week - September 14, 2015JLL Chicago Chart of the Week - September 14, 2015
JLL Chicago Chart of the Week - September 14, 2015
 

Cmh cow 4 6 2015 (cost of living adjusted wage)

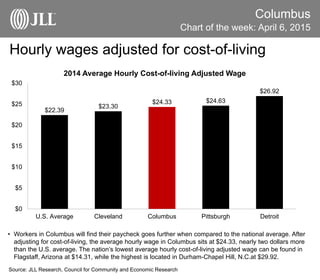
  • 1. Hourly wages adjusted for cost-of-living Columbus • Workers in Columbus will find their paycheck goes further when compared to the national average. After adjusting for cost-of-living, the average hourly wage in Columbus sits at $24.33, nearly two dollars more than the U.S. average. The nation’s lowest average hourly cost-of-living adjusted wage can be found in Flagstaff, Arizona at $14.31, while the highest is located in Durham-Chapel Hill, N.C.at $29.92. Source: JLL Research, Council for Community and Economic Research Chart of the week: April 6, 2015 $22.39 $23.30 $24.33 $24.63 $26.92 $0 $5 $10 $15 $20 $25 $30 U.S. Average Cleveland Columbus Pittsburgh Detroit 2014 Average Hourly Cost-of-living Adjusted Wage