SlideShare a Scribd company logo
1 of 1
Download to read offline
Evolution of target shape with time (16um shift)
2D-simulation (x-y geometry)
3D-simulation:
3D-simulation: x-z cross-section (calculation unfinished)
2D vs. 3D:
Slower plasma spreading
→ lesser electron density gradient
→ greater laser absorption
→ greater plasma temperature ( 2D , 3D )
→ greater pressure on droplet
→ greater tilt angle.
Difference in tilt angle can be as much as 2.
Unfortunately, 3D calculation has not been finished yet. But from 2D we can see
further evolution of density:
8 m shift 16 m shift 24 m shift
Time dependency of target tilt
Density (color) and temperature (lines) distribution on 3 ns
x-z cross-section
Angle 0º Angle 30º Angle 60º
y-z cross-section
Angle 0º Angle 30º Angle 60º
Radiation power (from postprocessing ray tracing):
The main goal of the work is to demonstrate the possibilities of self-consistent 3D
modeling of EUV source on example of two non-axisymmetric problems:
• Shifted from axis laser beam coupling to droplet
• Oblique laser incidence on planar target
The first type of situation arises from the impossibility of getting the perfect laser
targeting in real device: there is always some mismatch, and it’s important to find
effect of such mismatching on target behavior.
The second type of situations occurs after using of mismatched prepulse, which
causes tilted disk-like targets.
Objective
1 RnD-ISAN, Troitsk, 142190, Russia
2 Keldysh Institute of Applied Mathematics RAS, Moscow , 125047, Russia
This work is supported by the Russian Foundation of Science (Project № 14-11-00699)
I.P. Tsygvintsev1,2, A.Yu. Krukovskiy1,2, V.G. Novikov1,2
3D SIMULATION OF SHIFTED LASER
PULSE COUPLING TO TIN TARGET
Modeling approach
• Two-temperature one-fluid radiation gas dynamics;
• Non-stationary ionization;
• Diffusion approximation or ray tracing procedure for radiation transport;
• Laser absorption accounting refraction and reflection processes;
• Wide-range tabulated two phase equation of state;
• Opacity and emissivity are calculated by using interpolation between transparent
and opaque cases for nonLTE plasma;
• Non-explicit full conservative Euler-Lagrange numerical scheme.
Oblique laser incidence on bulk target
Laser parameters:
2
11 2
1.064 ,
200 ,
0.1 ,
1.5 ,
4 10 /
e
FWHM
max
m
D m
E J
ns
I W cm
D
Commentary:
• In investigated case we did not found any significant effect of laser tilt on calculated integral CE.
The main reason for such result is infinite target thickness: laser tilt result only in decrease of
effective intensity (in cos θ times), and due to the flatness of CE as function of intensity near the
optimum, we have the same CE in all calculations.
• Calculated CE was ~1.8% with in-line short characteristics radiation transport. In-line diffusion gave
~3.6% in-band, which seems overestimated, but plasma dynamics shows no significant differences.
Postprocessing ray-tracing gave ~1.3 %.
Shifted droplet target
Laser parameters:
2
11 2
1.064 ,
160 ,
3 ,
100 ,
3 10 /
e
FWHM
max
m
D m
E J
ns
I W cm
D
Conclusion
• 2D-simulation shows greater tilt angle then 3D-simulation. Relative difference can
be as great as 2 time. This effect can be caused greater laser absorption due to more
sloping gradient of electron density.
• Also, it should be noticed, that 2D simulation reveal linear dependency of resulting
tilt angle as function of shift. Calculated coefficient ~2 per 1 m shift.
• In 3D simulation we expect coefficient ~1 –1.5 per 1 m shirt.

More Related Content

What's hot

Parametric Shape Optimization of Lattice Structures for Phononic Band Gaps
Parametric Shape Optimization of Lattice Structures for Phononic Band GapsParametric Shape Optimization of Lattice Structures for Phononic Band Gaps
Parametric Shape Optimization of Lattice Structures for Phononic Band GapsFabian Wein
 
Davis scholars studiopresentation
Davis scholars studiopresentationDavis scholars studiopresentation
Davis scholars studiopresentationbndavis18
 
Real time Canny edge detection
Real time Canny edge detectionReal time Canny edge detection
Real time Canny edge detectionShashank Kapoor
 
2017 09-29 ndt loop closure
2017 09-29 ndt loop closure2017 09-29 ndt loop closure
2017 09-29 ndt loop closureiMorpheus ai
 
Extrapolation
ExtrapolationExtrapolation
Extrapolationjonathan
 
Evaluation of the Sensitivity of Seismic Inversion Algorithms to Different St...
Evaluation of the Sensitivity of Seismic Inversion Algorithms to Different St...Evaluation of the Sensitivity of Seismic Inversion Algorithms to Different St...
Evaluation of the Sensitivity of Seismic Inversion Algorithms to Different St...IJERA Editor
 

What's hot (13)

Parametric Shape Optimization of Lattice Structures for Phononic Band Gaps
Parametric Shape Optimization of Lattice Structures for Phononic Band GapsParametric Shape Optimization of Lattice Structures for Phononic Band Gaps
Parametric Shape Optimization of Lattice Structures for Phononic Band Gaps
 
Davis scholars studiopresentation
Davis scholars studiopresentationDavis scholars studiopresentation
Davis scholars studiopresentation
 
EGU2016-2988
EGU2016-2988EGU2016-2988
EGU2016-2988
 
Poster_Srivatsan_ver_6
Poster_Srivatsan_ver_6Poster_Srivatsan_ver_6
Poster_Srivatsan_ver_6
 
Extrapolation
ExtrapolationExtrapolation
Extrapolation
 
Real time Canny edge detection
Real time Canny edge detectionReal time Canny edge detection
Real time Canny edge detection
 
Canny Edge Detection
Canny Edge DetectionCanny Edge Detection
Canny Edge Detection
 
2017 09-29 ndt loop closure
2017 09-29 ndt loop closure2017 09-29 ndt loop closure
2017 09-29 ndt loop closure
 
final press-rev-Linkedin
final press-rev-Linkedinfinal press-rev-Linkedin
final press-rev-Linkedin
 
Extrapolation
ExtrapolationExtrapolation
Extrapolation
 
Extrapolation
ExtrapolationExtrapolation
Extrapolation
 
LO9
LO9LO9
LO9
 
Evaluation of the Sensitivity of Seismic Inversion Algorithms to Different St...
Evaluation of the Sensitivity of Seismic Inversion Algorithms to Different St...Evaluation of the Sensitivity of Seismic Inversion Algorithms to Different St...
Evaluation of the Sensitivity of Seismic Inversion Algorithms to Different St...
 

Similar to Poster_3D_v04

Ec 2401 wireless communication unit 2
Ec 2401 wireless communication   unit 2Ec 2401 wireless communication   unit 2
Ec 2401 wireless communication unit 2JAIGANESH SEKAR
 
nanoscale xrd
nanoscale xrdnanoscale xrd
nanoscale xrdAun Ahsan
 
Characterization of nanoparticles
Characterization of nanoparticlesCharacterization of nanoparticles
Characterization of nanoparticlesupinderpalsingh2
 
K147897
K147897K147897
K147897irjes
 
Development of A 3d Model Eddy Current Testing
Development of A 3d Model Eddy Current TestingDevelopment of A 3d Model Eddy Current Testing
Development of A 3d Model Eddy Current Testinginventionjournals
 
Mapping WGMs of erbium doped glass microsphere using near-field optical probe...
Mapping WGMs of erbium doped glass microsphere using near-field optical probe...Mapping WGMs of erbium doped glass microsphere using near-field optical probe...
Mapping WGMs of erbium doped glass microsphere using near-field optical probe...NuioKila
 
The distribution and_annihilation_of_dark_matter_around_black_holes
The distribution and_annihilation_of_dark_matter_around_black_holesThe distribution and_annihilation_of_dark_matter_around_black_holes
The distribution and_annihilation_of_dark_matter_around_black_holesSérgio Sacani
 
New folderelec425_2016_hw5.pdfMar 25, 2016 ELEC 425 S.docx
New folderelec425_2016_hw5.pdfMar 25, 2016 ELEC 425 S.docxNew folderelec425_2016_hw5.pdfMar 25, 2016 ELEC 425 S.docx
New folderelec425_2016_hw5.pdfMar 25, 2016 ELEC 425 S.docxcurwenmichaela
 
Adc lab experimets
Adc lab experimetsAdc lab experimets
Adc lab experimetsishan111
 
Radar 2009 a 7 radar cross section 2
Radar 2009 a 7 radar cross section 2Radar 2009 a 7 radar cross section 2
Radar 2009 a 7 radar cross section 2Forward2025
 
Laser Pulsing in Linear Compton Scattering
Laser Pulsing in Linear Compton ScatteringLaser Pulsing in Linear Compton Scattering
Laser Pulsing in Linear Compton ScatteringTodd Hodges
 
Modelling Optical Waveguide Bends by the Method of Lines
Modelling Optical Waveguide Bends by the Method of LinesModelling Optical Waveguide Bends by the Method of Lines
Modelling Optical Waveguide Bends by the Method of LinesTELKOMNIKA JOURNAL
 

Similar to Poster_3D_v04 (20)

Ec 2401 wireless communication unit 2
Ec 2401 wireless communication   unit 2Ec 2401 wireless communication   unit 2
Ec 2401 wireless communication unit 2
 
nanoscale xrd
nanoscale xrdnanoscale xrd
nanoscale xrd
 
Characterization of nanoparticles
Characterization of nanoparticlesCharacterization of nanoparticles
Characterization of nanoparticles
 
Lecture 12 2013_
Lecture 12 2013_Lecture 12 2013_
Lecture 12 2013_
 
Swi seminar final
Swi seminar finalSwi seminar final
Swi seminar final
 
K147897
K147897K147897
K147897
 
Tearhertz Sub-Nanometer Sub-Surface Imaging of 2D Materials
Tearhertz Sub-Nanometer Sub-Surface Imaging of 2D MaterialsTearhertz Sub-Nanometer Sub-Surface Imaging of 2D Materials
Tearhertz Sub-Nanometer Sub-Surface Imaging of 2D Materials
 
My Prize Winning Physics Poster from 2006
My Prize Winning Physics Poster from 2006My Prize Winning Physics Poster from 2006
My Prize Winning Physics Poster from 2006
 
Development of A 3d Model Eddy Current Testing
Development of A 3d Model Eddy Current TestingDevelopment of A 3d Model Eddy Current Testing
Development of A 3d Model Eddy Current Testing
 
Mapping WGMs of erbium doped glass microsphere using near-field optical probe...
Mapping WGMs of erbium doped glass microsphere using near-field optical probe...Mapping WGMs of erbium doped glass microsphere using near-field optical probe...
Mapping WGMs of erbium doped glass microsphere using near-field optical probe...
 
The distribution and_annihilation_of_dark_matter_around_black_holes
The distribution and_annihilation_of_dark_matter_around_black_holesThe distribution and_annihilation_of_dark_matter_around_black_holes
The distribution and_annihilation_of_dark_matter_around_black_holes
 
Chapter 5 diffraction
Chapter 5 diffractionChapter 5 diffraction
Chapter 5 diffraction
 
New folderelec425_2016_hw5.pdfMar 25, 2016 ELEC 425 S.docx
New folderelec425_2016_hw5.pdfMar 25, 2016 ELEC 425 S.docxNew folderelec425_2016_hw5.pdfMar 25, 2016 ELEC 425 S.docx
New folderelec425_2016_hw5.pdfMar 25, 2016 ELEC 425 S.docx
 
Adc lab experimets
Adc lab experimetsAdc lab experimets
Adc lab experimets
 
Radar 2009 a 7 radar cross section 2
Radar 2009 a 7 radar cross section 2Radar 2009 a 7 radar cross section 2
Radar 2009 a 7 radar cross section 2
 
Radar Systems Engineering L7P2
Radar Systems Engineering L7P2Radar Systems Engineering L7P2
Radar Systems Engineering L7P2
 
Laser Pulsing in Linear Compton Scattering
Laser Pulsing in Linear Compton ScatteringLaser Pulsing in Linear Compton Scattering
Laser Pulsing in Linear Compton Scattering
 
cfd ahmed body
cfd ahmed bodycfd ahmed body
cfd ahmed body
 
99995069.ppt
99995069.ppt99995069.ppt
99995069.ppt
 
Modelling Optical Waveguide Bends by the Method of Lines
Modelling Optical Waveguide Bends by the Method of LinesModelling Optical Waveguide Bends by the Method of Lines
Modelling Optical Waveguide Bends by the Method of Lines
 

Poster_3D_v04

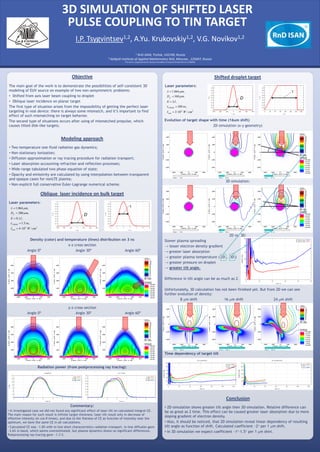
  • 1. Evolution of target shape with time (16um shift) 2D-simulation (x-y geometry) 3D-simulation: 3D-simulation: x-z cross-section (calculation unfinished) 2D vs. 3D: Slower plasma spreading → lesser electron density gradient → greater laser absorption → greater plasma temperature ( 2D , 3D ) → greater pressure on droplet → greater tilt angle. Difference in tilt angle can be as much as 2. Unfortunately, 3D calculation has not been finished yet. But from 2D we can see further evolution of density: 8 m shift 16 m shift 24 m shift Time dependency of target tilt Density (color) and temperature (lines) distribution on 3 ns x-z cross-section Angle 0º Angle 30º Angle 60º y-z cross-section Angle 0º Angle 30º Angle 60º Radiation power (from postprocessing ray tracing): The main goal of the work is to demonstrate the possibilities of self-consistent 3D modeling of EUV source on example of two non-axisymmetric problems: • Shifted from axis laser beam coupling to droplet • Oblique laser incidence on planar target The first type of situation arises from the impossibility of getting the perfect laser targeting in real device: there is always some mismatch, and it’s important to find effect of such mismatching on target behavior. The second type of situations occurs after using of mismatched prepulse, which causes tilted disk-like targets. Objective 1 RnD-ISAN, Troitsk, 142190, Russia 2 Keldysh Institute of Applied Mathematics RAS, Moscow , 125047, Russia This work is supported by the Russian Foundation of Science (Project № 14-11-00699) I.P. Tsygvintsev1,2, A.Yu. Krukovskiy1,2, V.G. Novikov1,2 3D SIMULATION OF SHIFTED LASER PULSE COUPLING TO TIN TARGET Modeling approach • Two-temperature one-fluid radiation gas dynamics; • Non-stationary ionization; • Diffusion approximation or ray tracing procedure for radiation transport; • Laser absorption accounting refraction and reflection processes; • Wide-range tabulated two phase equation of state; • Opacity and emissivity are calculated by using interpolation between transparent and opaque cases for nonLTE plasma; • Non-explicit full conservative Euler-Lagrange numerical scheme. Oblique laser incidence on bulk target Laser parameters: 2 11 2 1.064 , 200 , 0.1 , 1.5 , 4 10 / e FWHM max m D m E J ns I W cm D Commentary: • In investigated case we did not found any significant effect of laser tilt on calculated integral CE. The main reason for such result is infinite target thickness: laser tilt result only in decrease of effective intensity (in cos θ times), and due to the flatness of CE as function of intensity near the optimum, we have the same CE in all calculations. • Calculated CE was ~1.8% with in-line short characteristics radiation transport. In-line diffusion gave ~3.6% in-band, which seems overestimated, but plasma dynamics shows no significant differences. Postprocessing ray-tracing gave ~1.3 %. Shifted droplet target Laser parameters: 2 11 2 1.064 , 160 , 3 , 100 , 3 10 / e FWHM max m D m E J ns I W cm D Conclusion • 2D-simulation shows greater tilt angle then 3D-simulation. Relative difference can be as great as 2 time. This effect can be caused greater laser absorption due to more sloping gradient of electron density. • Also, it should be noticed, that 2D simulation reveal linear dependency of resulting tilt angle as function of shift. Calculated coefficient ~2 per 1 m shift. • In 3D simulation we expect coefficient ~1 –1.5 per 1 m shirt.